

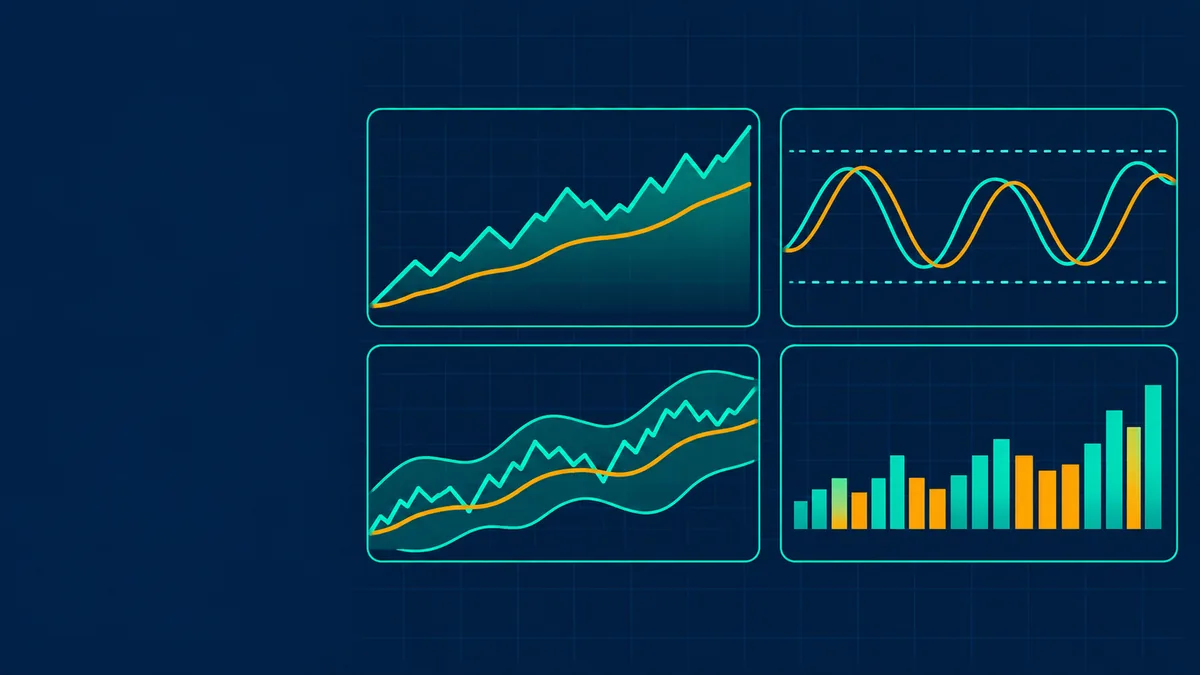
Technical indicators are formulas applied to price and volume to summarise what the market is doing. There are hundreds, but most fall into a few groups, and each group answers a different question. This guide lists the main ones, with a link to a worked guide for each.
The four questions indicators answer
| Group | Question | Examples |
|---|---|---|
| Trend | Which way is price moving, and is there a trend at all? | Moving averages, MACD, Supertrend, ADX |
| Momentum | How fast is price moving, and is the move stretched? | RSI, stochastic, Williams %R, CCI, ROC |
| Volatility | How large are the moves? | Bollinger Bands, ATR, India VIX |
| Volume | Is there participation behind the move? | Volume, OBV, VWAP, open interest |
See what markets are pricing in
Live indices, sector moves and market breadth — the backdrop to every story we publish.
All indicators by group
Trend
Momentum
Volatility
Volume and positioning
Support and resistance
Get research like this in your inbox
The week’s research that mattered, in five minutes. Joined by 2L+ investors.
How to choose, and combine, indicators
- Use one from each group at most. Indicators in the same group, such as RSI, stochastic and Williams %R, mostly repeat each other and add false confidence.
- Match the tool to the market. Trend tools work in trending markets and fail in ranges, while oscillators work in ranges and fail in strong trends. The ADX helps tell which one applies.
- Know that most are lagging. They are calculated from past prices, so they confirm moves after they have begun.
- Keep settings standard. Adjusting periods until the past looks good is a form of overfitting and rarely holds up.
Testing before trusting
A rule that looks convincing on a few charts may not hold up across many stocks and years. Systematic investors test signals on large samples, account for costs, and keep part of the data unseen. See backtesting , out-of-sample testing and transaction costs. Indicators describe price behaviour, and nothing in them guarantees what comes next. For the wider picture see technical analysis and trend analysis.
Large caps or small caps: who is winning?
Nifty, midcap and smallcap returns from one day to ten years, with the spread and valuation by segment.
Frequently Asked Questions
What are the main types of technical indicators?
Trend, momentum, volatility and volume indicators, plus support and resistance levels.
Which technical indicator is the most reliable?
None is reliable on its own. Each works in some conditions and fails in others, so they are usually combined and tested.
How many indicators should I use?
Usually a few from different groups, such as one for trend, one for momentum and one for volume. Several from the same group add little.
Are technical indicators leading or lagging?
Most are lagging because they are calculated from past prices. Some oscillators are called leading, but they also depend on past data.
This article is for education only and is not investment advice. Indicator readings describe past price behaviour and do not predict future returns.



