

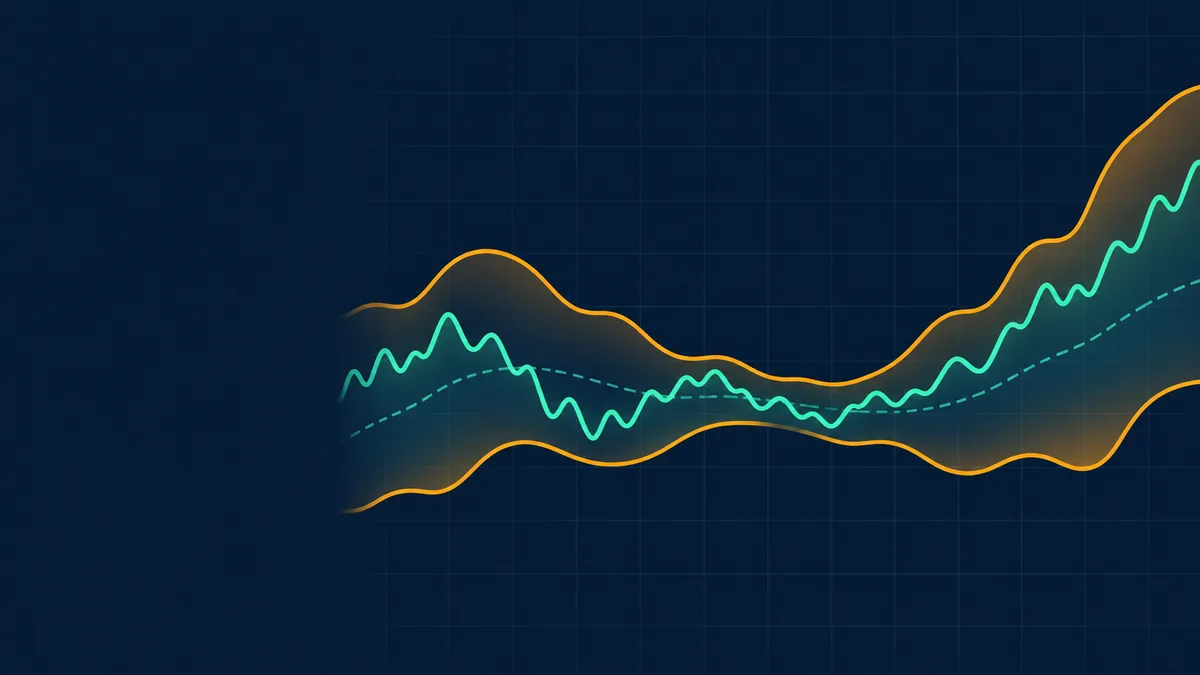
Bollinger Bands are a volatility indicator that draws a channel around price. The channel widens when prices swing more and narrows when they calm down, which makes it useful for judging how stretched a move is. John Bollinger developed them in the 1980s.
How Bollinger Bands are built
The standard setting uses three lines:
- Middle band: a 20-day simple moving average of the closing price.
- Upper band: middle band + 2 x the 20-day standard deviation of closes.
- Lower band: middle band - 2 x the 20-day standard deviation.
Standard deviation measures how far prices typically stray from their average. If returns were normally distributed, about 95% of closes would fall inside the bands. Real prices have fatter tails, so moves outside the bands happen more often than that.
See what markets are pricing in
Live indices, sector moves and market breadth — the backdrop to every story we publish.
A worked example
Suppose a stock's 20-day average close is Rs 100 and the 20-day standard deviation is Rs 2.5. The numbers are illustrative.
| Item | Calculation | Value |
|---|---|---|
| Upper band | 100 + 2 x 2.5 | Rs 105 |
| Lower band | 100 - 2 x 2.5 | Rs 95 |
| Bandwidth | (105 - 95) / 100 | 10% |
| %B at a price of Rs 103 | (103 - 95) / (105 - 95) | 0.80 |
Bandwidth shows how wide the bands are relative to the average, and %B shows where the price sits inside them: 0 at the lower band, 1 at the upper band, above 1 or below 0 when price is outside.
Get research like this in your inbox
The week’s research that mattered, in five minutes. Joined by 2L+ investors.
Common ways traders read them
- The squeeze: bandwidth falling to a multi-month low shows unusually low volatility. Volatility tends to cluster and revert, so a squeeze is often followed by a larger move, but the indicator does not say which direction.
- Walking the band: in a strong trend, price can hug the upper or lower band for days. A touch of the band in a trend is not by itself a reversal signal.
- Mean reversion: in range-bound markets, traders watch moves back toward the middle band after a touch of an outer band. See mean reversion.
Limits to keep in mind
- Bands are built from past prices, so they lag.
- A close outside the band is not an automatic buy or sell. In trends it can signal strength.
- Settings (20, 2) are conventions. Changing them to fit past data risks overfitting.
- They work best alongside other information, such as volume , RSI or trend analysis.
Large caps or small caps: who is winning?
Nifty, midcap and smallcap returns from one day to ten years, with the spread and valuation by segment.
Frequently Asked Questions
What are Bollinger Bands?
They are a volatility indicator made of a 20-day moving average and two bands set 2 standard deviations above and below it.
What does a Bollinger Band squeeze mean?
It means volatility has fallen to a low level and the bands have narrowed. Larger moves often follow, but the direction is not indicated.
Is touching the upper band a sell signal?
Not by itself. In strong uptrends price can stay near the upper band for a long time. Traders usually look for confirmation from other signals.
What are the best Bollinger Band settings?
The standard 20-period and 2 standard deviations is the default. Other settings exist, but they should be tested out of sample and not fitted to past data.
This article is for education only and is not investment advice. Indicator readings describe past price behaviour and do not predict future returns.



