

An index can rise even when a surprisingly large number of shares are falling. The reason is weighting: gains in a few influential companies may outweigh weakness elsewhere. Market breadth looks beneath the headline index and asks how widely a move is shared.
For investors, this is useful context rather than a standalone buy or sell signal. This guide explains the main measures, how to compare them with Nifty and how to avoid common interpretation errors.
What Is Market Breadth?
The simplest market breadth meaning is the degree of participation in a market move. If many stocks rise with an index, participation is broad. If the index rises while most stocks fall, participation is narrow. Analysts usually measure this by comparing advancing and declining securities, new highs and lows, or the percentage of stocks above a moving average.
The population matters. A reading for Nifty 50 constituents answers a different question from an exchange-wide NSE reading. The time horizon matters too: daily advances show short-term participation, while the share of stocks above a 200-day moving average describes a longer trend.
NSE publishes advances, declines and unchanged securities in its market statistics. Anyone checking market breadth today should note the timestamp, market segment and eligible universe before drawing a conclusion.
See what markets are pricing in
Live indices, sector moves and market breadth — the backdrop to every story we publish.
Why Market Breadth Matters to Investors
Nifty 50 is a free-float market-capitalisation-weighted index. Larger constituents therefore exert more influence on the index than smaller ones. Breadth treats each security as one observation, exposing information that an index level can conceal.
Broad participation can confirm that demand extends beyond a small leadership group. Narrow participation can indicate concentration, rotation or fragility, but it does not prove an immediate reversal. A healthy advance may temporarily narrow as investors favour defensive or high-quality stocks; weak participation can also improve before the headline index bottoms.
Investors can use Wright Research's market dashboards to place participation signals alongside trend, valuation and macro data rather than relying on one number.
| Index move | Breadth behaviour | Possible interpretation |
|---|---|---|
| Index rises | Most stocks rise | Broad confirmation |
| Index rises | Most stocks fall | Narrow leadership or divergence |
| Index falls | Most stocks fall | Broad weakness |
| Index falls | More stocks begin rising | Possible internal improvement |
Key Market Breadth Indicators
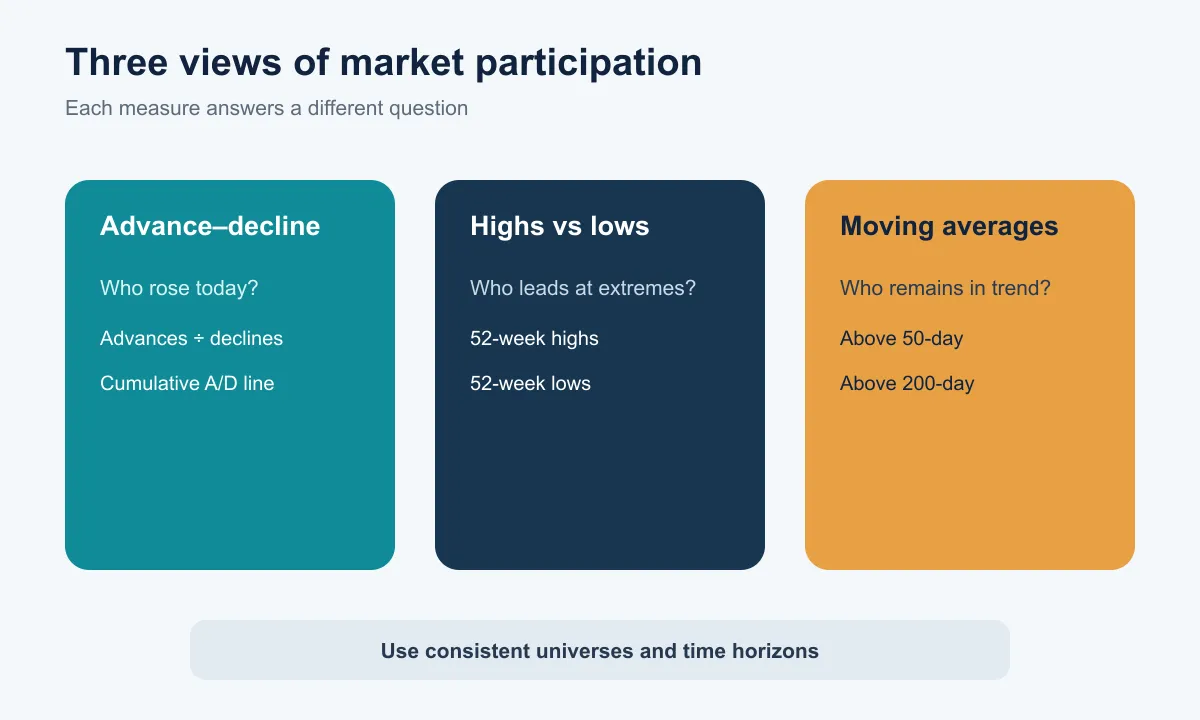
Different market breadth indicators answer different questions. A daily advance-decline measure tracks immediate participation; highs and lows capture leadership at extremes; moving-average measures show how many stocks remain in established trends.
Advance-Decline Ratio and Line
The advance-decline ratio is:
Advancing stocks ÷ declining stocks
A ratio above 1 means more stocks advanced than declined; below 1 means the opposite. When 1,800 securities rise and 1,200 fall, the ratio is 1.5. The ratio should be compared with its own history because the tradable universe and market regime change.
The advance-decline line is cumulative. Each session's net advances—advancers minus decliners—are added to the previous total. A rising line shows sustained positive participation. If Nifty makes a new high while the line does not, that negative divergence may flag weakening participation. This breadth indicator is informative, not deterministic.
New Highs vs New Lows
This measure compares stocks reaching new 52-week highs with those reaching new 52-week lows. Many new highs suggest expanding leadership; many new lows indicate broad deterioration. The net-new-highs figure subtracts lows from highs, while a ratio divides one by the other.
A market can show more daily advancers yet still have many new lows. That combination suggests a short-term bounce inside a weaker long-term structure. These market breadth indicators work best when several measures tell a consistent story.
Stocks Above Key Moving Averages
Analysts often calculate the percentage of a defined universe above its 20-day, 50-day or 200-day moving average. Shorter averages react quickly; the 200-day measure changes slowly and is commonly used for the primary trend.
If Nifty rises but the percentage above the 50-day average falls, fewer stocks are supporting the advance. Extreme readings can identify unusually strong or weak participation, but there is no universal threshold that guarantees a reversal.
Get research like this in your inbox
The week’s research that mattered, in five minutes. Joined by 2L+ investors.
How to Read Market Breadth Alongside Nifty
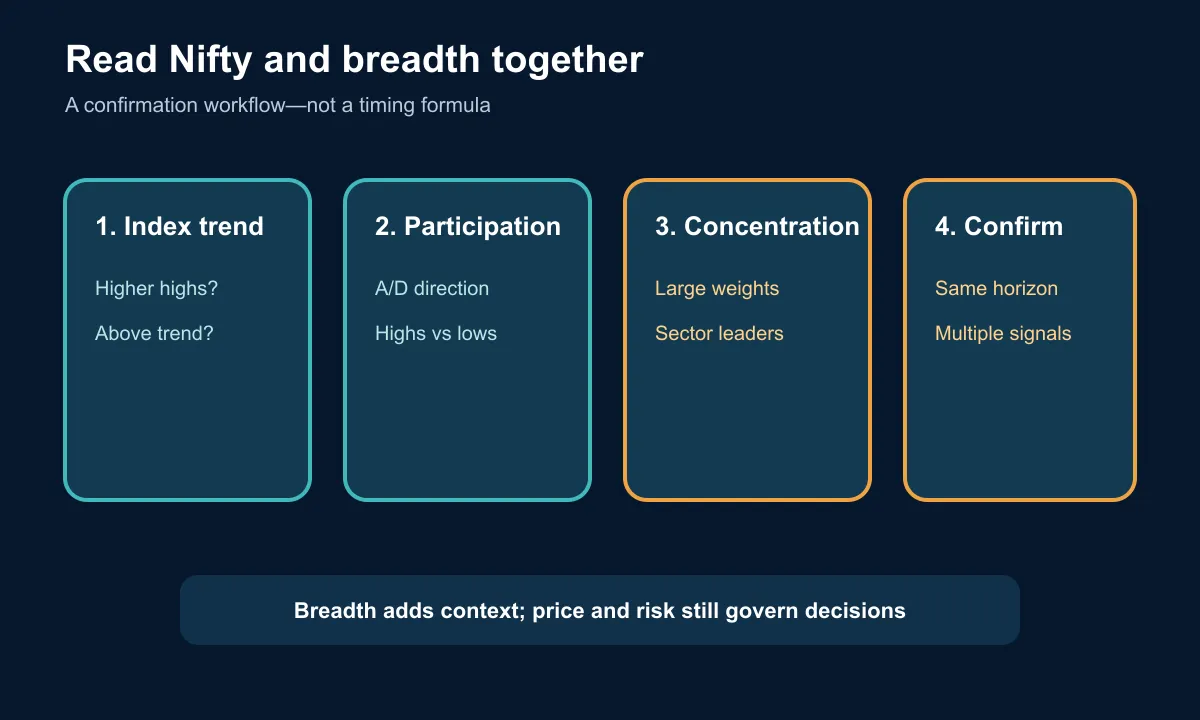
Start with the index trend, then compare direction, level and rate of change in breadth over the same period. Avoid mixing a daily NSE advance-decline count with a monthly Nifty conclusion.
A practical sequence is:
- Define the universe: Nifty 50, Nifty 500 or exchange-wide securities.
- Match the horizon: daily, intermediate or long term.
- Compare index highs and lows with the breadth series.
- Check whether several measures confirm the same message.
- Look for sector concentration and major index weights.
- Use price, risk and portfolio objectives to decide any action.
The Wright Research index list helps distinguish benchmark universes. For market breadth NSE analysis, an exchange-wide count may include thousands of securities, while Nifty 50 breadth contains only 50 constituents.
Market Breadth Examples in the Indian Market
Consider a simplified market breadth example. Nifty gains 0.8% because a handful of large banks and technology companies rally. Across NSE, 1,200 stocks advance, 2,000 decline and 100 are unchanged. The advance-decline ratio is 0.60 despite the positive index close. The session shows narrow leadership, not broad strength.
Now suppose Nifty falls 0.3%, but advances exceed declines for several sessions and fewer stocks make new 52-week lows. That does not guarantee a bottom. It does show that internal conditions may be improving before the weighted index confirms them.
| Session | Advances | Declines | A/D ratio | Nifty move | Reading |
|---|---|---|---|---|---|
| A | 1,200 | 2,000 | 0.60 | +0.8% | Narrow positive index move |
| B | 2,100 | 1,300 | 1.62 | +0.5% | Broad confirmation |
| C | 1,850 | 1,500 | 1.23 | -0.3% | Possible internal improvement |
When reviewing market breadth NSE data, filter for comparable series and dates. New listings, suspended securities and changes in eligibility can affect totals. The Wright Research stock research platform can then help investigate which sectors and companies explain the split.
Limitations of Breadth Indicators
Breadth is sensitive to universe construction. Equal treatment gives a tiny illiquid company the same count as a large liquid one, even though their market impact differs. Exchange-wide data may also contain securities that are not relevant to a particular portfolio.
Signals can remain divergent for long periods. Narrow leadership sometimes persists while the index keeps climbing, so using divergence as a precise timing tool can be costly. Corporate actions, index rebalancing, different data vendors and missing observations can also alter a series.
Another market breadth meaning pitfall is assuming “more advancers” always means a healthy market. Low-quality or speculative shares can drive a short-lived breadth surge. Turnover, liquidity, sector participation and the durability of the move still matter.
Treat each breadth indicator as supporting evidence. Combine trend, valuation, earnings, volatility and portfolio exposure, and avoid changing a long-term allocation because of one session.
Run the numbers on your next investment
Project returns on a lumpsum or SIP with our free calculators.
FAQ
Can the Nifty rise while most listed stocks are declining?
Yes. Because Nifty 50 is weighted by free-float market capitalisation, gains in a few large constituents can outweigh declines in many smaller stocks. This is why participation data can differ from the headline index.
What is a breadth thrust, and why do traders watch it?
A breadth thrust is a rapid shift from weak to unusually strong participation, usually measured with advances, declines or the share of stocks rising. Traders watch it as evidence of forceful demand, but definitions vary and no threshold guarantees continued gains.
How can weakening market breadth signal a rally is losing momentum?
If an index makes higher highs while the advance-decline line, new highs or stocks above moving averages trend lower, leadership is narrowing. That divergence can flag vulnerability, though it may persist without an immediate market fall.
Are market-breadth indicators useful for long-term investors as well as traders?
Yes. Traders may use daily participation for timing context, while long-term investors can monitor 200-day participation and sustained new-high/new-low trends to assess regime strength. Neither replaces asset allocation or company research.
The most useful approach is to read market breadth as a measure of participation, not prophecy. Define the universe, align the time horizon and seek confirmation across more than one measure.