
“Technical Analysis works precisely because people are watching it. And if people care, then I care” - John Bollinger.
Unlike the fundamentals, technical signals look at market psychology. Of course, the psychology of the market is hard to predict, but technical indicators form substantial clues that can help us decrypt the markets.
In today’s post, we will crystal gaze into the future by looking at the technical setup of the significant market charts.
Nifty 50
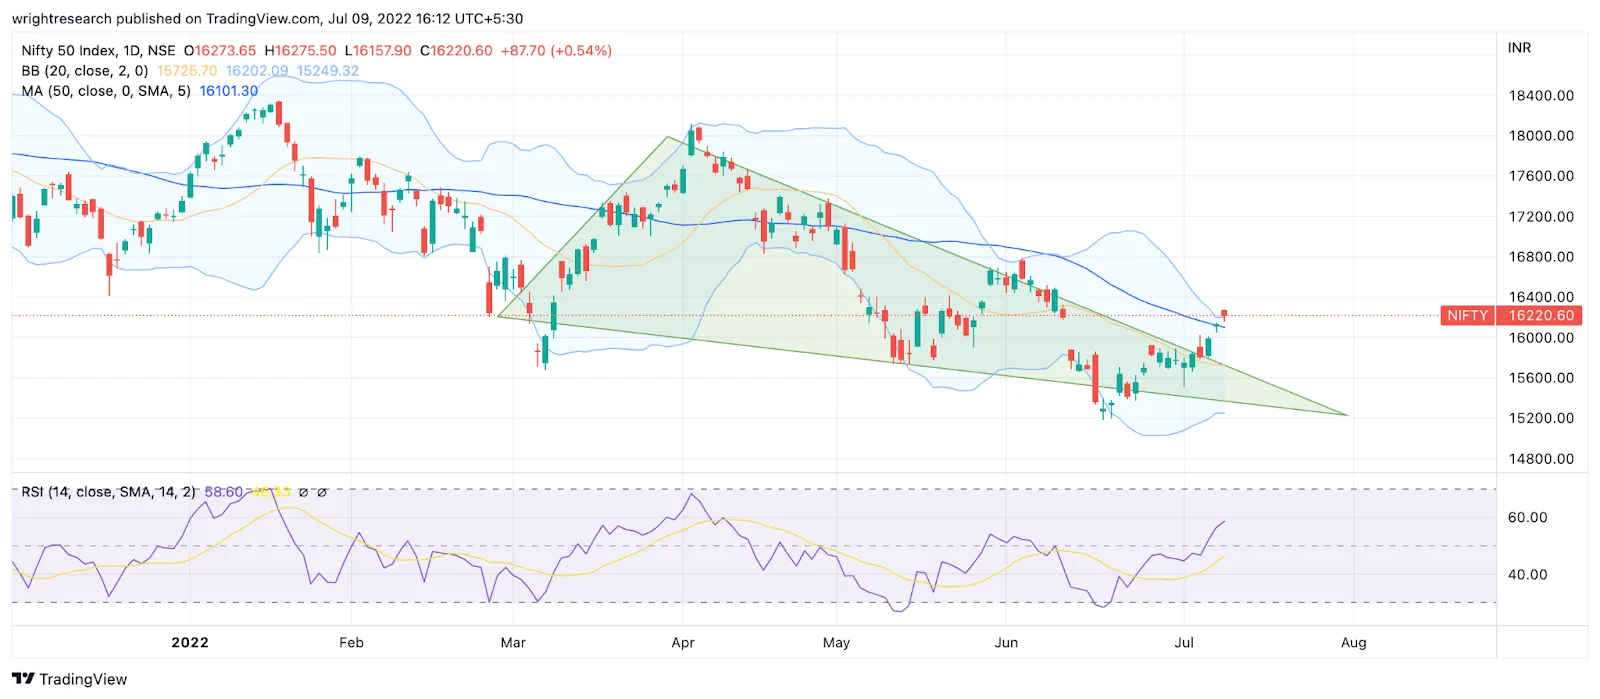
Nifty broke out of a crucial channel last week and has picked up the positive momentum. It has crossed above a 50 moving average and has brought back some hope in the market. However, the movement's strength is vital, as seen by the Relative Strength Indicator.
On the other hand, it crossed the upper Bollinger band and formed somewhat of a hanging man pattern on the daily chart. This could mean a short-term break in the up move.
Next week will be a week of results, and the US inflation data will also come out. This week could be a make-or-break time for the relief rally. We might see a diverse pattern in earnings with autos and consumer staples leading the pack, but cement and pharma are going into the negative territory.
See what markets are pricing in
Live indices, sector moves and market breadth — the backdrop to every story we publish.
USD/INR
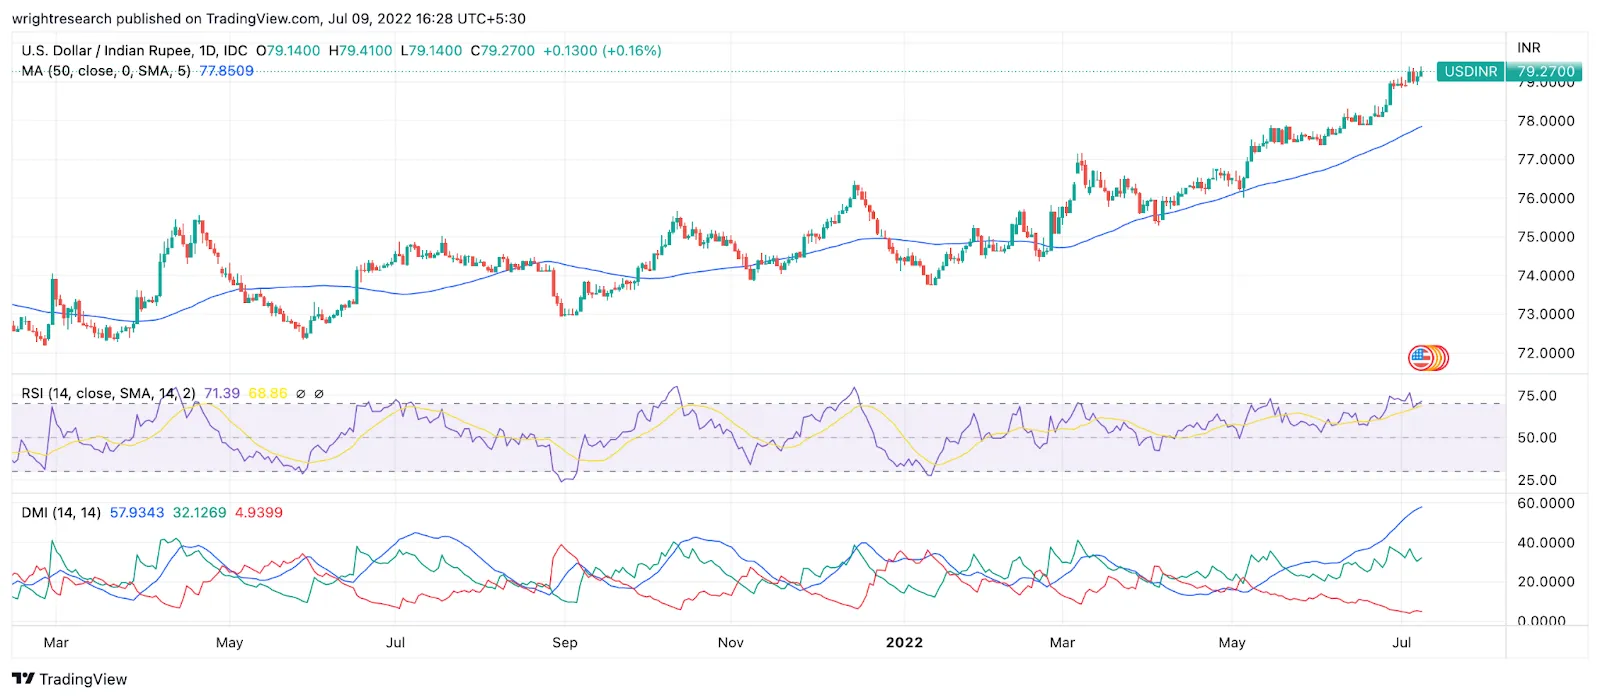
USD/INR has gained powerful upwards momentum, and the directional strength of the move is also solid. Even though Brent crude tumbled over 4% to below US$109/barrel, the fall of the rupee didn’t see any relief.
The US FED gave a hawkish commentary with all members agreeing on a 50bps or 75 bps rate hike. This hawkish commentary and the performance of commodities have increased the possibility of a recession. As a result, investors have moved to the safety of the US dollar.
Crude Oil
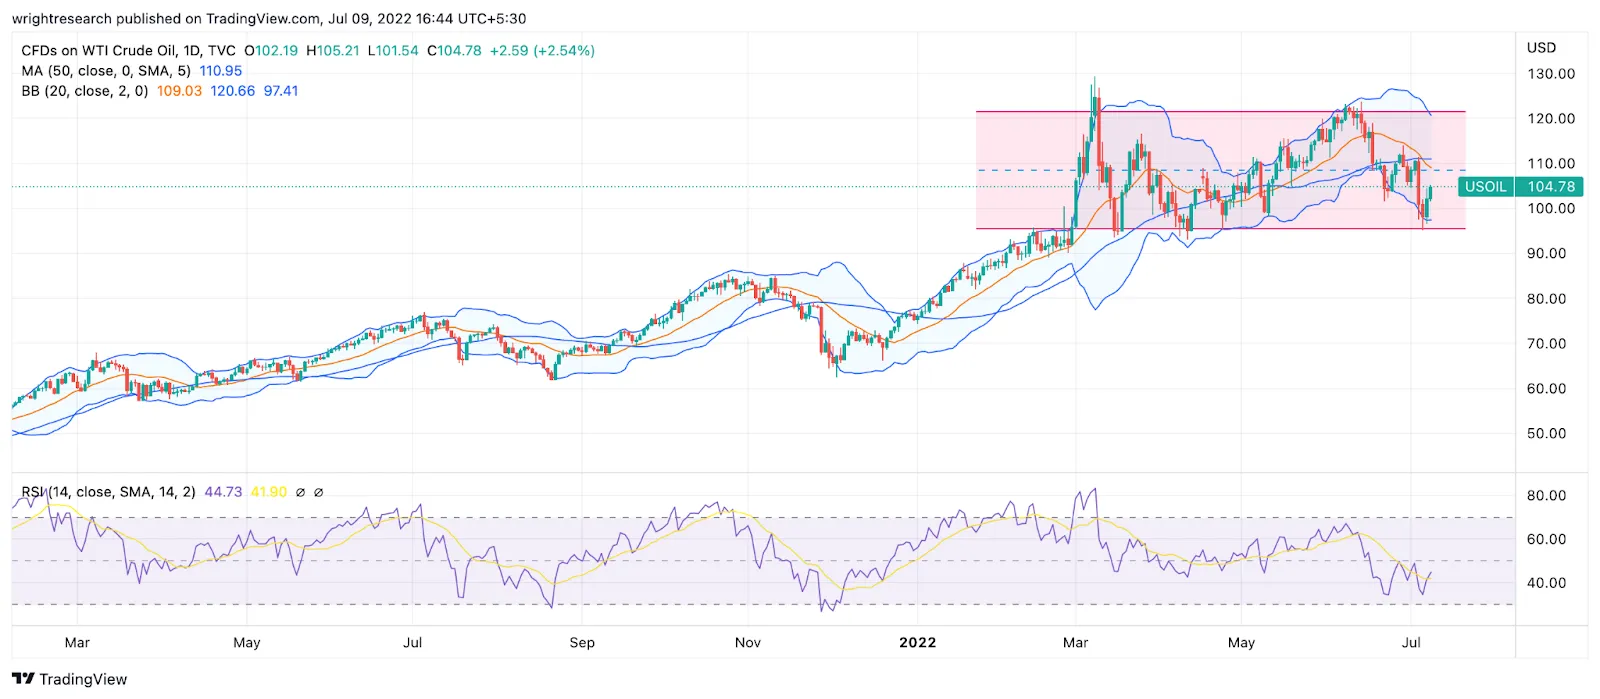
Crude oil corrected drastically in the past 1 month, but in the last couple of sessions, it has rebounded. The Crude Oil has formed a horizontal channel between 95 and 120 and might move in a range-bound fashion.
With the recession fears creeping in and demand to cool off, we could see a cooling off of crude prices soon, bringing relief to the Nifty index and reducing the rupee burden.
Copper
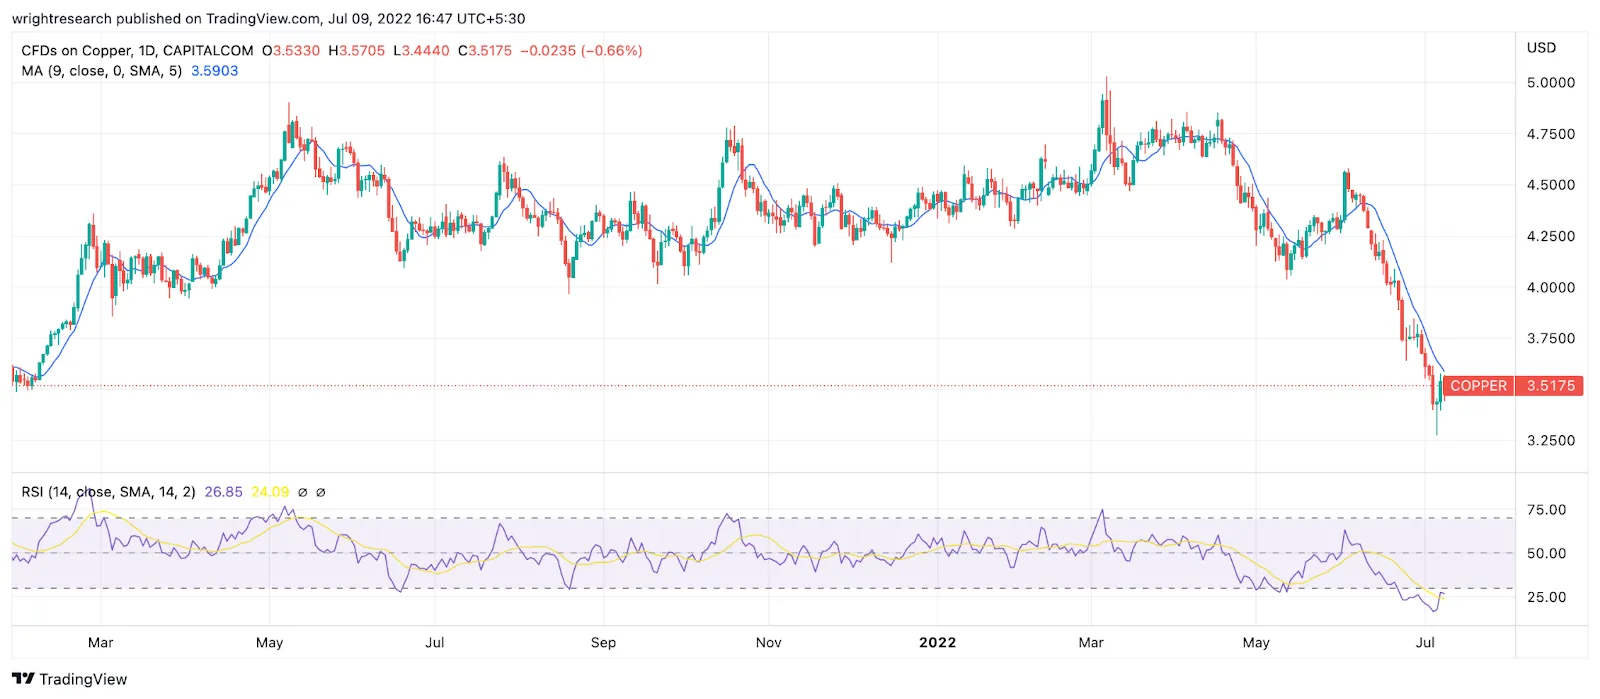
Copper saw a secular downtrend last month. Copper is worth its price in gold as an economic indicator. Many analysts use the ratio of copper prices to gold or the copper price as an indicator of economic activity in the world. Because of copper's widespread applications in most sectors of the economy, demand for copper is a reliable leading indicator of financial health.
The copper prices hitting a 15-month low indicate the slowdown in the economy and fear of recession. This is a clear indication of a downturn in the global economy.
Get research like this in your inbox
The week’s research that mattered, in five minutes. Joined by 1.6L+ investors.
S&P 500
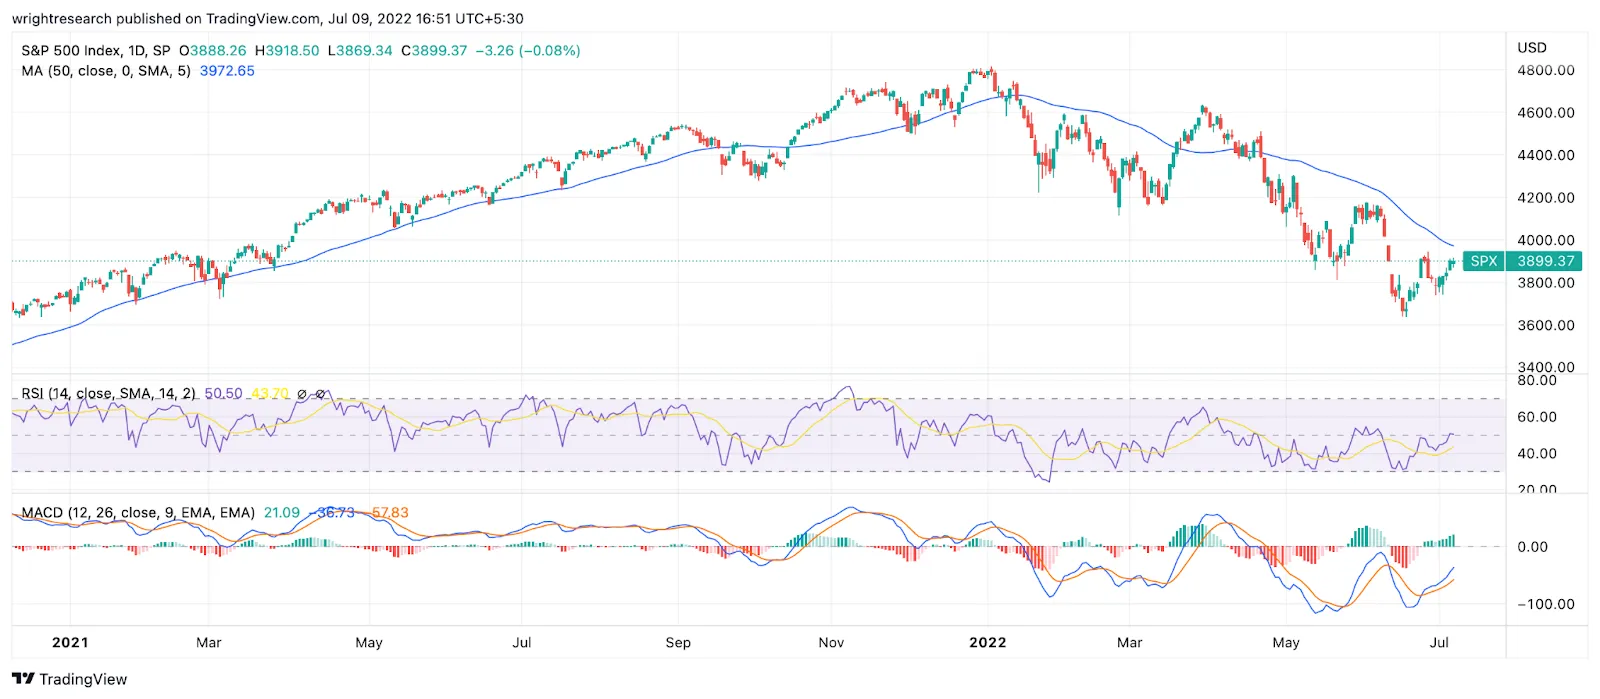
The S&P 500 remains broadly bearish. On Friday, the benchmark index recorded its fifth consecutive higher close as buyers reacted to Federal Reserve remarks suggesting a more tempered interest rate hikes program.
The Fed released minutes from its June policy meeting showing a firm restatement of the central bank’s intent to get prices under control. As a result, an increase of 50 or 75 basis points would likely be appropriate at the policy meeting in July.
A big trigger for the US market would be the Inflation data which would be released next week and set the path for future trends.
China
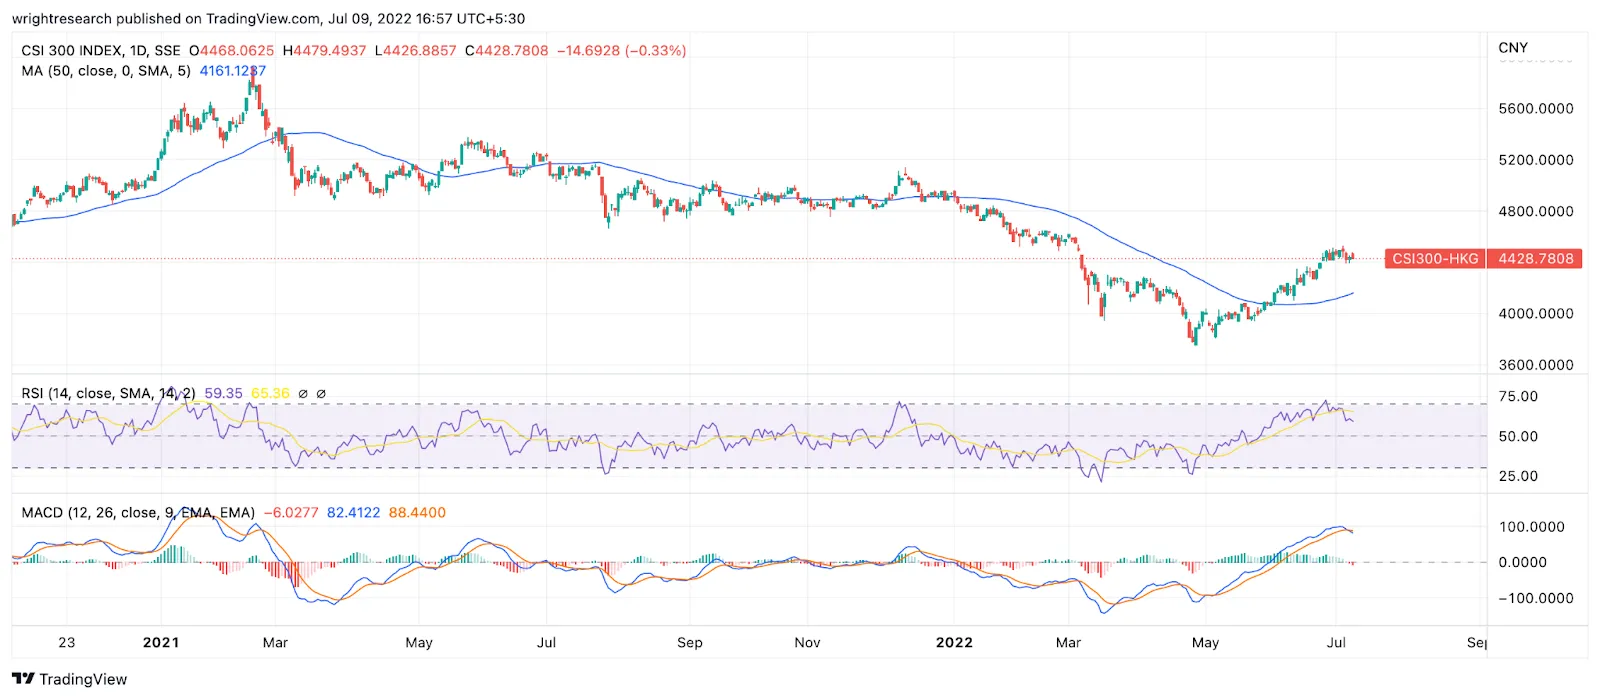
China has shown significant momentum in the last month and has become a pure momentum play. There is a short-term correction happening in China, but the recovery in China markets could set the mood for global revival.
Bottomline
Charts are never the complete answer, and they do fail many times. But charts can give important clues about investor behaviour, and looking at a few charts never hurts anybody.
There are fears in the market of the global recession, but many other clues point to early recovery. The next few weeks and months will be crucial in setting the tone for future turns.
Run the numbers on your next investment
Project returns on a lumpsum or SIP with our free calculators.
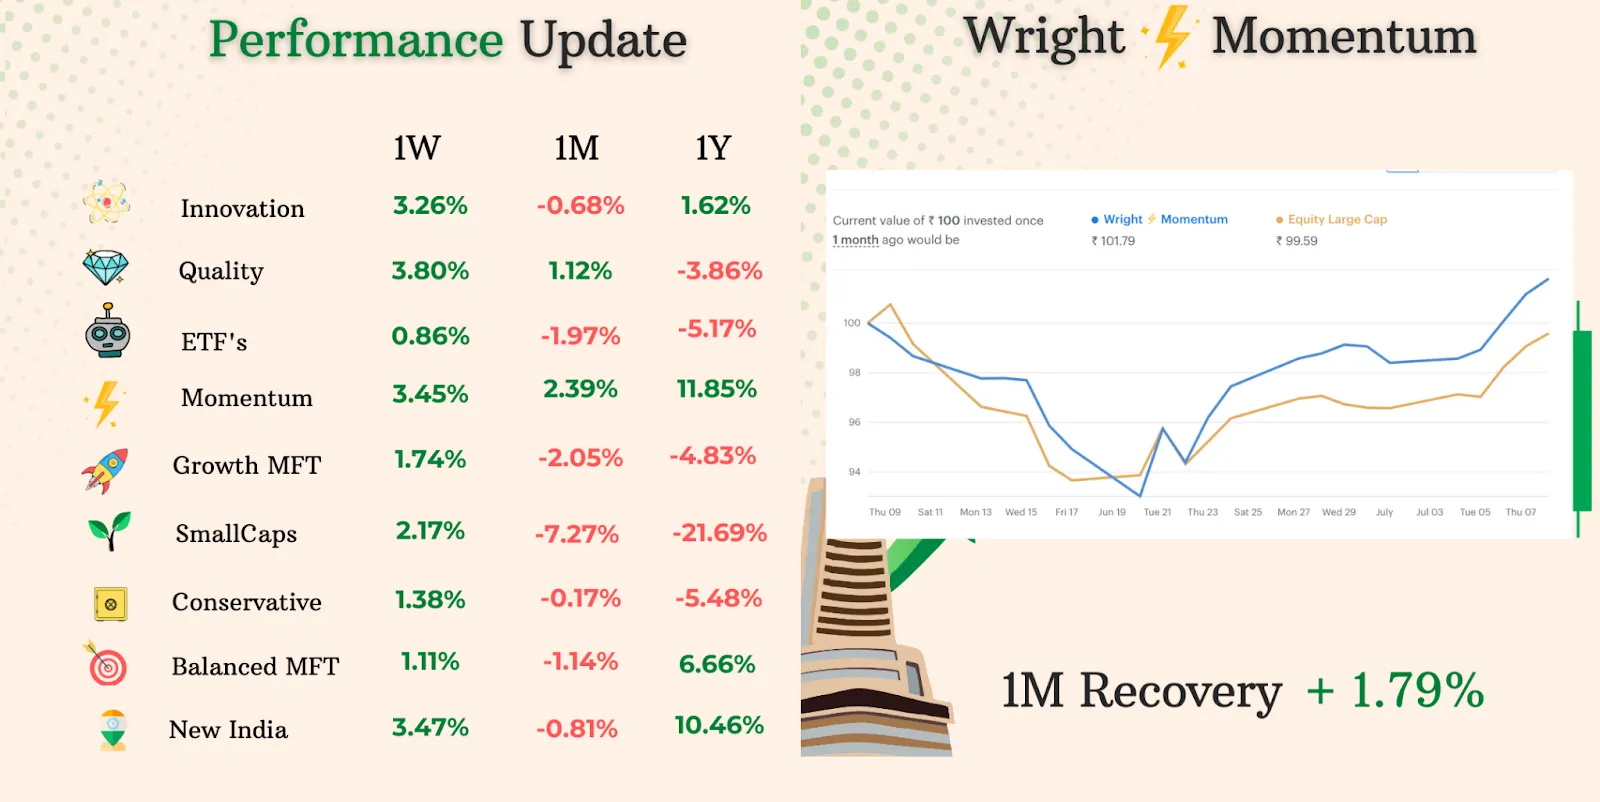
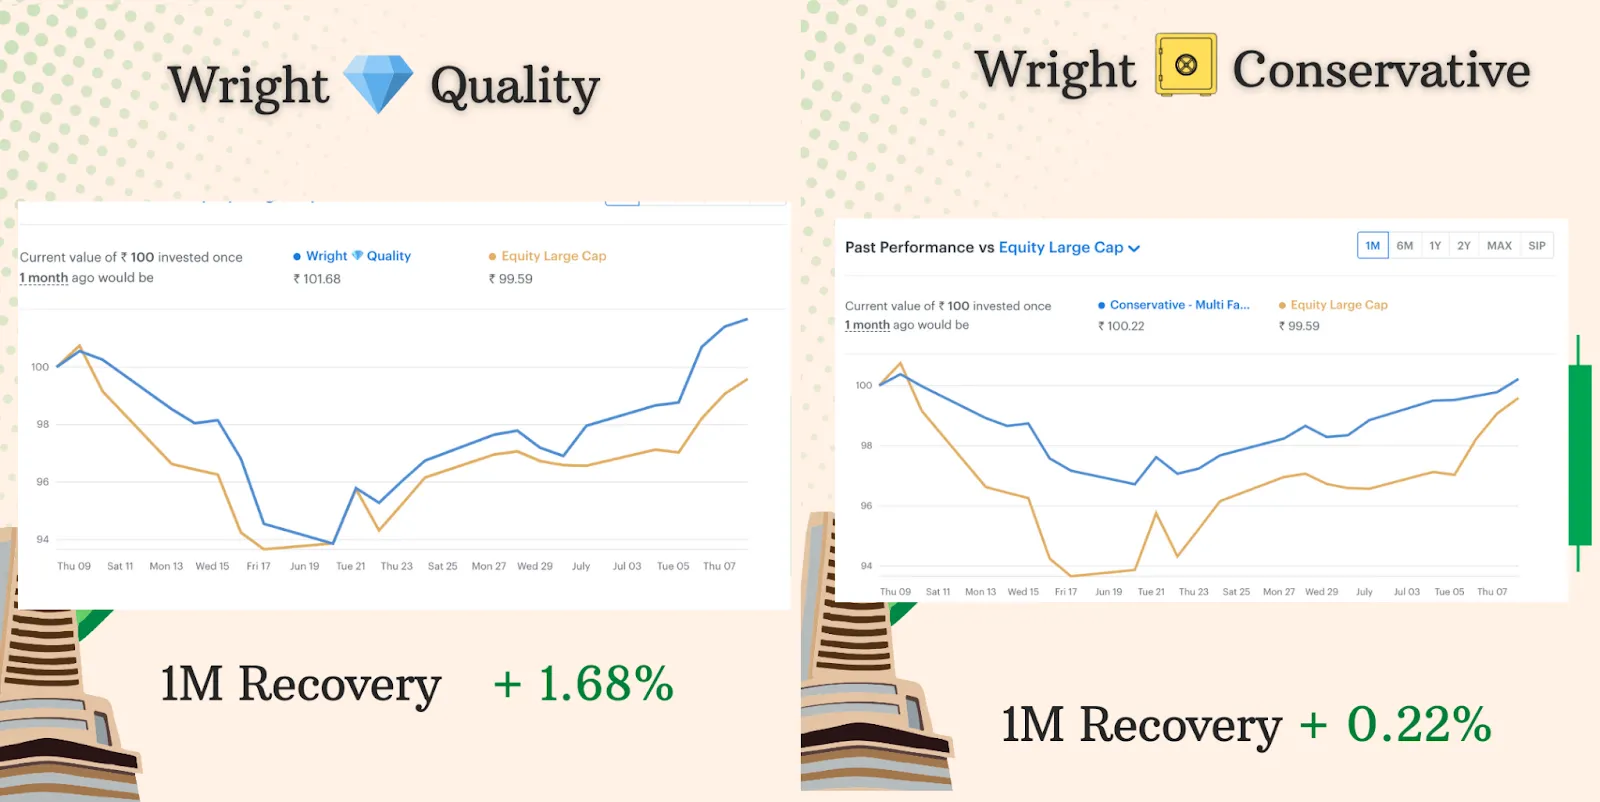
Performance Update
Our portfolios made strong rebounds last week, but we cannot promise the continuance of the recovery. Nevertheless, we are sure of the strength of our risk management and tactical allocation to make the most of the opportunity in the market.