

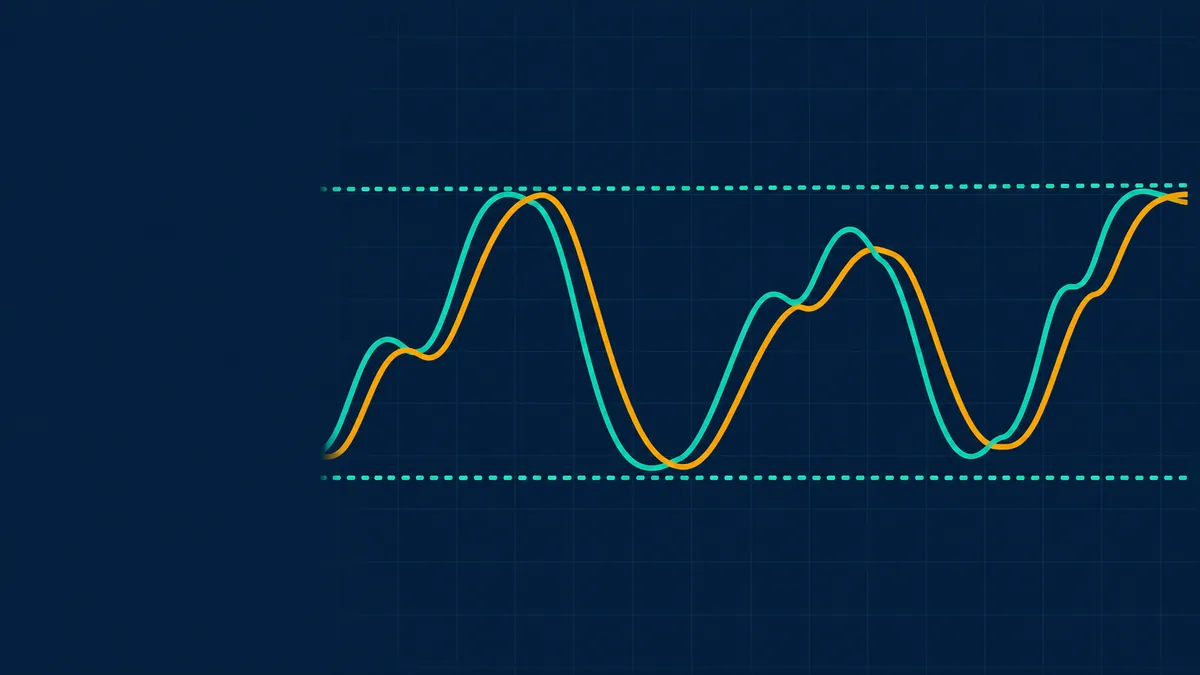
The stochastic oscillator is a momentum indicator that shows where the latest close sits within its recent high-low range. It was developed by George Lane in the 1950s on the idea that in an uptrend prices tend to close near their highs, and in a downtrend near their lows.
The formula
%K = (close - lowest low of last n periods) / (highest high of last n periods - lowest low) x 100. The usual n is 14. %D is a 3-period moving average of %K and acts as a signal line.
See what markets are pricing in
Live indices, sector moves and market breadth — the backdrop to every story we publish.
A worked example
Over the last 14 days the lowest low is 100, the highest high is 110, and today's close is 108. The numbers are illustrative.
| Step | Calculation | Result |
|---|---|---|
| %K | (108 - 100) / (110 - 100) x 100 | 80 |
| %D | Average of the last 3 %K values | for example 75 |
A %K of 80 means the close is in the top fifth of its 14-day range.
Get research like this in your inbox
The week’s research that mattered, in five minutes. Joined by 2L+ investors.
Reading the signals
| Signal | What traders look at |
|---|---|
| Above 80 | Overbought: price near the top of its range |
| Below 20 | Oversold: price near the bottom of its range |
| %K crossing above %D | Momentum turning up |
| %K crossing below %D | Momentum turning down |
| Divergence | Price makes a new high but the oscillator does not |
Like RSI , it can stay above 80 for a long time in a strong trend, so 'overbought' is not a sell instruction.
Fast, slow and full
The fast stochastic uses raw %K and is jumpy. The slow stochastic smooths %K with a 3-period average, which becomes the new %K, and is more commonly used. Williams %R is closely related: it is the same calculation on a 0 to -100 scale.
Limits: it produces many false signals in strong trends, it ignores volume, and the 80 and 20 levels are conventions. Pair it with trend information such as the ADX.
Large caps or small caps: who is winning?
Nifty, midcap and smallcap returns from one day to ten years, with the spread and valuation by segment.
Frequently Asked Questions
What does the stochastic oscillator show?
Where the latest closing price sits within its high-low range over a set period, on a scale of 0 to 100.
What are %K and %D?
%K is the oscillator value itself, and %D is its 3-period moving average, used as a signal line.
What is the difference between stochastic and RSI?
The stochastic compares the close with its recent range, while RSI compares the size of recent gains with losses.
What is the best stochastic setting?
14, 3, 3 is the common default. Other settings can be used, but should not be fitted to past data.
This article is for education only and is not investment advice. Indicator readings describe past price behaviour and do not predict future returns.



