

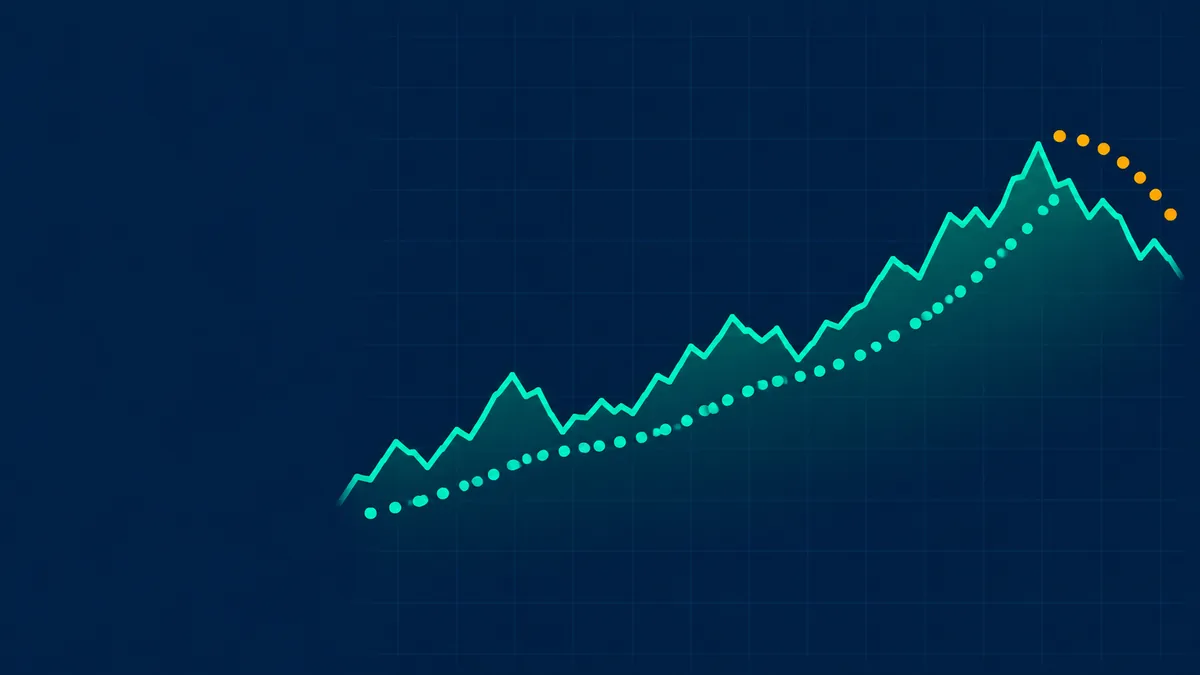
The Parabolic SAR, short for stop and reverse, is a trend indicator that plots a series of dots above or below price. Dots below price mean an uptrend and dots above mean a downtrend. J. Welles Wilder introduced it in 1978, and it is often used to trail a stop.
The formula
Next SAR = SAR + AF x (EP - SAR). EP is the extreme point, the highest high in an uptrend or the lowest low in a downtrend. AF is the acceleration factor, which starts at 0.02 and rises by 0.02 each time a new extreme point is made, up to a maximum of 0.20. The acceleration makes the dots speed up as a trend matures.
See what markets are pricing in
Live indices, sector moves and market breadth — the backdrop to every story we publish.
A worked step
In an uptrend the current SAR is 100, the extreme point is 110 and AF is 0.02. The numbers are illustrative.
| Step | Calculation | Result |
|---|---|---|
| Next SAR | 100 + 0.02 x (110 - 100) | 100.2 |
| If price makes a new high of 112, AF becomes | 0.02 + 0.02 | 0.04 |
| Following SAR (from 100.2) | 100.2 + 0.04 x (112 - 100.2) | 100.67 |
When price falls to touch the SAR, the indicator reverses: the dots move to the other side, the extreme point resets and AF returns to 0.02.
Get research like this in your inbox
The week’s research that mattered, in five minutes. Joined by 2L+ investors.
How it is used
- Trend direction: dots below price means uptrend and above means downtrend.
- Trailing stop: the dot level is used as a stop that tightens over time. See stop-loss order.
- Exit signal: a flip in the dots is read as a possible end to the trend.
Limits
- It is designed for trending markets. In sideways markets it flips repeatedly and each reversal can lose money, known as whipsaw.
- It is always in the market by design, as every flip is also a reversal.
- It is often paired with the ADX to check that a trend exists before relying on it. Compare also the Supertrend , which uses volatility to set its distance.
Large caps or small caps: who is winning?
Nifty, midcap and smallcap returns from one day to ten years, with the spread and valuation by segment.
Frequently Asked Questions
What does Parabolic SAR stand for?
Stop and reverse.
What are the default Parabolic SAR settings?
An acceleration factor starting at 0.02, stepping up by 0.02, with a maximum of 0.20.
Does Parabolic SAR work in sideways markets?
Not well. It tends to flip often and produce false signals when there is no trend.
Is Parabolic SAR a good stop-loss tool?
It provides a trailing level that tightens as the trend matures, but it can be stopped out by normal pullbacks.
This article is for education only and is not investment advice. Indicator readings describe past price behaviour and do not predict future returns.



