

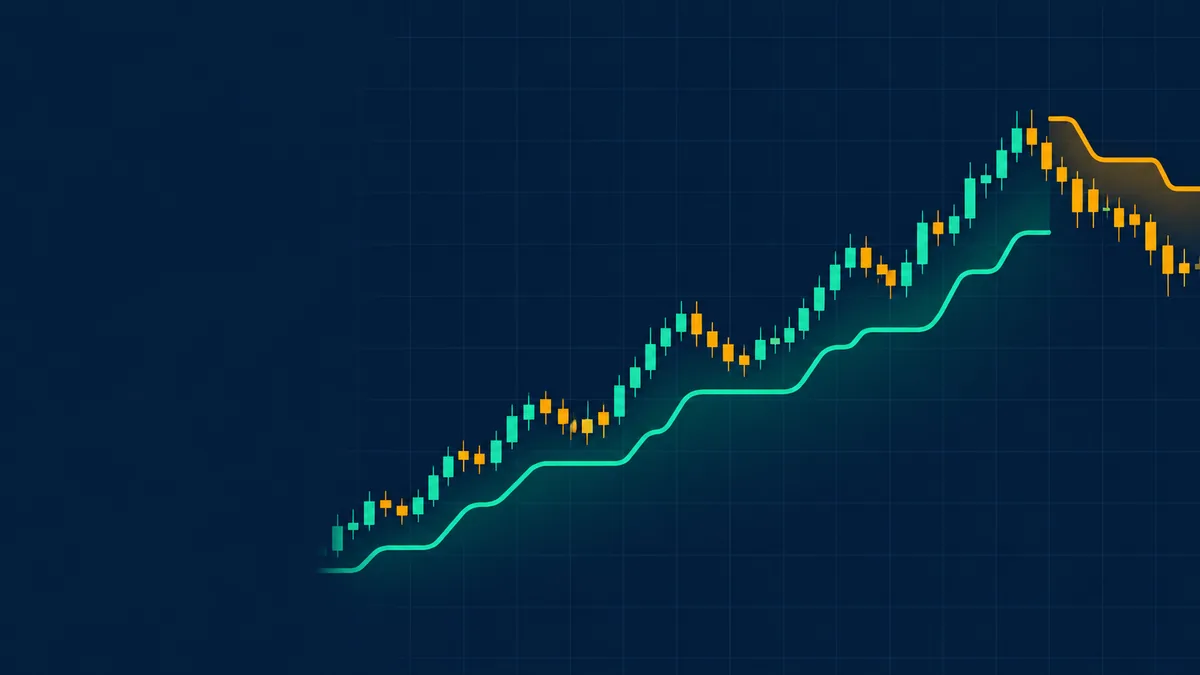
The Supertrend is a trend-following indicator that plots a single line above or below price. The line sits below price in an uptrend and above it in a downtrend, and it flips sides when price closes through it. It is popular for intraday charts in Indian markets because it is easy to read.
How it is calculated
Supertrend uses the Average True Range ( ATR ) to set a distance from the middle of each bar. The common settings are an ATR period of 10 and a multiplier of 3.
- Basic upper band = (high + low) / 2 + multiplier x ATR
- Basic lower band = (high + low) / 2 - multiplier x ATR
The final bands only move in the direction of the trend: in an uptrend the lower band can rise but not fall, which makes it a trailing line. When the close crosses the active band, the indicator flips to the other side.
See what markets are pricing in
Live indices, sector moves and market breadth — the backdrop to every story we publish.
A worked example
A bar has a high of 105 and a low of 99, so the midpoint is 102. ATR is 2. The numbers are illustrative.
| Item | Calculation | Value |
|---|---|---|
| Basic upper band | 102 + 3 x 2 | 108 |
| Basic lower band | 102 - 3 x 2 | 96 |
If the trend is up, the Supertrend line is at 96 and trails upward as prices rise. If a later close falls below the line, the indicator turns to a downtrend and the line moves to the upper band.
Get research like this in your inbox
The week’s research that mattered, in five minutes. Joined by 2L+ investors.
How traders use it
- Trend direction: line below price means uptrend, above price means downtrend.
- Trailing stop: the line is often used as a trailing reference level. See stop-loss order.
- Filter: some traders only consider trades in the direction of the Supertrend, often combined with RSI or VWAP for intraday charts.
Limits
- Whipsaws: in sideways markets the line flips repeatedly and each flip can mean a small loss.
- Lag: the signal arrives after the move has started.
- Settings: a smaller multiplier reacts faster but flips more often. A larger one is steadier but slower.
- Costs: frequent signals mean more trades, and costs add up. See transaction costs.
Large caps or small caps: who is winning?
Nifty, midcap and smallcap returns from one day to ten years, with the spread and valuation by segment.
Frequently Asked Questions
What is the Supertrend indicator?
It is a trend-following indicator that plots a line below price in an uptrend and above it in a downtrend, based on ATR.
What are the default Supertrend settings?
An ATR period of 10 and a multiplier of 3 are the common defaults.
Does Supertrend work in sideways markets?
Not well. It tends to flip often in range-bound conditions, producing false signals.
Is Supertrend a leading or lagging indicator?
It is lagging. It confirms a trend after prices have already moved.
This article is for education only and is not investment advice. Indicator readings describe past price behaviour and do not predict future returns.



