

India VIX summarises the options market's expectation of near-term volatility in the Nifty 50. It is quoted as an annualised percentage and looks forward over the next 30 calendar days. A higher reading signals larger expected movement, not necessarily a market fall; a lower reading signals calmer expectations, not guaranteed safety.
This guide explains what is VIX, how NSE calculates it and how investors can use it without treating a single number as a trading signal.
What Is India VIX?
The India VIX index is an implied-volatility index calculated by NSE from the best bid and ask quotes of Nifty option contracts. “Implied” means the volatility estimate is extracted from current option prices rather than calculated only from past index returns.
If the index reads 20, the market is pricing an annualised volatility of roughly 20% over a constant 30-day horizon. It does not predict that the Nifty will move exactly 20% or specify direction. A rough one-standard-deviation 30-day move can be estimated as:
Expected 30-day move ≈ VIX × √(30/365)
At 20, this is about 5.7% in either direction as a statistical approximation, not a forecast boundary. Traders sometimes call it Nifty VIX, but NSE's official name is India VIX.
What’s the market feeling today?
Our India Fear & Greed index tracks sentiment so you don’t trade on headlines.
How Is India VIX Calculated?
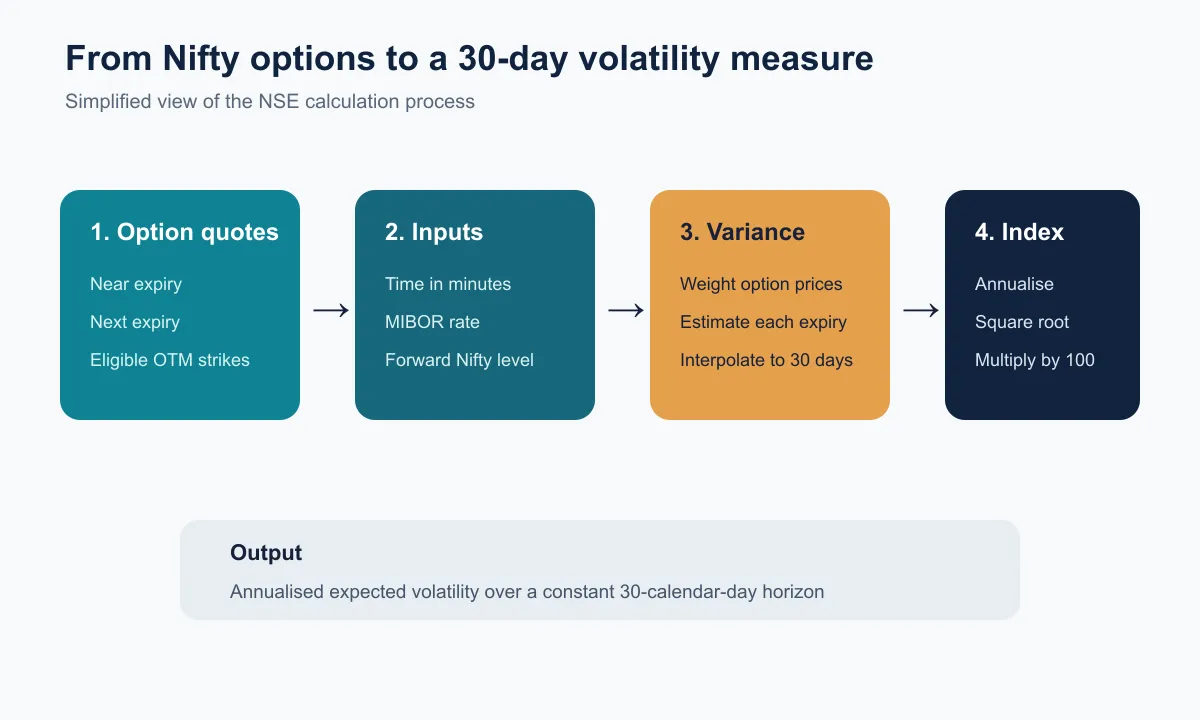
NSE uses a methodology based on Cboe's framework, adapted to the Nifty options order book. It uses out-of-the-money near- and next-month Nifty options, interpolating their implied variances to maintain a 30-calendar-day maturity.
Key inputs are:
- Best bid and ask quotes for eligible Nifty calls and puts.
- Time to expiry measured in minutes for precision.
- The relevant NSE MIBOR rate as the risk-free rate.
- A forward Nifty level used to identify the at-the-money strike.
- Strike spacing and option-price contributions across the selected range.
NSE first estimates variance for the two eligible expiries, then interpolates to 30 days and annualises the result. In simplified form:
India VIX = 100 × √(annualised 30-day implied variance)
The official formula is more detailed because it weights option prices across strikes and maturities. The index is model-free in the sense that it does not depend on one Black-Scholes implied-volatility estimate.
Factors That Influence India VIX
Option demand and supply are the immediate drivers. When investors urgently buy protection, put premiums can rise and lift implied volatility. Call demand, dealer hedging and liquidity conditions can also change the reading.
Common catalysts include elections, budgets, central-bank decisions, earnings clusters, geopolitical shocks, currency stress and abrupt global-market moves. Time matters: uncertainty may rise before a known event and fall after the outcome, even if the news itself appears important.
The India VIX index can also move because the shape of the options surface changes. A single headline is not required. Thin quotes, wider spreads or unusual positioning may affect inputs, especially during stressed markets.
How to Interpret India VIX Levels
There is no permanent “good” or “bad” threshold. The appropriate India VIX range depends on the market regime, interest rates, event calendar and recent realised volatility. Compare the current reading with its own history rather than using a universal label.
| Illustrative reading | Market interpretation | Investor response |
|---|---|---|
| Relatively low versus recent history | Options imply smaller near-term movement | Do not assume risk has disappeared; review complacency and position size |
| Near the historical middle | Uncertainty is closer to the recent norm | Maintain planned allocation and ordinary risk controls |
| Elevated | Options price larger potential movement | Check leverage, liquidity and event exposure |
| Extreme spike | Stress and protection demand are unusually high | Avoid impulsive decisions; rebalance only through a pre-defined process |
The direction and speed of change can matter more than the absolute level. A jump from 12 to 18 is a 50% increase in the index, even though 18 may not look extreme in a long history.
Get research like this in your inbox
The week’s research that mattered, in five minutes. Joined by 2L+ investors.
India VIX and Nifty: What the Relationship Means
Volatility and equity returns often move inversely during stress because falling markets trigger demand for protection. The relationship is strong at times but not mechanical. The Nifty can rise while implied volatility rises if traders expect a large event, and it can fall gently while volatility remains subdued.
The index measures expected magnitude, not bearishness. A large upside gap is also volatility. The better use is to compare implied movement with portfolio exposure and recent realised movement.
For historical context, Wright Research's analysis of Indian stock-market corrections shows why drawdowns should be evaluated across regimes rather than through one indicator.
How Investors Can Use India VIX to Assess Portfolio Risk
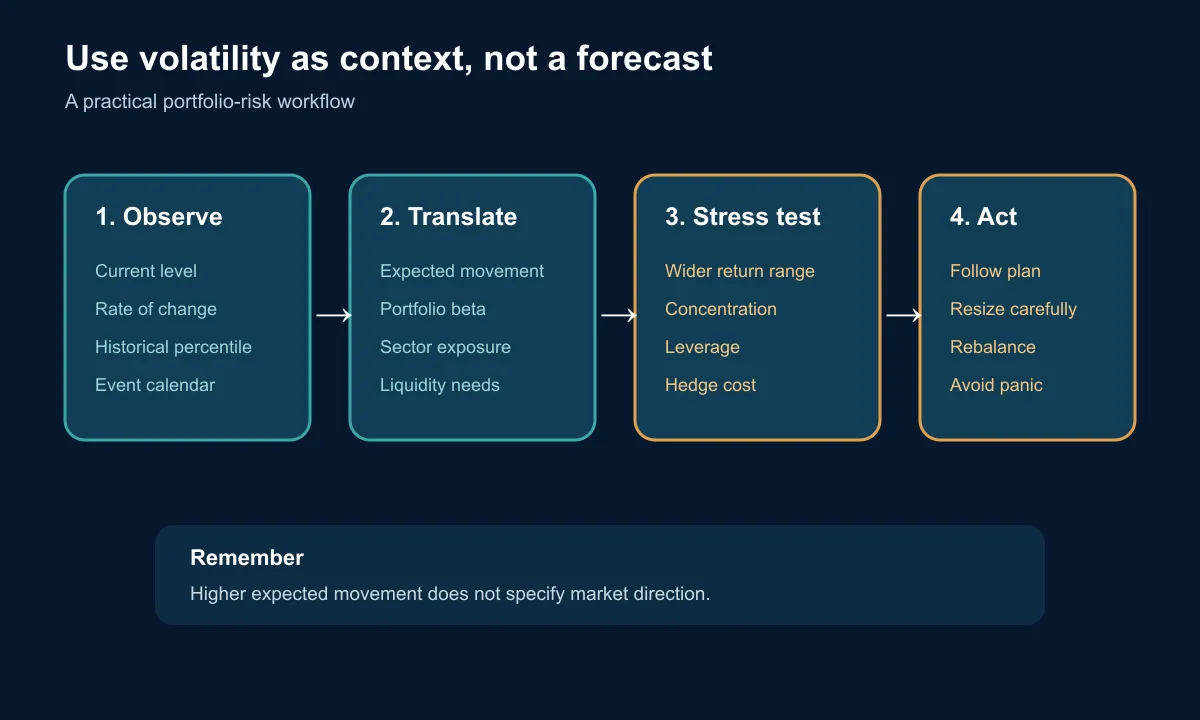
Long-term investors can use it as a temperature gauge. A rapid rise can prompt checks on leverage, emergency liquidity, concentrated positions and the ability to tolerate a drawdown. It should not automatically trigger selling.
Practical uses include:
- Scaling position sizes so expected movement does not exceed the risk budget.
- Stress-testing the portfolio using a wider return range when implied volatility rises.
- Comparing option premiums with recent realised volatility before considering hedges.
- Reviewing whether panic or complacency is affecting behaviour.
- Pairing volatility with breadth, valuations and macro indicators.
Use Wright Research's fear and greed index and market dashboards for broader context. No indicator should replace asset allocation or a written risk plan.
India VIX vs CBOE VIX
Both indices use option prices to estimate constant 30-day implied volatility, and NSE adapted the Cboe methodology to Indian market conditions. Their underlying markets differ.
| Feature | India measure | Cboe measure |
|---|---|---|
| Underlying options | Nifty 50 options | S&P 500 options |
| Market represented | Indian large-cap equities | US large-cap equities |
| Currency and rates | Indian market inputs | US market inputs |
| Interpretation | Expected 30-day annualised volatility | Expected 30-day annualised volatility |
The levels should not be compared without context because option liquidity, event risk and market structure differ. A reading of 20 can represent a different percentile in India than in the United States.
Limitations of India VIX
It is not a direction forecast, price target or guarantee. It reflects options-market pricing, including risk premia, so implied volatility often differs from the volatility eventually realised.
The India VIX share price phrase is misleading because the measure is an index, not an equity share with earnings or intrinsic value. Investors cannot buy the spot index. India VIX futures are leveraged derivatives with contract specifications, expiry, margin and basis risk; availability and liquidity should be verified on NSE and with the broker before trading.
The index focuses on Nifty options, so it may not represent the risk of a small-cap, sector or concentrated portfolio. It can remain low before an unforeseen shock and can stay elevated after an event if uncertainty persists.
Know your risk profile in 2 minutes
A short quiz that maps how much drawdown you can actually live with.
FAQ
Can investors trade India VIX directly?
The spot index itself is not directly investable. NSE has offered volatility futures, but investors must verify currently available contracts, liquidity, lot size, margin and broker access. Futures are leveraged and can diverge from the spot level.
What is the difference between India VIX and realised volatility?
Implied volatility is the options market's forward-looking pricing of movement. Realised volatility is calculated from actual past returns. The difference between them can reflect risk premium, demand for protection and forecasting error.
Why can India VIX rise even when the Nifty moves sideways?
Options can price a larger future move ahead of an event even when the index has not yet changed. Increased protection demand, wider quotes or a steeper volatility surface can also raise the measure.
How frequently is India VIX updated during market hours?
It is calculated and disseminated during the trading session as eligible Nifty option quotes change. Data vendors and websites may display it at different refresh intervals.
Can India VIX remain low before a sudden market fall?
Yes. It reflects information and option prices available at that moment. An unexpected event can arrive after a calm reading, which is why low implied volatility is not insurance against losses.
Understanding what is VIX helps investors use it for risk context rather than prediction. Combine implied volatility with portfolio construction, liquidity and scenario analysis before changing an allocation.
For education only, not investment advice. Derivative specifications and availability can change. Consult a SEBI-registered investment adviser where appropriate.