
Blog home
Newsletter
News
Video
Podcast
Reading list
Wright Brief
Sign In

Pivot Points: Meaning, Formula and How to Use Them

Pivot points use the previous day's high, low and close to mark support and resistance levels. Formula, a worked example with R1, R2, S1, S2, and limits.

Listen to this article
Audio · ~3 min
Add as a preferred source on Google
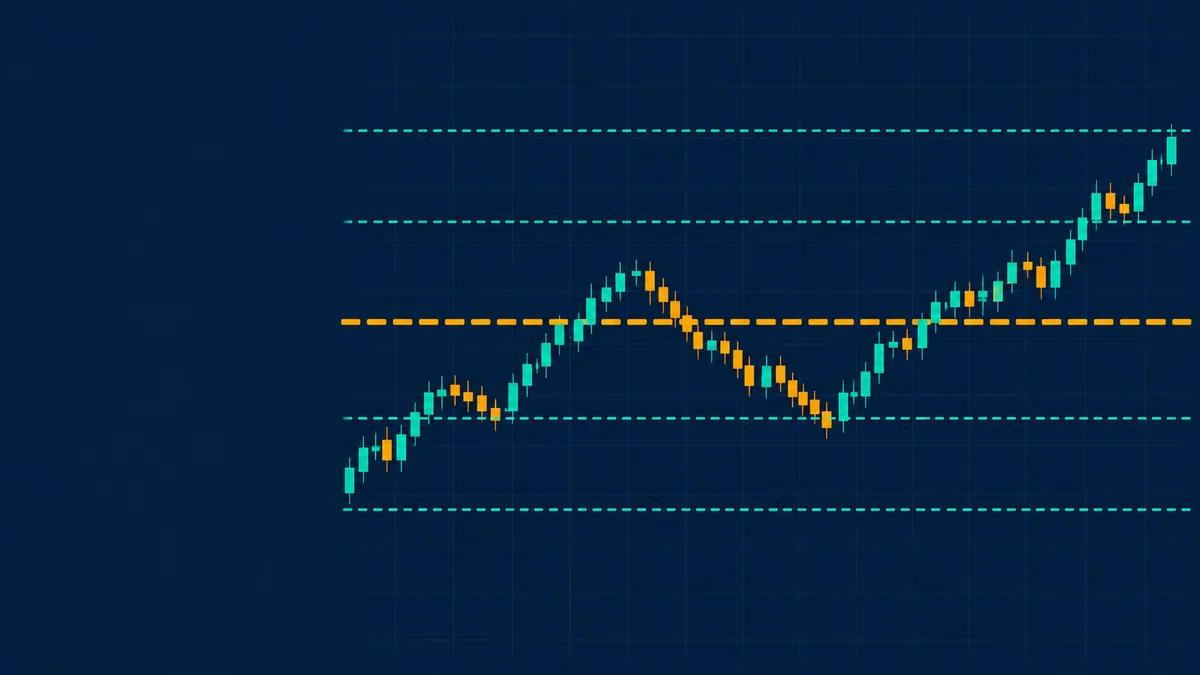
Pivot points illustration: candlesticks moving between horizontal support and resistance levels

Pivot points are price levels calculated from the previous period's high, low and close that traders use as possible support and resistance for the next period. They are especially common among intraday traders, since the levels are fixed before the market opens.

The classic formulas

  • Pivot (P) = (high + low + close) / 3
  • Resistance 1 (R1) = 2 x P - low
  • Support 1 (S1) = 2 x P - high
  • Resistance 2 (R2) = P + (high - low)
  • Support 2 (S2) = P - (high - low)
Free tool

See what markets are pricing in

Live indices, sector moves and market breadth — the backdrop to every story we publish.

Open Market Tracker

A worked example

Yesterday's high was 105, low 95 and close 102. The numbers are illustrative.

LevelCalculationValue
Pivot (P)(105 + 95 + 102) / 3100.67
R12 x 100.67 - 95106.33
S12 x 100.67 - 10596.33
R2100.67 + (105 - 95)110.67
S2100.67 - (105 - 95)90.67
The Wright Brief · free weekly

Get research like this in your inbox

The week’s research that mattered, in five minutes. Joined by 2L+ investors.

How traders use them

  • Bias: trading above the pivot is read as bullish for the session, below as bearish.
  • Levels to watch: R1, R2, S1 and S2 are used as possible reaction points, profit targets or stop references.
  • Confluence: a pivot level that matches another level, such as a Fibonacci level or a moving average , is seen as stronger.

Other variants include Fibonacci pivots, Woodie's and Camarilla pivots, which use different formulas. The Central Pivot Range (CPR) is built from the pivot plus two related levels.

Limits

  • The levels are mechanical. They come from yesterday's prices, not from any buying or selling that took place.
  • Price often moves through them with no reaction.
  • They work best in range-bound markets and give less help in strong trends or after large gaps.
  • Many traders watch the same levels, which can make them work, but also makes them easy to be caught out around.
Free data

Large caps or small caps: who is winning?

Nifty, midcap and smallcap returns from one day to ten years, with the spread and valuation by segment.

Compare market caps

Frequently Asked Questions

What are pivot points?

They are levels calculated from the previous period's high, low and close, used as possible support and resistance.

What is the pivot point formula?

Pivot = (high + low + close) / 3. Support and resistance levels are calculated from it.

Are pivot points good for intraday trading?

They are popular for intraday use because they are fixed before the session, but they give no guarantee of reactions.

What is the difference between pivot points and CPR?

CPR uses the pivot together with two other levels (top and bottom central pivots) to form a range, instead of a single line.

This article is for education only and is not investment advice. Indicator readings describe past price behaviour and do not predict future returns.

Disclaimer: Investment in securities market are subject to market risks. Read all the related documents carefully before investing. Registration granted by SEBI, membership of a SEBI recognized supervisory body (if any) and certification from NISM in no way guarantee performance of the intermediary or provide any assurance of returns to investors.

The content in these posts/articles is for informational and educational purposes only and should not be construed as professional financial advice and nor to be construed as an offer to buy/sell or the solicitation of an offer to buy/sell any security or financial products. Users must make their own investment decisions based on their specific investment objective and financial position and using such independent advisors as they believe necessary.

Wryght Research & Capital Pvt (Brand name: Wright Research) is a SEBI Registered Portfolio Manager Reg No: INP000007979 (Validity: Apr 03, 2023 – Perpetual) and a SEBI Registered Research Analyst No: INH000017295 (Validity: Jul 03, 2024 – Perpetual), with its registered office at 103, Shagun Vatika Prag Narayan Road, Lucknow, UP, 226001 India and CIN: U67100UP2019PTC123244. Past performance may or may not be sustained in future. Performance provided there in is not verified by SEBI. Investment in securities is subject to market and other risks, and there is no assurance or guarantee that the objectives of any of the strategies of the Portfolio Management Services will be achieved. Registration granted by SEBI, enlistment as RA with Exchange and certification from National Institute of Securities Markets (NISM) in no way guarantee performance of the intermediary or provide any assurance of returns to investors. Please read the Disclosure document carefully before investing. Securities quoted are for illustration only and are not recommendatory. Charts shown are for illustration only. For more information and disclosures, visit our disclosures page here.

Found this useful? Share it.
Explore related topics
Siddharth Singh Bhaisora
About the author
Siddharth Singh Bhaisora
Chief Marketing & Growth Officer | Wright Research, Wright Research

Chief Marketing & Growth Officer

Wright PMS · Portfolio Management Service

Put this research to work

The same 300+ factor research engine behind this article — applied to a professionally managed portfolio, end to end.

300+
Factors tracked
2L+
Investors
₹1,200+ Cr
Invested
SEBI
Registered PMS
