

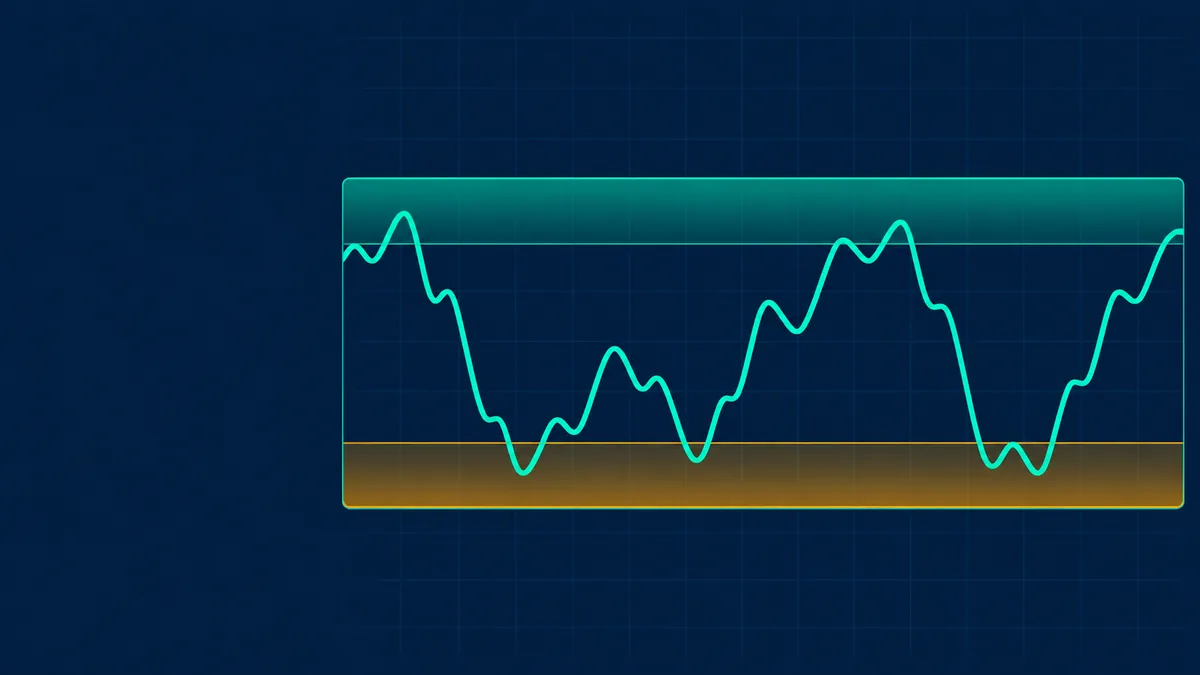
Williams %R is a momentum oscillator that shows where the latest close sits relative to the highest high of a recent period. It moves between 0 and -100. Larry Williams developed it in the 1970s, and it is the mirror image of the fast stochastic oscillator.
The formula
%R = (highest high of last n periods - close) / (highest high - lowest low) x -100. The usual n is 14.
See what markets are pricing in
Live indices, sector moves and market breadth — the backdrop to every story we publish.
A worked example
Over 14 days the highest high is 110, the lowest low is 100, and today's close is 108. The numbers are illustrative.
| Step | Calculation | Result |
|---|---|---|
| %R | (110 - 108) / (110 - 100) x -100 | -20 |
| Fast stochastic %K for the same data | (108 - 100) / (110 - 100) x 100 | 80 |
%R is always the stochastic %K minus 100, so the two give the same information on different scales.
Get research like this in your inbox
The week’s research that mattered, in five minutes. Joined by 2L+ investors.
Reading the levels
| Reading | Common interpretation |
|---|---|
| Between 0 and -20 | Overbought: close near the top of the range |
| Between -80 and -100 | Oversold: close near the bottom of the range |
Traders also watch for the oscillator leaving these zones, divergences with price, and a cross of the -50 midline as a momentum shift.
Limits
- Like other overbought and oversold tools, it can remain in an extreme zone for a long time in strong trends.
- It is a fast oscillator, so it is jumpy and gives many false signals on short periods.
- It is usually combined with trend or volume information, such as RSI , moving averages or the stochastic oscillator.
Large caps or small caps: who is winning?
Nifty, midcap and smallcap returns from one day to ten years, with the spread and valuation by segment.
Frequently Asked Questions
What is Williams %R?
It is a momentum oscillator, scaled from 0 to -100, that shows where the close sits within its recent high-low range.
What is the difference between Williams %R and the stochastic oscillator?
They use the same calculation. %R is scaled from 0 to -100, and the fast stochastic from 0 to 100, so %R equals %K minus 100.
What are overbought and oversold levels for Williams %R?
Readings above -20 are called overbought and below -80 oversold. They describe recent price position, not a guaranteed reversal.
What period does Williams %R use?
14 periods is the common default.
This article is for education only and is not investment advice. Indicator readings describe past price behaviour and do not predict future returns.



