




The Golden Cross when the 50-day moving average rises above the 200-day moving average is one of the most celebrated bullish signals in technical analysis. For Indian market participants navigating the Nifty, Bank Nifty, or leading stocks such as Reliance Industries, TCS, and HDFC Bank, understanding this pattern can help capture sustained uptrends while managing risk.
What Exactly Is a Golden Cross?
A Golden Cross is a bullish crossover of two trend-following indicators: the short-term 50-day simple moving average (SMA) and the long-term 200-day SMA. When the 50-day SMA crosses above the 200-day SMA, it signals that recent buying pressure has overcome longer-term selling pressure, marking a potential shift to a sustained uptrend.
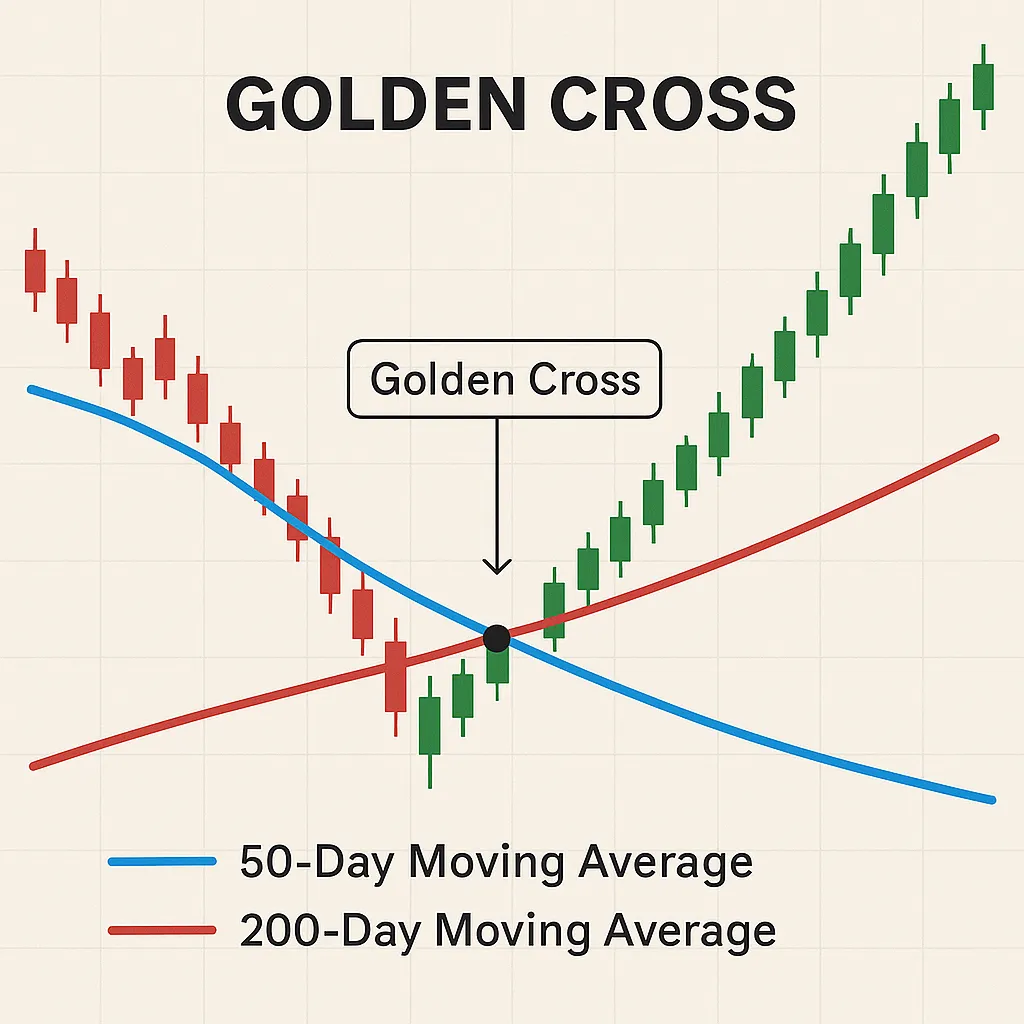
Three Phases of a Golden Cross
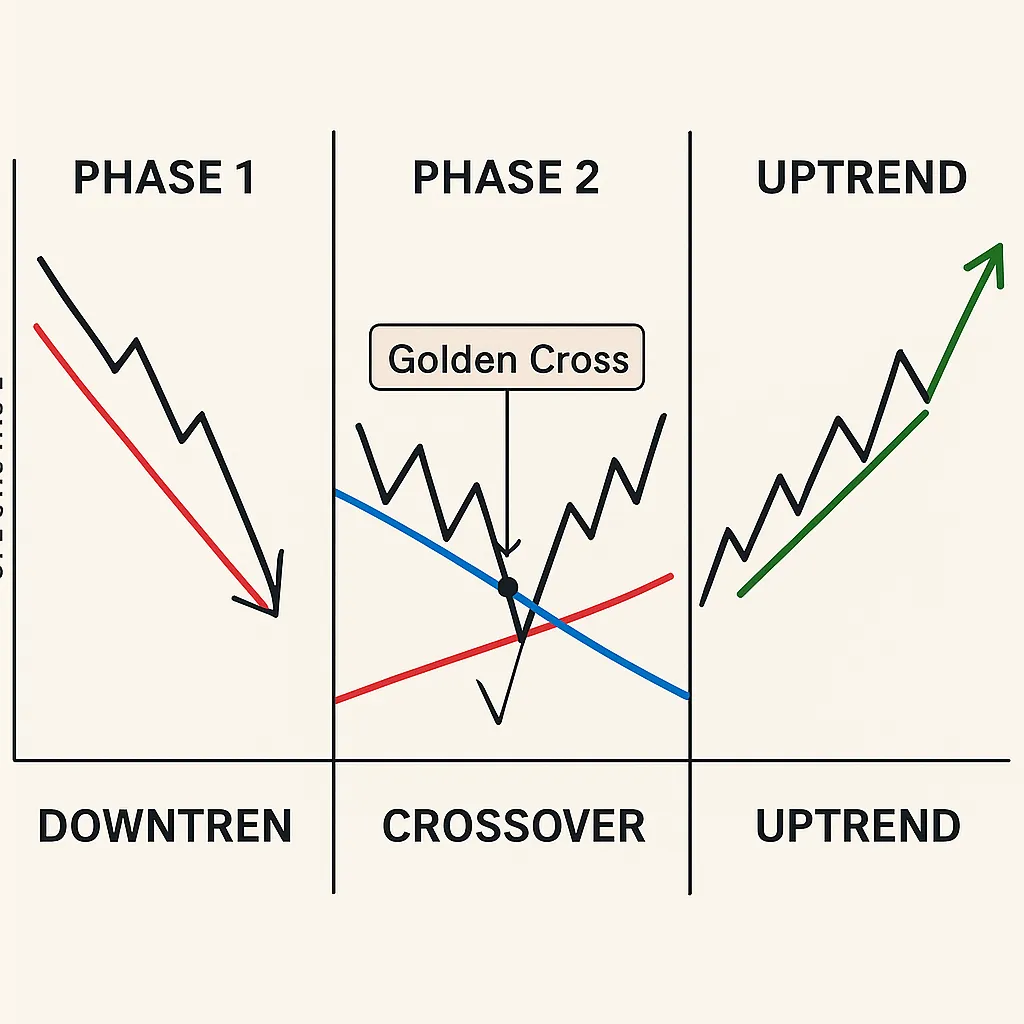
Every robust Golden Cross unfolds in three recognizable stages. First comes downtrend exhaustion, where selling pressure eases and value-oriented buyers quietly accumulate. Next is the crossover event itself, a decisive intersection that flips market psychology. Finally, an uptrend develops as both moving averages slope higher and dips find support at these dynamic lines.
Every high-quality Golden Cross unfolds in three phases:
Downtrend Exhaustion: Selling pressure eases, and value-focused buyers begin accumulating.
Crossover Event: The 50-day SMA decisively crosses above the 200-day SMA, flipping market psychology.
Bullish Continuation: Both SMAs slope upward, and subsequent dips typically find support at these moving averages.
Why Golden Crosses Matter in Indian Markets ?
Indian equities exhibit unique seasonality and event-driven swings : Union Budgets, RBI policy meetings, monsoon forecasts, and election cycles all of which feed into sentiment shifts captured by moving averages. When a Golden Cross appears after such catalysts, the subsequent rallies can be dramatic. Domestic mutual funds, foreign institutional investors, and a large pool of retail traders often view the signal as a green light for fresh allocation, increasing its reliability.
.blogActionDiv { background-color: #000; display: flex; flex-direction: row; align-items: center; justify-content: space-between; padding: 2rem; border-radius: 8px; font-family: manrope; } .blogActionText { color: #FAA8F1 ; font-size: 1.3rem; font-weight: bold; } .blogActionLink { background-color: #FAA8F1 ; padding: 5px 15px; width: 40%; color: #000; font-weight: bold; font-size: .9rem; text-align: center; margin-left: 10px; border-radius: 5px; } @media (max-width: 800px) { .blogActionDiv { flex-direction: column; align-items: center; justify-content: center; padding: 2rem; border-radius: 8px; } .blogActionText { font-size: 1.1rem; font-weight: bold; text-align: center; } .blogActionLink { width: auto; font-weight: bold; margin-left: 0px; margin-top: 10px; } }Historical Glimpses of Outperformance
Consider the Nifty’s crossover in June 2020, which preclude an 80 percent surge over nine months despite pandemic uncertainty. Bank Nifty’s May 2022 signal accompanied a 45 percent advance as rising interest margins buoyed lenders. Reliance Industries in June 2023 offered another textbook example, springing from ₹2,350 to above ₹3,100 before its next consolidation. A comparative snapshot of post-crossover gains underscores the pattern’s potential.
Indian equities are influenced by Union Budgets, RBI policy meetings, monsoon forecasts, and election cycles. When a Golden Cross appears post these events, it often coincides with strong institutional and retail participation. Historical examples:
Nifty 50’s June 2020 crossover preceded an 80% rally over nine months.
Reliance Industries’ June 2023 crossover powered the stock from ₹2,350 to over ₹3,100 within a year.
Bank Nifty’s May 2022 crossover led to a 45% advance amid rising interest margins.
Entry Tactics Tailored to Indian Conditions
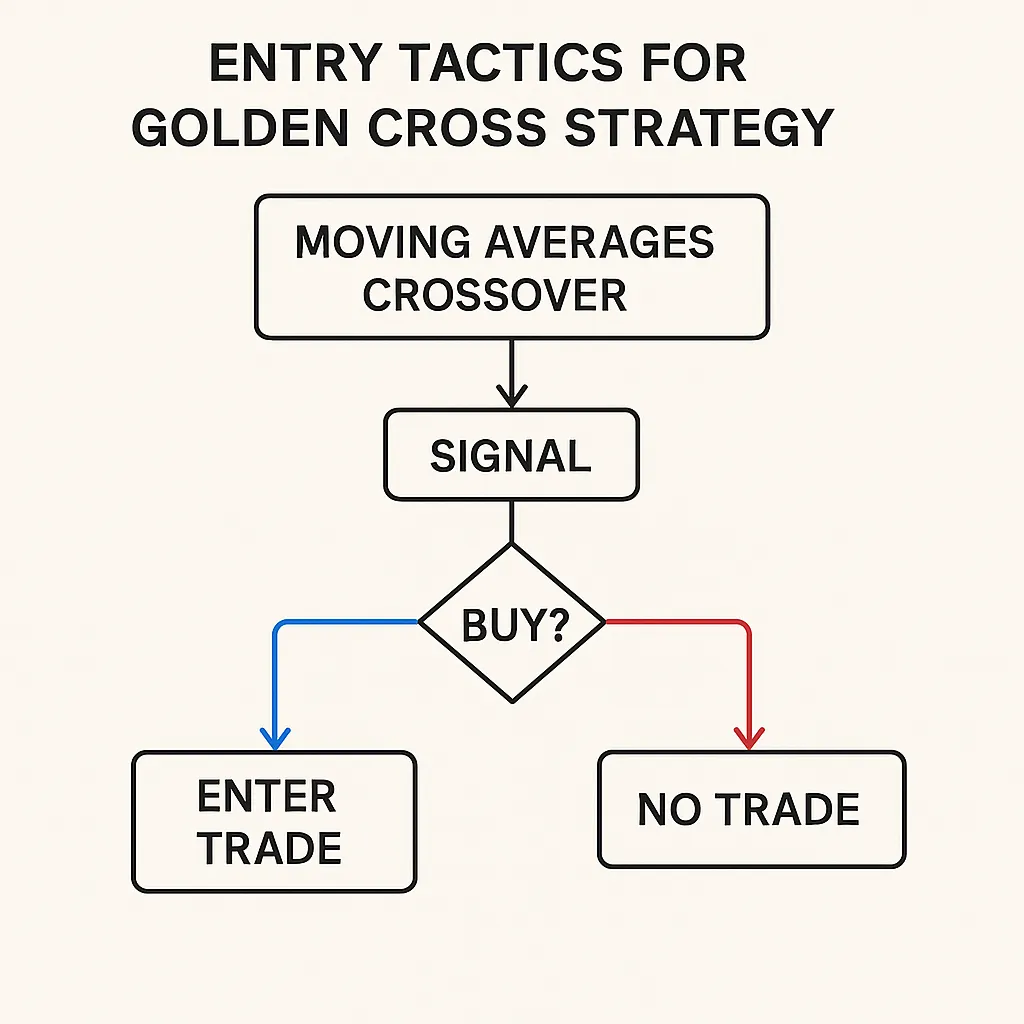
A straightforward approach involves buying on the first close after the crossover, then holding until a Death Cross (the inverse signal) or a decisive breakdown below the 200-day line. Traders seeking refined risk-reward often wait for a gentle pullback to either moving average; a bullish candlestick reversal at that retest provides a clearer price reference for stop-loss placement. Pyramiding : adding to a position each time price bounces off the 50-day line suits volatile mid-caps during strong sectoral momentum, though strict position sizing remains essential.
Recognising High-Quality Setups
Not every crossover justifies action. Volume should expand meaningfully during and after the event, indicating broad participation. Rising market breadth measured by the proportion of Nifty 500 stocks trading above their 200-day averages adds weight. Sector alignment is crucial: when leadership groups such as banking and information technology print concurrent Golden Crosses, upside odds improve. A rising 200-day average further distinguishes sustainable trends from fleeting moves in range-bound stocks.
Not every crossover warrants a trade. Key confirmation factors include:
Volume Expansion: At least 30% above the 20-day average during the crossover.
Rising Breadth: A majority of Nifty 500 stocks trading above their 200-day SMAs.
Sector Alignment: Concurrent crossovers in leadership sectors like banking and IT.
Positive Long-Term Trend: A flat or rising 200-day SMA.
Safeguarding Against False Signals
Moving averages lag price, so a crossover sometimes appears after a substantial up-move, leaving little margin for error just as sentiment grows euphoric. Sideways markets can produce whipsaws where the 50-day repeatedly crosses the 200-day without follow-through. A flattening or falling 200-day average is an early warning that larger trends lack strength. External shocks such as unexpected policy shifts, sharp rupee depreciation, or sudden spikes in global crude prices can also invalidate otherwise sound technical signals. Whenever uncertainty looms, tighter stops and smaller positions help preserve capital.
Integrating Fundamentals Without Diluting Simplicity
While pure technicians trade solely on price, many successful Indian investors blend the Golden Cross with earnings momentum, macro tailwinds, or reform-driven sector themes. For instance, production-linked incentive schemes have ignited durable rallies in select manufacturing names, and a crossover within that policy context carries extra conviction. Similarly, cross-checking whether brokerage earnings upgrades coincide with the technical shift can filter noise from genuine opportunity.
The Golden Cross vs. The Death Cross
The Death Cross 50-day SMA crossing below the 200-day serves as a risk-off exit signal. Because of lag, it often triggers after steep sell-offs; use rising India VIX and breadth deterioration as supplementary cues to avoid whipsaws.
.blogActionDiv { background-color: #000; display: flex; flex-direction: row; align-items: center; justify-content: space-between; padding: 2rem; border-radius: 8px; font-family: manrope; } .blogActionText { color: #FAA8F1 ; font-size: 1.3rem; font-weight: bold; } .blogActionLink { background-color: #FAA8F1 ; padding: 5px 15px; width: 40%; color: #000; font-weight: bold; font-size: .9rem; text-align: center; margin-left: 10px; border-radius: 5px; } @media (max-width: 800px) { .blogActionDiv { flex-direction: column; align-items: center; justify-content: center; padding: 2rem; border-radius: 8px; } .blogActionText { font-size: 1.1rem; font-weight: bold; text-align: center; } .blogActionLink { width: auto; font-weight: bold; margin-left: 0px; margin-top: 10px; } }Conclusion
The Golden Cross distils market optimism into a visual cue that even newcomers can grasp quickly. Yet its real power emerges when combined with volume confirmation, sector strength, and prudent risk controls. For Indian traders, this fusion aligns technical clarity with on-the-ground realities such as policy changes, earnings cycles, and liquidity flows. Master the nuance, respect the risks, and the crossover can become a dependable compass guiding you through the shifting currents of Dalal Street.
The Golden Cross offers a clear visual cue of shifting market sentiment. When combined with volume confirmation, sector strength, fundamental context, and disciplined risk management, it can serve as a reliable cornerstone for trend following in Indian markets. Always treat crossovers as starting points for rigorous analysis rather than guarantees pause, verify, and then act. Master the nuance, respect the risks, and let the Golden Cross guide your journey on Dalal Street.
Our Investment Philosophy
Learn how we choose the right asset mix for your risk profile across all market conditions.
Subscribe to our Newsletter
Get weekly market insights and facts right in your inbox