
Blog home
Newsletter
News
Video
Podcast
Reading list
Wright Brief
Sign In

CCI (Commodity Channel Index): Meaning, Formula and How to Use It

The CCI measures how far price has moved from its average, in units of mean deviation. Formula, a worked example, the +100 and -100 levels, and limits.

Listen to this article
Audio · ~2 min
Add as a preferred source on Google
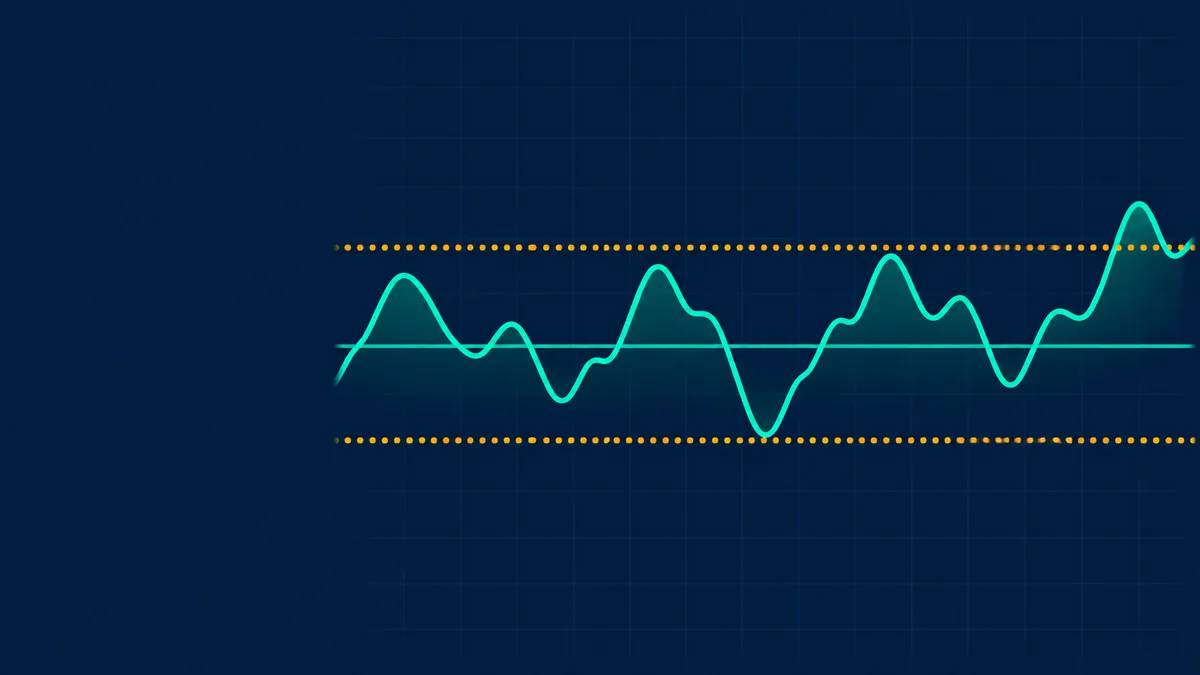
CCI indicator illustration: a wavy line around a midline with upper and lower bands

The Commodity Channel Index, or CCI, measures how far the typical price has moved from its recent average, scaled by the average deviation. Donald Lambert introduced it in 1980 for spotting cycles in commodities, and it is now applied to stocks and indices as well.

The formula

CCI = (typical price - SMA of typical price) / (0.015 x mean deviation). Typical price is (high + low + close) / 3, the SMA is usually over 20 periods, and the mean deviation is the average distance of typical prices from that SMA. The constant 0.015 scales the index so that about 70% to 80% of values fall between -100 and +100.

Free tool

See what markets are pricing in

Live indices, sector moves and market breadth — the backdrop to every story we publish.

Open Market Tracker

A worked example

Today's typical price is 105, its 20-period average is 100 and the mean deviation is 4. The numbers are illustrative.

StepCalculationResult
CCI(105 - 100) / (0.015 x 4)83.3

A reading of 83 means price is a little more than the usual range above its average.

The Wright Brief · free weekly

Get research like this in your inbox

The week’s research that mattered, in five minutes. Joined by 2L+ investors.

Reading the CCI

ReadingCommon interpretation
Above +100Strong upward move. Some read it as overbought, others as the start of a strong trend
Below -100Strong downward move. Some read it as oversold, others as a strong downtrend
Zero-line crossMomentum shifting direction
DivergencePrice makes a new extreme but CCI does not

The CCI has no fixed upper or lower limit, so readings can go well beyond 100 in sharp moves.

Limits

  • The meaning of readings above +100 depends on whether the market is trending or range-bound, so different traders use opposite rules.
  • It can give many signals in choppy markets.
  • The period and levels are conventions. Fitting them to past data is a risk. See overfitting.
  • Compare with RSI and the stochastic oscillator , which use bounded scales.
Free data

Large caps or small caps: who is winning?

Nifty, midcap and smallcap returns from one day to ten years, with the spread and valuation by segment.

Compare market caps

Frequently Asked Questions

What does the CCI measure?

How far the typical price has moved from its average, scaled by the average deviation.

What do CCI levels of +100 and -100 mean?

They mark unusually strong moves above or below the average. They are read as overbought and oversold in ranges, or as signs of trend strength in trends.

Is CCI only for commodities?

No. It was designed for commodities but is used on stocks, indices and currencies.

What is the default CCI period?

20 periods is the common default.

This article is for education only and is not investment advice. Indicator readings describe past price behaviour and do not predict future returns.

Disclaimer: Investment in securities market are subject to market risks. Read all the related documents carefully before investing. Registration granted by SEBI, membership of a SEBI recognized supervisory body (if any) and certification from NISM in no way guarantee performance of the intermediary or provide any assurance of returns to investors.

The content in these posts/articles is for informational and educational purposes only and should not be construed as professional financial advice and nor to be construed as an offer to buy/sell or the solicitation of an offer to buy/sell any security or financial products. Users must make their own investment decisions based on their specific investment objective and financial position and using such independent advisors as they believe necessary.

Wryght Research & Capital Pvt (Brand name: Wright Research) is a SEBI Registered Portfolio Manager Reg No: INP000007979 (Validity: Apr 03, 2023 – Perpetual) and a SEBI Registered Research Analyst No: INH000017295 (Validity: Jul 03, 2024 – Perpetual), with its registered office at 103, Shagun Vatika Prag Narayan Road, Lucknow, UP, 226001 India and CIN: U67100UP2019PTC123244. Past performance may or may not be sustained in future. Performance provided there in is not verified by SEBI. Investment in securities is subject to market and other risks, and there is no assurance or guarantee that the objectives of any of the strategies of the Portfolio Management Services will be achieved. Registration granted by SEBI, enlistment as RA with Exchange and certification from National Institute of Securities Markets (NISM) in no way guarantee performance of the intermediary or provide any assurance of returns to investors. Please read the Disclosure document carefully before investing. Securities quoted are for illustration only and are not recommendatory. Charts shown are for illustration only. For more information and disclosures, visit our disclosures page here.

Found this useful? Share it.
Explore related topics
Siddharth Singh Bhaisora
About the author
Siddharth Singh Bhaisora
Chief Marketing & Growth Officer | Wright Research, Wright Research

Chief Marketing & Growth Officer

Wright PMS · Portfolio Management Service

Put this research to work

The same 300+ factor research engine behind this article — applied to a professionally managed portfolio, end to end.

300+
Factors tracked
2L+
Investors
₹1,200+ Cr
Invested
SEBI
Registered PMS
