

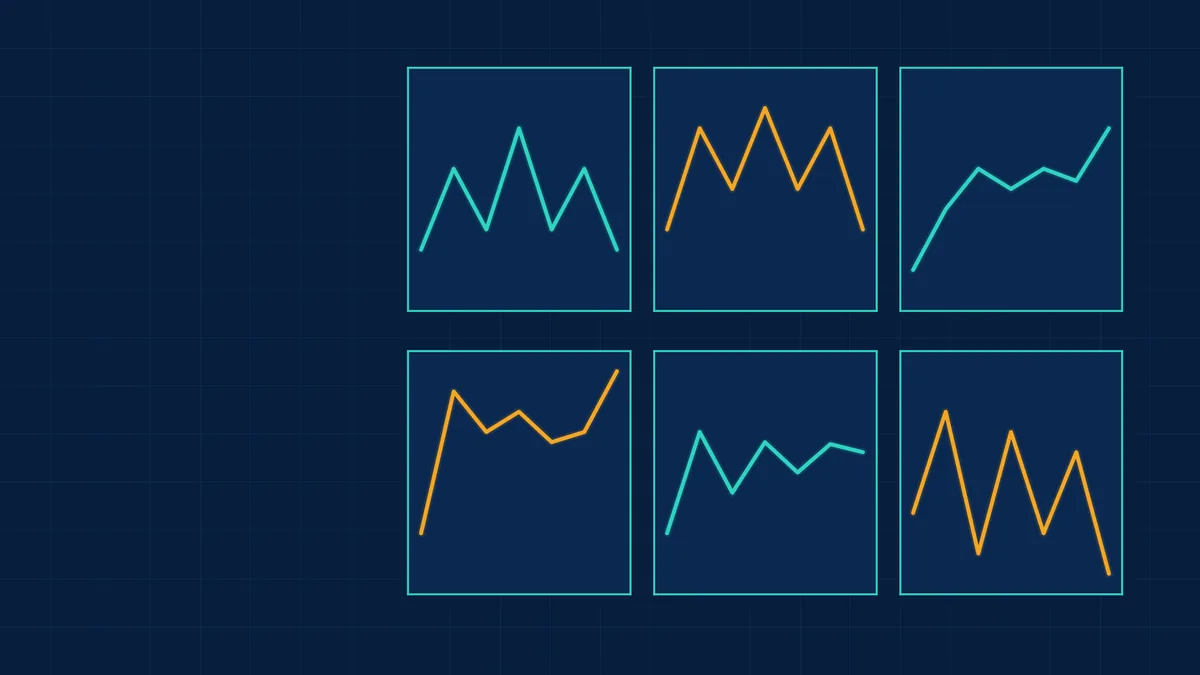
Chart patterns are recurring shapes that price makes as buyers and sellers fight over a level. Reversal patterns suggest a trend may be ending, and continuation patterns suggest it may resume after a pause. This guide lists the main ones with a link to a worked guide for each.
The patterns at a glance
| Pattern | Type | Usually read as | Measured move |
|---|---|---|---|
| Head and shoulders | Reversal | Bearish | Head to neckline height, projected from the neckline |
| Inverse head and shoulders | Reversal | Bullish | Same, projected upward |
| Double top | Reversal | Bearish | Peak to trough height, projected down |
| Double bottom | Reversal | Bullish | Trough to peak height, projected up |
| Rising wedge | Either | Bearish | Back to the wedge's start |
| Falling wedge | Either | Bullish | Back to the wedge's start |
| Cup and handle | Continuation | Bullish | Cup depth added to the breakout |
| Flag and pennant | Continuation | With the pole | Pole length from the breakout |
| Ascending triangle | Continuation | Bullish | Triangle height from the breakout |
| Descending triangle | Continuation | Bearish | Triangle height from the breakdown |
See what markets are pricing in
Live indices, sector moves and market breadth — the backdrop to every story we publish.
All guides
Reversal patterns
Continuation patterns
Building blocks
- Support and resistance
- Trendlines and channels
- Breakout pattern
- Gap up and gap down
- Price action
- Volume
Related guides
Get research like this in your inbox
The week’s research that mattered, in five minutes. Joined by 2L+ investors.
Using patterns sensibly
- Context first: a reversal pattern needs a trend to reverse. Check the trend with trend analysis.
- Confirmation: a pattern is only complete after the key level breaks, ideally on higher volume.
- Measured moves are estimates, not promises, and many patterns fail.
- Risk first: know the level that proves the pattern wrong, and size the position so that the loss is acceptable. See stop-loss order.
- Be sceptical: tests of chart patterns find modest and inconsistent results, and costs and bias matter. See backtesting and data snooping.
Large caps or small caps: who is winning?
Nifty, midcap and smallcap returns from one day to ten years, with the spread and valuation by segment.
Frequently Asked Questions
What are the main chart patterns?
Reversal patterns such as head and shoulders, double tops and bottoms and wedges, and continuation patterns such as cup and handle, flags, pennants and triangles.
What is the difference between reversal and continuation patterns?
Reversal patterns suggest a trend may end. Continuation patterns suggest it may resume after a pause.
How reliable are chart patterns?
They are widely used but fail often. They work best with trend context, confirmation and risk control.
What is a measured move?
A price target estimated by projecting the pattern's height from the breakout or breakdown point.
This article is for education only and is not investment advice. Indicator readings describe past price behaviour and do not predict future returns.



