

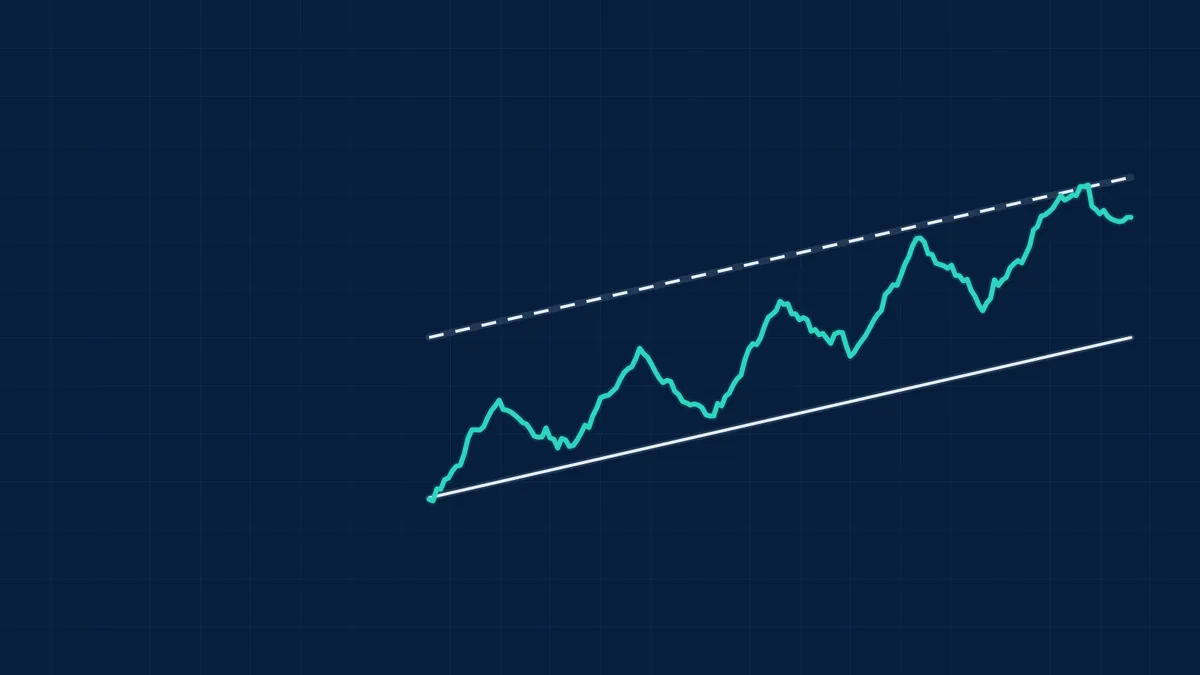
A trendline is a straight line drawn through swing lows in an uptrend, or swing highs in a downtrend, to show the direction and slope of the trend. Adding a parallel line on the other side makes a channel that holds price between two boundaries.
How to recognise it
- Uptrend line: connect at least two rising swing lows, extended to the right. A third touch confirms it.
- Downtrend line: connect at least two falling swing highs.
- Channel: draw a parallel line through the opposite extremes, so price oscillates between support and resistance.
- Steeper lines break more easily, and lines that span more touches carry more weight.
See what markets are pricing in
Live indices, sector moves and market breadth — the backdrop to every story we publish.
A worked example
An uptrend has swing lows at 100 (day 1), 105 (day 11) and 110 (day 21). The prices are illustrative.
| Step | Calculation | Result |
|---|---|---|
| Slope | (105 - 100) / 10 days | 0.5 per day |
| Projected line on day 31 | 110 + 0.5 x 10 | 115 |
| Parallel upper line through a swing high of 118 on day 16 | Channel width about 10 | Upper boundary near 126 on day 31 |
Get research like this in your inbox
The week’s research that mattered, in five minutes. Joined by 2L+ investors.
How traders read it
- Trend continuing: bounces off the lower line are watched as possible entries within an uptrend.
- Trendline break: a close below an uptrend line is read as a loss of momentum, and often followed by a retest of the broken line from below.
- Channel break: a break above the upper line can show acceleration, and a break below the lower line a possible reversal.
Limits to keep in mind
- Patterns are judgement calls. Two traders can draw the same chart differently, so results depend on how strictly the rules are applied.
- False breakouts happen. Many traders wait for a close beyond the level, ideally with higher volume , before acting. See breakout pattern.
- Lines can be redrawn. Adjusting a line after a break to keep the trend alive is hindsight. Fix the rules in advance.
- Targets are estimates, not guarantees. Limit risk with a stop-loss.
- Evidence is mixed. Studies of chart patterns have found modest and inconsistent predictive power. Systematic investors test rules on large samples with costs, as described in backtesting.
See the full chart patterns guide.
Large caps or small caps: who is winning?
Nifty, midcap and smallcap returns from one day to ten years, with the spread and valuation by segment.
Frequently Asked Questions
What is a trendline?
A line connecting swing lows (uptrend) or swing highs (downtrend) that shows the direction and slope of a trend.
How many touches make a valid trendline?
Two points define a line, and a third touch is generally taken as confirmation.
What is a price channel?
Two parallel trendlines enclosing price, one along the lows and one along the highs.
What does a trendline break mean?
It suggests the trend's momentum is weakening, but needs confirmation, because false breaks are common.
This article is for education only and is not investment advice. Indicator readings describe past price behaviour and do not predict future returns.



