

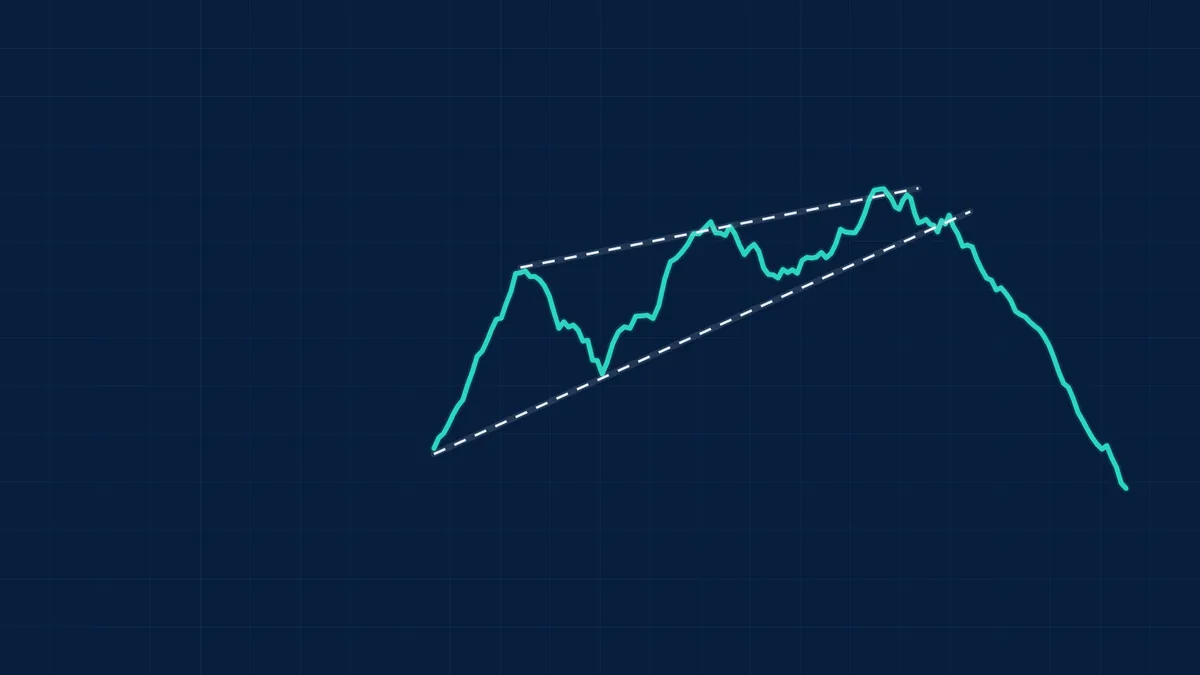
A wedge is a pattern in which two converging trendlines slope in the same direction. A rising wedge slopes up and is usually read as bearish, since the advance loses force. A falling wedge slopes down and is usually read as bullish.
How to recognise it
- Rising wedge: higher highs and higher lows, with the lows rising faster than the highs, so the lines converge. Often seen at the end of rallies.
- Falling wedge: lower highs and lower lows with the highs falling faster than the lows. Often seen at the end of declines.
- Volume usually shrinks as the wedge narrows.
- Wedges typically last several weeks.
See what markets are pricing in
Live indices, sector moves and market breadth — the backdrop to every story we publish.
A worked example
A rising wedge: price makes highs of 110, 112, 113 and lows of 102, 106, 109. The prices are illustrative.
| Item | Calculation | Result |
|---|---|---|
| Range at start | 110 - 102 | 8 |
| Range at the end | 113 - 109 | 4 |
| Breakdown level | Below the lower line, about 108 | |
| Typical target | Back to the wedge's starting low | about 102 |
Get research like this in your inbox
The week’s research that mattered, in five minutes. Joined by 2L+ investors.
How traders read it
- A rising wedge shows that each new high is achieved with less strength, and a break below the lower line is the confirmation.
- A falling wedge shows selling losing force, and a break above the upper line is the confirmation.
- A stop is often placed beyond the wedge's last swing.
Limits to keep in mind
- Patterns are judgement calls. Two traders can draw the same chart differently, so results depend on how strictly the rules are applied.
- False breakouts happen. Many traders wait for a close beyond the level, ideally with higher volume , before acting. See breakout pattern.
- Wedges can break in the same direction as their slope or turn into a longer trend, so the label alone is not a signal.
- Targets are estimates, not guarantees. Limit risk with a stop-loss.
- Evidence is mixed. Studies of chart patterns have found modest and inconsistent predictive power. Systematic investors test rules on large samples with costs, as described in backtesting.
See the full chart patterns guide.
Large caps or small caps: who is winning?
Nifty, midcap and smallcap returns from one day to ten years, with the spread and valuation by segment.
Frequently Asked Questions
What is a rising wedge?
A pattern of rising, converging trendlines that is usually read as bearish because the advance is losing momentum.
What is a falling wedge?
A pattern of falling, converging trendlines that is usually read as bullish because the decline is losing momentum.
Are wedges reversal or continuation patterns?
They can be either. A rising wedge in an uptrend often reverses, while a rising wedge in a downtrend can continue the decline.
How do you confirm a wedge?
By a close beyond one of the trendlines, ideally with higher volume.
This article is for education only and is not investment advice. Indicator readings describe past price behaviour and do not predict future returns.



