

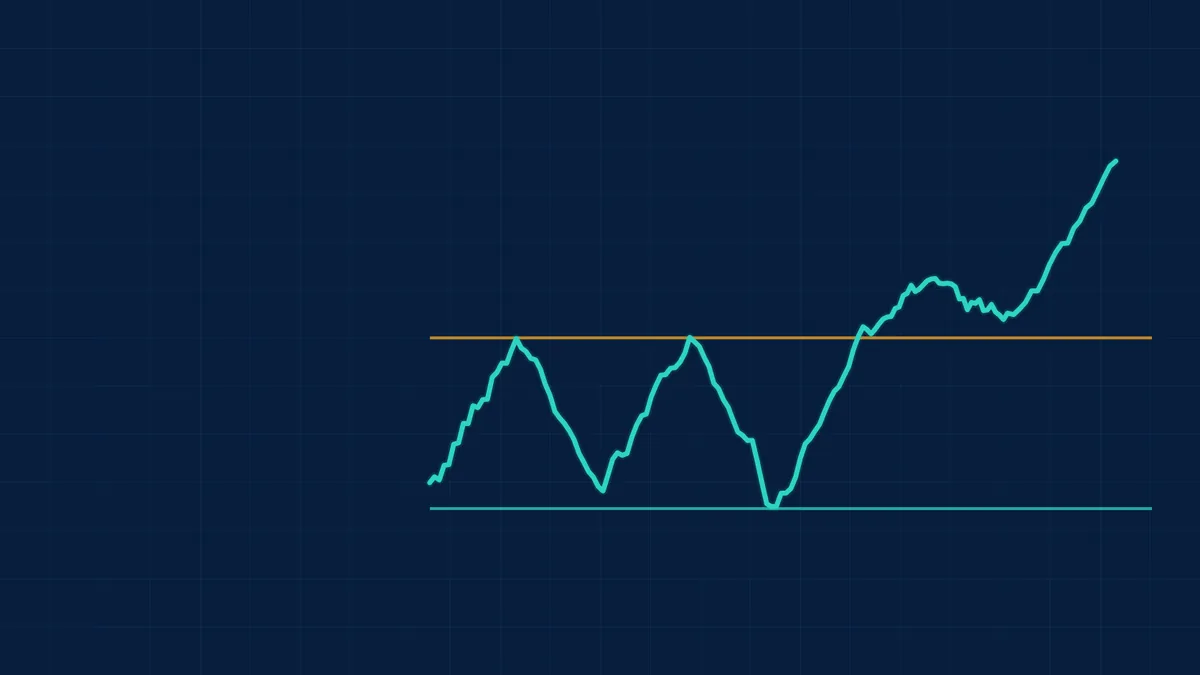
Support is a price area where falling prices have repeatedly stopped and turned up, because buyers step in. Resistance is a price area where rising prices have repeatedly stopped and turned down, because sellers step in. They are the foundation of most other chart patterns.
How to recognise it
- Mark swing lows that price bounced from (support) and swing highs that price fell from (resistance).
- Use zones, not exact lines. Price often turns a little above or below the level.
- The more times a level has been tested, and the more recent and the higher the volume, the more it matters.
- Round numbers (for example 100, or 24,000 on the Nifty) often act as levels because many orders cluster there.
See what markets are pricing in
Live indices, sector moves and market breadth — the backdrop to every story we publish.
A worked example
A stock has reversed three times near Rs 100. The prices are illustrative.
| Event | Price action | Meaning |
|---|---|---|
| Touch 1 | Falls to 92, rises to 100 | Rs 100 acts as resistance |
| Touch 2 | Rises to 100, falls to 93 | Resistance holds, Rs 92 to 93 forms support |
| Touch 3 | Rises to 100, falls to 92 | Both levels confirmed |
| Breakout | Closes at 103 on high volume | Resistance may now turn into support |
Get research like this in your inbox
The week’s research that mattered, in five minutes. Joined by 2L+ investors.
How traders read it
- Role reversal: when resistance breaks, it often becomes support on a retest, and when support breaks it often becomes resistance. In the example, a pullback to 100 that holds is the retest.
- Breakouts and breakdowns: a decisive close through a level on rising volume is read as a change in balance. See breakout pattern.
- Targets and stops: traders often place stops just beyond a level and targets at the next level.
Limits to keep in mind
- Patterns are judgement calls. Two traders can draw the same chart differently, so results depend on how strictly the rules are applied.
- False breakouts happen. Many traders wait for a close beyond the level, ideally with higher volume , before acting. See breakout pattern.
- Levels are subjective. Different timeframes give different levels, and longer timeframes carry more weight.
- Targets are estimates, not guarantees. Limit risk with a stop-loss.
- Evidence is mixed. Studies of chart patterns have found modest and inconsistent predictive power. Systematic investors test rules on large samples with costs, as described in backtesting.
See the full chart patterns guide.
Large caps or small caps: who is winning?
Nifty, midcap and smallcap returns from one day to ten years, with the spread and valuation by segment.
Frequently Asked Questions
What are support and resistance?
Support is a price area where declines have stopped repeatedly, and resistance is a price area where advances have stopped repeatedly.
How do you draw support and resistance?
Mark the swing lows and highs where price has reacted several times, and treat them as zones. Higher-timeframe levels carry more weight.
What is role reversal?
When a broken resistance level becomes support, or a broken support becomes resistance, as price returns to retest it.
Why do round numbers act as support and resistance?
Because many traders place orders, stops and targets at round numbers, which concentrates buying and selling there.
This article is for education only and is not investment advice. Indicator readings describe past price behaviour and do not predict future returns.



