

What is Price Action in Trading?
Price action trading is a method of analyzing and making trading decisions based purely on the movement of stock prices over time. Unlike other trading strategies that rely heavily on technical indicators, price action focuses on reading the "footprints" left by buyers and sellers through candlestick patterns, support and resistance levels, and trend structures.
For Indian traders, this approach is particularly valuable because it works across all markets - whether you're trading Nifty 50 index stocks, Bank Nifty, or individual stocks like Reliance Industries, TCS, or HDFC Bank. The beauty of price action lies in its simplicity , it strips away the complexity of multiple indicators and focuses on what truly matters: the actual price movements.
See what markets are pricing in
Live indices, sector moves and market breadth — the backdrop to every story we publish.
How Price Action Trading Works in Indian Markets
The Indian stock market, with its unique characteristics and trading patterns, provides excellent opportunities for price action trading. The NSE and BSE markets show clear support and resistance levels, trend patterns, and candlestick formations that price action traders can exploit.
Key Components of Price Action Trading:
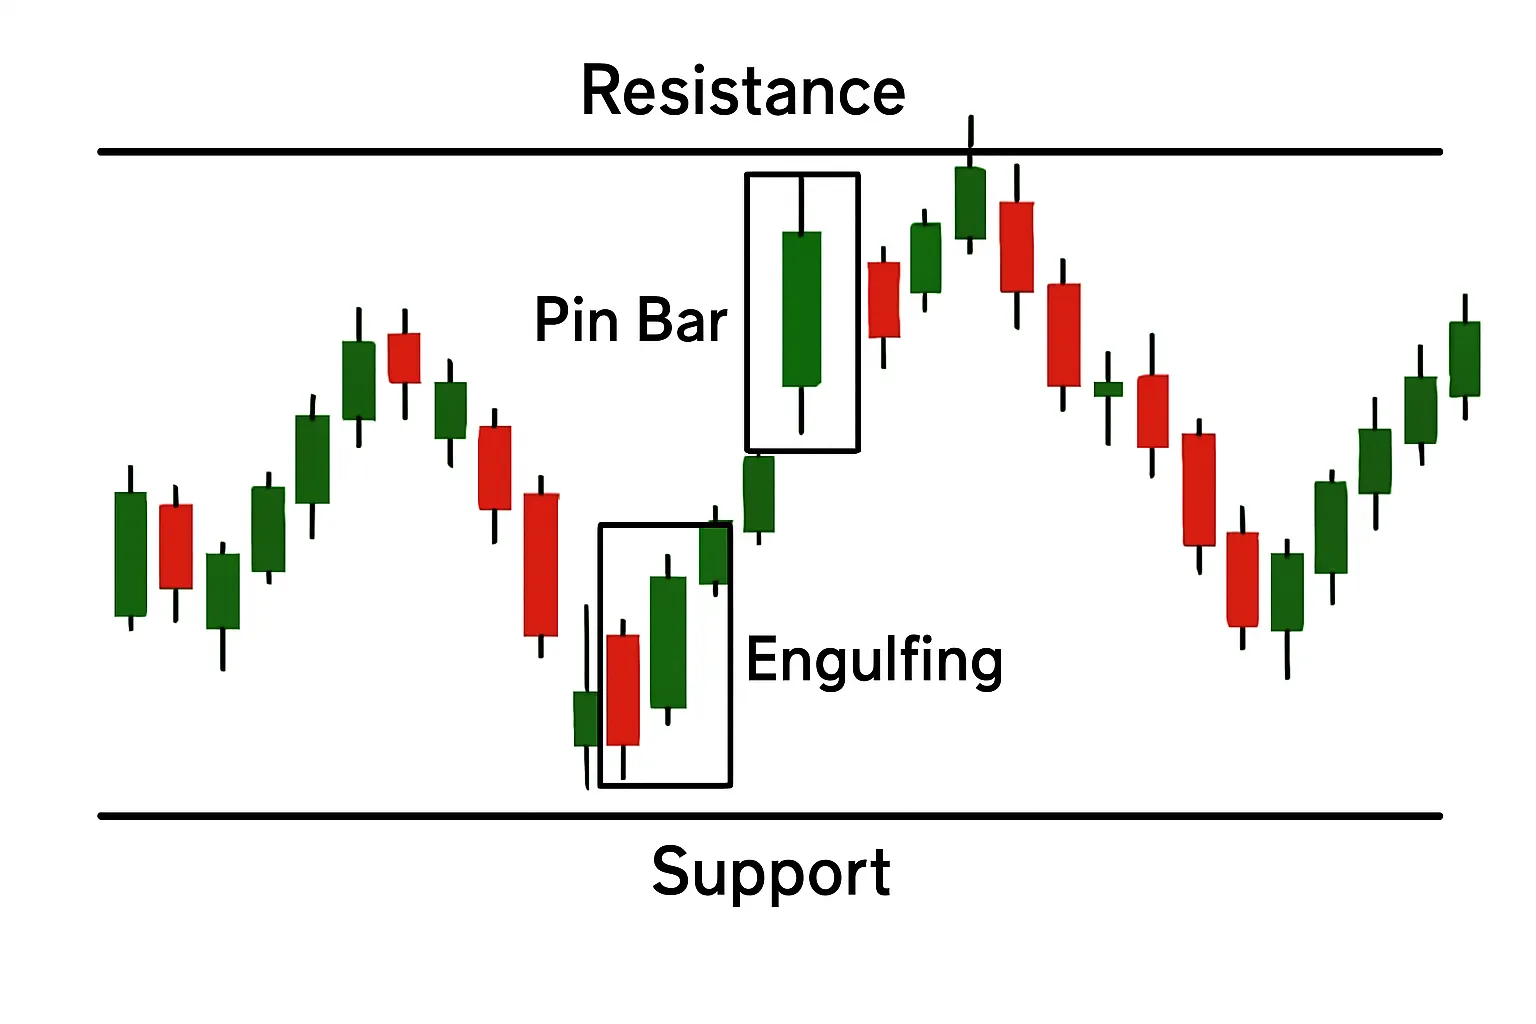
Support and Resistance Levels: These are price levels where stocks tend to find buying or selling pressure. For example, if Reliance Industries consistently bounces from ₹1,200 levels, this becomes a key support zone.
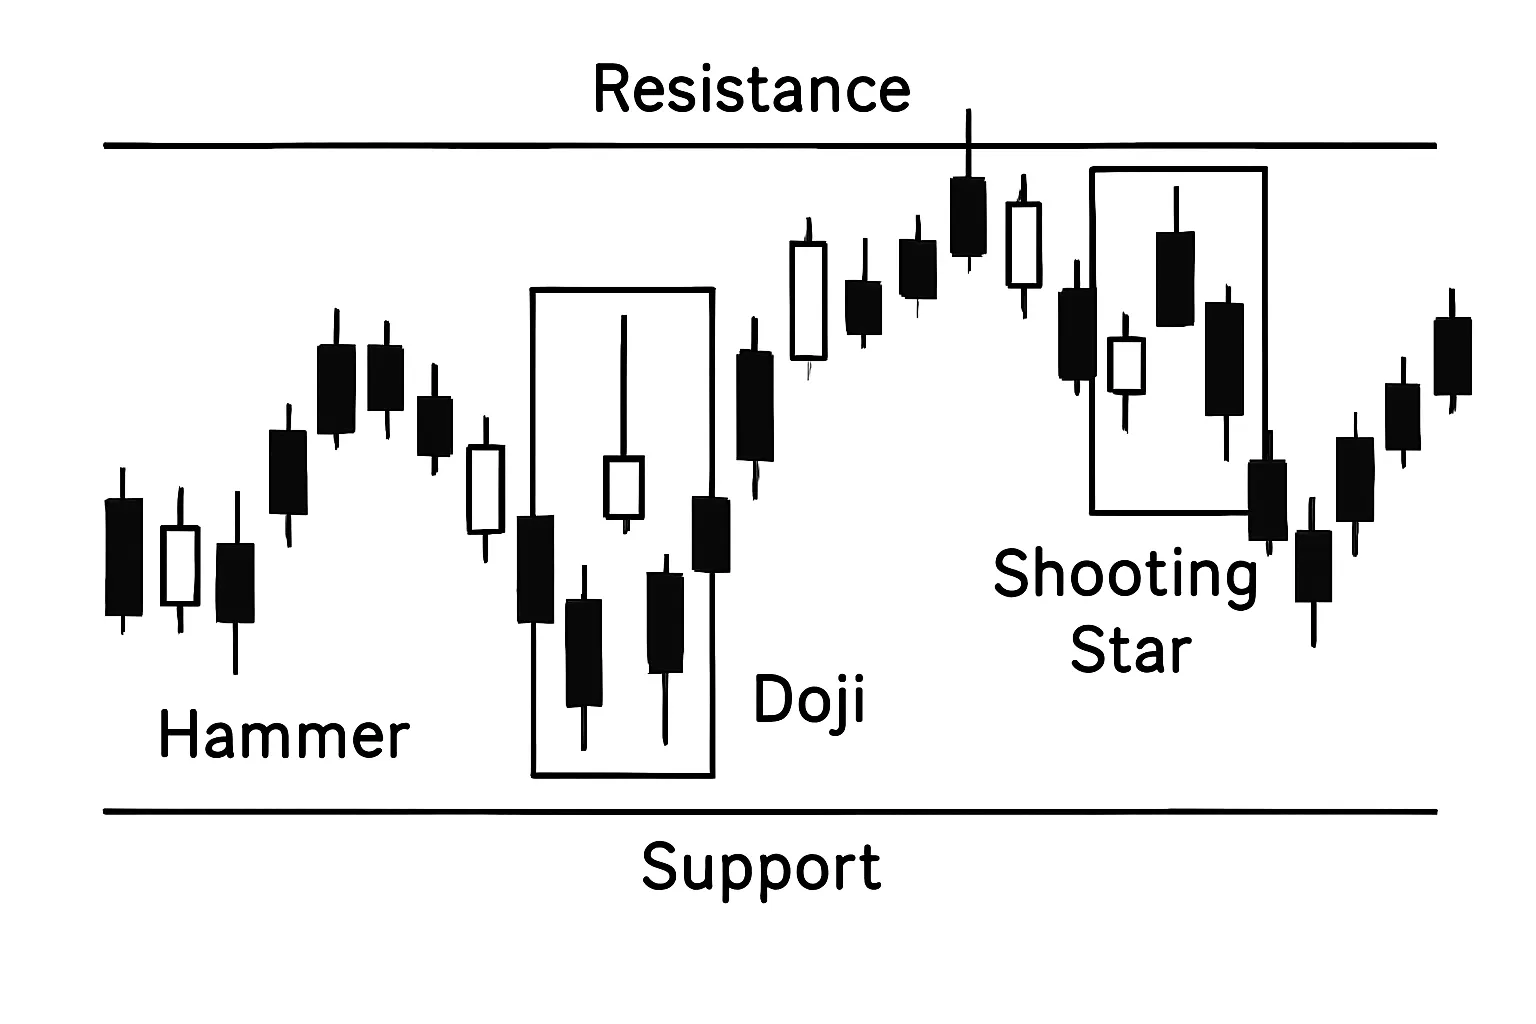
Candlestick Patterns: These visual representations show the battle between buyers and sellers. Common patterns include hammer, doji, engulfing patterns, and shooting stars.
Trend Analysis: Identifying whether the market is in an uptrend, downtrend, or sideways movement helps determine the overall direction.
Volume Confirmation: While not always required, volume often confirms the strength of price movements.
Common Price Action Patterns in Trading
Single Candlestick Patterns
Hammer: A bullish reversal pattern that often appears at the bottom of downtrends. Recently, stocks like TCS have shown multiple hammer candlestick patterns , hinting at potential buying opportunities.
Shooting Star: A bearish reversal pattern that signals potential selling pressure. This pattern frequently appears at resistance levels in Indian stocks.
Doji: Indicates indecision in the market and often precedes significant moves. The Nifty 50 has shown several doji patterns in recent months.
Multi-Candlestick Patterns
Bullish Engulfing: A two-candle pattern where a large green candle completely engulfs the previous red candle, indicating strong buying pressure.
Bearish Engulfing : The opposite of bullish engulfing, signaling potential selling pressure.
Morning Star: A three-candle bullish reversal pattern that often appears after significant declines.
Evening Star: A three-candle bearish reversal pattern that signals potential trend changes.
Benefits of Price Action Trading
Simplicity and Clarity: Price action trading is highly valued for its straightforward approach, eliminating the chaos that often accompanies multiple technical indicators cluttering your screen. Rather than juggling contradictory signals and complex calculations, Indian traders can focus on the basics, clearly identifying support and resistance levels and interpreting price bars or candlestick patterns. This leads to greater clarity and efficiency in decision-making. Clean charts not only make market analysis less stressful but also help you quickly identify genuine opportunities, reducing analysis paralysis and boosting overall trading confidence.
Universal Application: One of the greatest strengths of price action trading is its adaptability to any financial instrument. In the Indian market, whether you are working with heavyweight large-cap stocks like HDFC Bank, actively trading mid-cap shares, or taking positions in index futures such as Bank Nifty or Nifty 50, the core principles of price action like spotting trends, identifying key levels, and recognizing classic chart patterns remain unchanged. This consistency means you don’t need to learn a new set of rules for every segment of the market, making your trading process more fluid and transferable across various stocks and instruments.
Real-Time Decision Making: Unlike lagging indicators, which react to market moves after they have happened, price action gives you the ability to observe and respond to market changes as they unfold. In the fast-moving Indian trading environment, where sudden news or policy updates can move prices within minutes, having access to immediate signals is a significant advantage. By relying on evolving price patterns and levels, you can make timely trading decisions, maximizing opportunities and managing risks right as the action is taking place, rather than after the fact.
Cost-Effective: Another major attraction of price action trading for Indian retail traders is that it doesn’t require any special or expensive tools. Most brokers and free financial websites provide standard price and candlestick charts, eliminating the need for costly subscriptions or complex software. This means you can start learning and trading effectively without significant upfront investment. For beginners and small-capital traders, this affordability removes financial barriers, allowing them to participate in the markets and focus their resources where it matters most in trading and education.
Works Across Timeframes: The versatility of price action trading shines through its effectiveness across all timeframes. Whether you are an intraday trader monitoring 5-minute or 15-minute charts, a swing trader planning trades over several days, or even a longer-term investor using weekly timeframes, the core analysis and strategies remain relevant. This flexibility enables both full-time and part-time Indian traders to integrate price action methods into their routines, adapting them to individual lifestyles, market timings, and risk appetites without compromising on strategy or accuracy.
Get research like this in your inbox
The week’s research that mattered, in five minutes. Joined by 2L+ investors.
Limitations of Price Action Trading
Subjectivity in Interpretation
Different traders may interpret the same chart differently. What one trader sees as a bullish hammer, another might view as a spinning top.
Experience Required
Successful price action trading requires significant practice and experience. New traders often struggle with pattern recognition and market timing.
Market Noise and False Signals
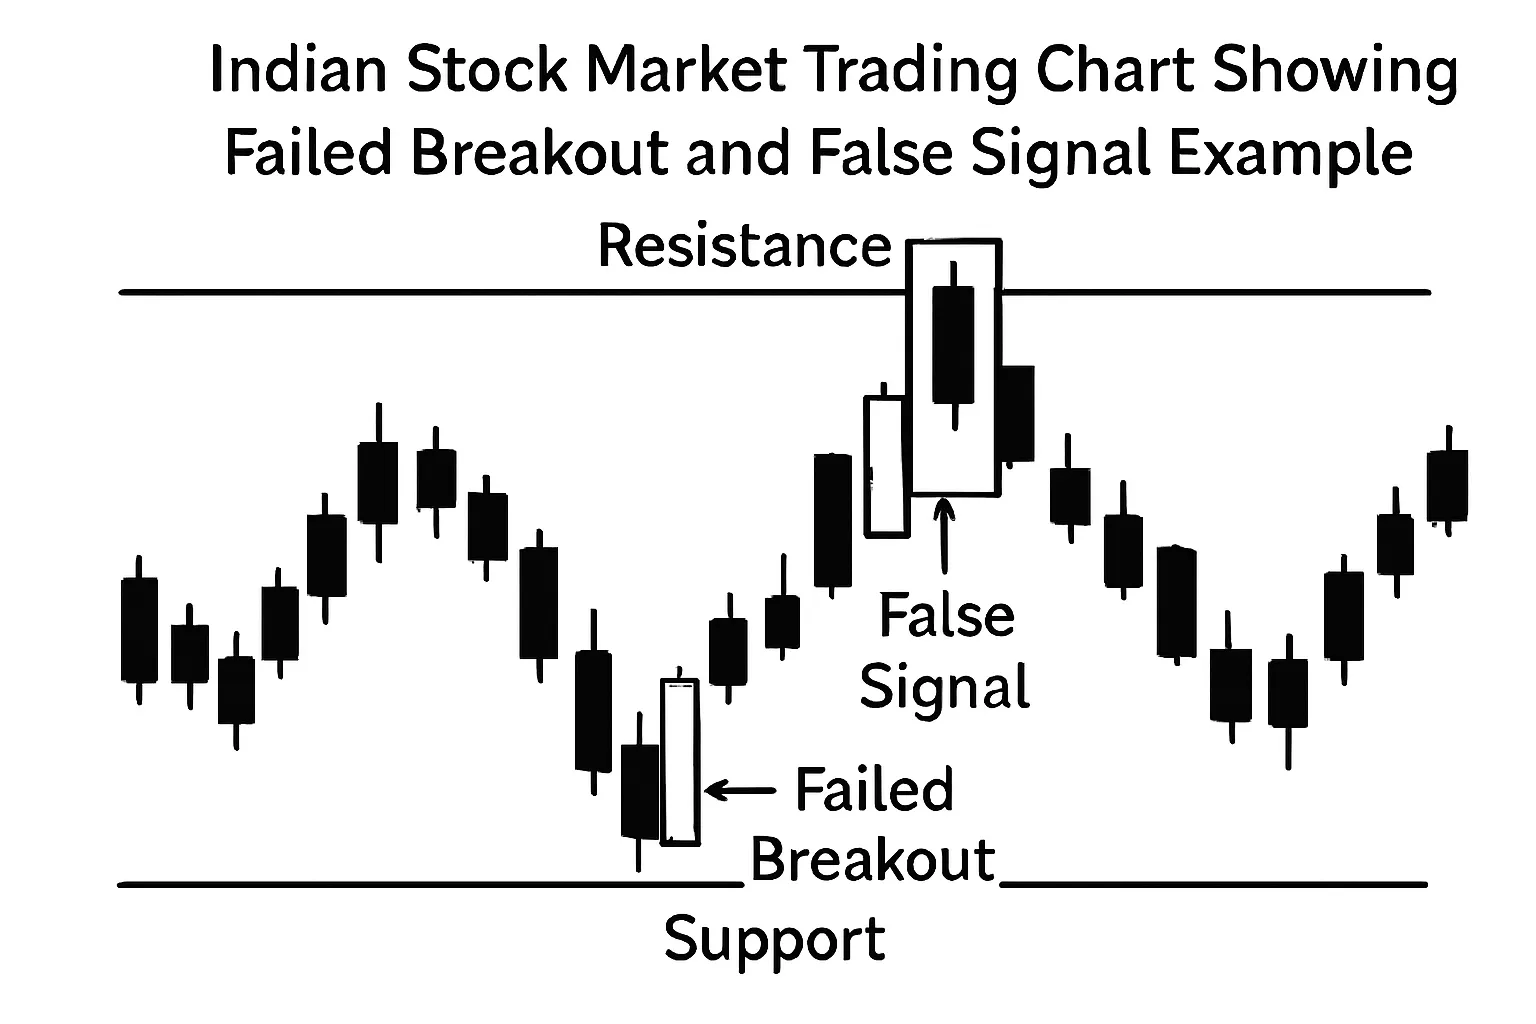
Indian markets can be volatile, leading to false breakouts and failed patterns. For example, many stocks show fake breakouts that trap traders.
Emotional Challenges
Price action trading requires disciplined execution. Many traders struggle with emotional decision-making, especially during volatile market conditions.
Limited to Price Data
Price action ignores fundamental factors that might significantly impact stock prices, such as earnings announcements or policy changes.
Time-Intensive
Successful price action trading requires constant chart monitoring and analysis, which can be time-consuming.
How to Develop a Price Action Trading Strategy
Step 1: Identify Market Structure
Start by identifying the overall trend on higher timeframes (daily/weekly). For example, if you're trading Nifty 50, first determine if it's in an uptrend, downtrend, or sideways movement.
Step 2: Mark Key Levels
Identify significant support and resistance levels where price has previously reacted. These become your key zones for potential trades.
Step 3: Wait for Confirmation
Look for candlestick patterns or price action signals at these key levels. For instance, a bullish engulfing pattern at strong support provides a high-probability trade setup.
Step 4: Plan Your Trade
Entry: Just above the high of the confirmation candle
Stop Loss: Below the low of the pattern
Target: Next resistance level or based on risk-reward ratio of at least 1:2
Step 5: Manage Risk
Never risk more than 1-2% of your capital on any single trade. Use position sizing to manage risk effectively.
Common Price Action Trading Mistakes to Avoid
Understanding frequent pitfalls in price action trading is essential for consistent success on Indian markets. Here is a deeper look at each point:
Over-Trading
Over-trading happens when traders take excessive positions, often reacting to every minor price move rather than waiting for quality setups. In Indian markets, this might mean entering trades purely out of boredom or a fear of missing out (FOMO), especially during flat or choppy periods.
Why it's risky: Frequent trades increase brokerage costs, expose you to more market noise, and can lead to mental fatigue.
Good practice: Have a predefined checklist for high-probability setups. If the market does not present a clear opportunity (like strong patterns at major support/resistance), it is better to stay on the sidelines. Patience is as important as skill in trading.
Ignoring Risk Management
Neglecting stop losses or proper position sizing is a leading cause of large losses, particularly in volatile Indian stocks or indices.
Why it's risky: Without stop losses, a single sharp market movement possibly triggered by company results, budget announcements, or regulatory changes can wipe out significant capital.
Good practice: Predetermine your maximum risk per trade (commonly 1–2% of your capital). Always place a stop loss at an invalidation level, and adjust your trade size so that a loss on any single trade remains manageable.
Chasing Breakouts
Chasing breakouts refers to entering trades as soon as the price appears to break a key level, without waiting for confirmation. This is particularly problematic in Indian markets, where false breakouts or "fakeouts" are common due to thin liquidity, algorithmic trading, or pre-event volatility.
Why it's risky: Entering prematurely can result in whipsaw trades, where price reverses quickly after triggering your entry.
Good practice: Pause after a breakout; watch for a candle close above/below the breakout level or a retest (pullback) before entering. Pullback entries typically offer better risk-reward and filter out weak moves.
Mixing Timeframes
Switching between different timeframes during a trade creates confusion and can undermine your trading plan.
Why it's risky: For example, if you analyze a trade on a daily chart but switch to a 5-minute chart for entry or exit decisions, you may act on irrelevant short-term moves and lose sight of the overall trend or setup.
Good practice: Select your trading timeframe before starting (e.g., daily charts for swing trading, 15-minute charts for intraday), and make all decisions setup, entry, exit, and stop loss based on that timeframe’s signals.
Emotional Trading
Trading without emotional discipline leads to impulsive decisions, such as overreacting to major news, sudden price swings, or seeing profits and losses fluctuate.
Why it's risky: Emotional responses like fear, greed, and frustration can cause you to deviate from your strategy, cut winners too early, or hold onto losers too long.
Good practice: Develop and rigorously follow a written trading plan. Take regular breaks, keep a detailed trading journal, and use position sizes that prevent emotional stress. Remind yourself that no single trade should make or break your account.
By deepening your awareness of these challenges and actively working to avoid them, you can enhance your effectiveness and emotional resilience as a price action trader in the Indian markets.
Conclusion
Price action trading offers Indian traders a powerful, straightforward approach to market analysis and decision-making. While it requires dedication to learn and practice, the benefits of clean chart analysis, universal application, and real-time decision-making make it attractive for serious traders.
The key to success lies in understanding that price action trading is both an art and a science. It requires technical knowledge combined with market experience and emotional discipline. For Indian traders willing to invest the time and effort to master this approach, price action trading can provide a solid foundation for consistent trading success.
Remember that no trading strategy guarantees profits, and the Indian stock market carries inherent risks. Always practice with paper trading first, maintain proper risk management, and consider your financial situation before implementing any trading strategy.
Start with simple patterns and gradually build your expertise. With time and practice, you'll develop the ability to read market sentiment through price action alone, giving you a significant advantage in the dynamic Indian stock markets.
Run the numbers on your next investment
Project returns on a lumpsum or SIP with our free calculators.
Frequently Asked Questions About Price Action Trading
1. What is price action trading?
Price action trading involves making buy or sell decisions based solely on how prices move on a chart—studying candlesticks, patterns, and key levels—without relying much on indicators or complex tools. It helps traders understand market sentiment by watching the actual price behaviour over time.
2. How does price action trading work?
It works by analyzing historical and current price movements, identifying key support/resistance areas, spotting trends, and reading candlestick patterns. Traders wait for recognizable price patterns near important levels to decide when to enter or exit trades 4 5.
3. What Tools Are Used for Price Action Trading?
The main tools are simple charts (often candlestick charts) and basic drawing tools to mark support, resistance, and trendlines. No special indicators are required—just clean, clutter-free charts that display raw price movements.
4. Is price action trading suitable for beginners?
Yes, because it’s easy to start with and helps build a strong foundation. Since it emphasizes simplicity and observation, beginners can quickly grasp market structure and trading psychology by practicing on live charts.
5. What Are the Main Benefits of Price Action Trading?
Key benefits include:
Clarity: Clean charts reduce confusion.
Adaptability: Works on all markets—from stocks to forex to commodities.
Timeliness: Helps make faster decisions because it avoids indicator lag.
Focus: Encourages learning market psychology and trend recognition.


