Momentum investing has long been a strategy favored by traders and investors alike. It centers around the idea that assets which have performed well in the past are likely to continue performing well in the future. In this post, we'll delve into some of the top indicators that seasoned investors use to gauge momentum. Let's dive in!
Introduction to Momentum Investing
Momentum investing is a strategy that captures the essence of one of the oldest adages in trading: "The trend is your friend." At its core, it involves capitalizing on the continuation of existing trends in the market. Think of it like a surfer waiting for the perfect wave. Once he spots a strong wave forming, he paddles fiercely, catches the wave, and rides it until its momentum falters. In the investing world, this wave is the price movement of securities, and momentum investors are always on the lookout for stocks that are moving steadily in a particular direction, aiming to hop on board and enjoy the ride for as long as the trend continues.
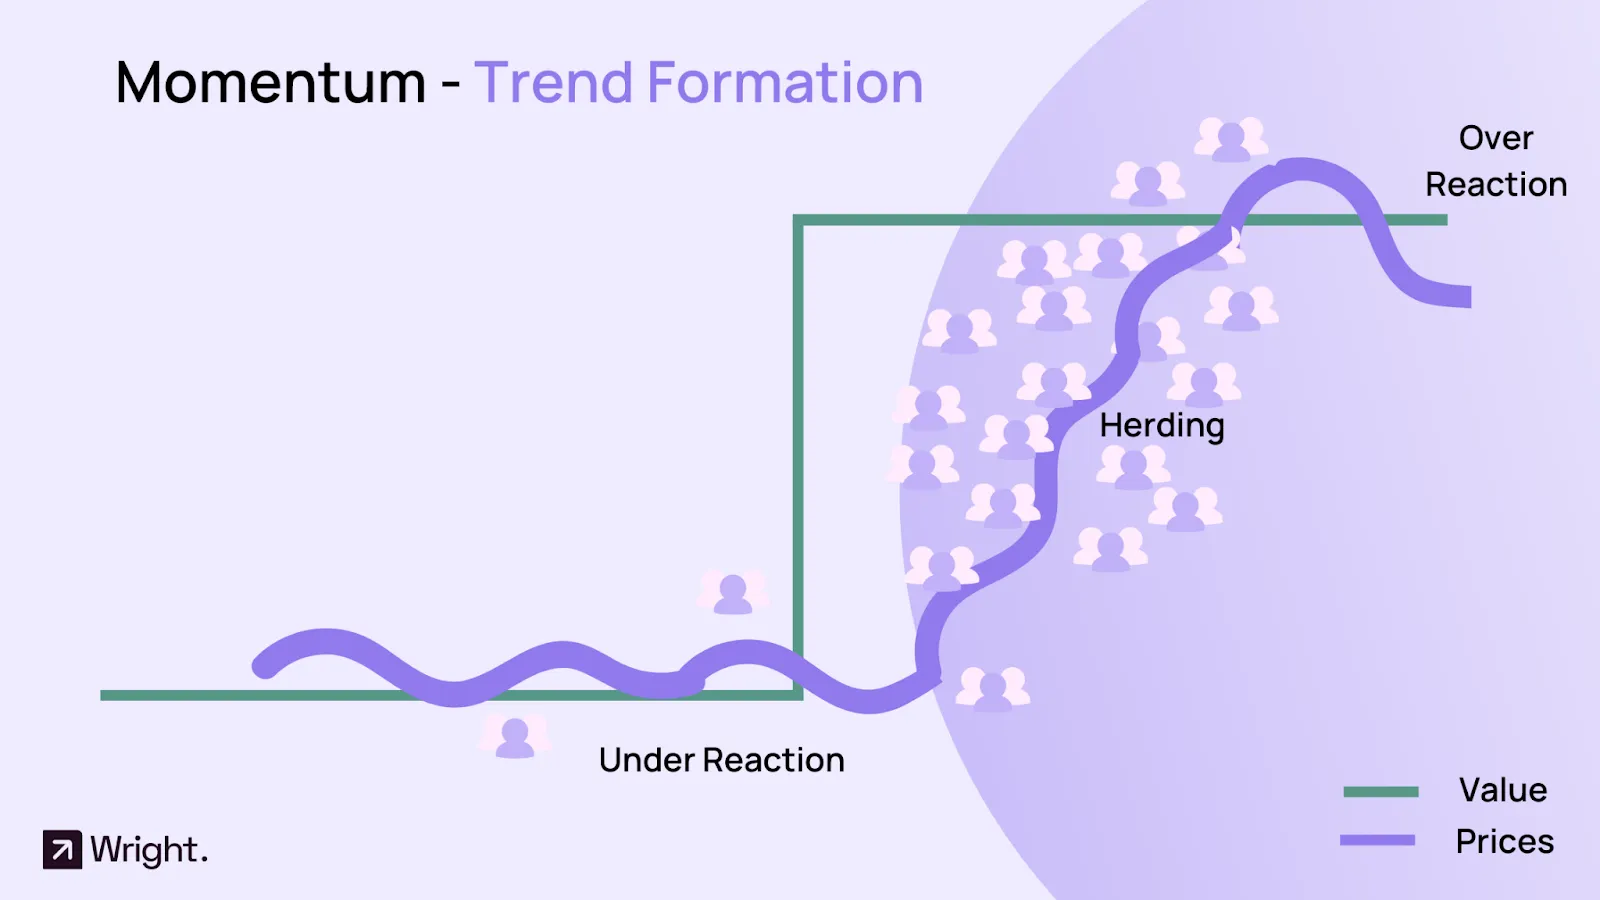
Beyond its surface definition, momentum investing finds its roots deeply embedded in behavioral finance. Human beings, being emotional creatures, often make investment decisions based on psychological factors rather than cold, hard facts. Here's how behavioral tendencies play into momentum:
Herding Behavior: Many investors tend to follow the crowd. If they see others buying a particular stock and its price rising, they're more likely to jump on the bandwagon, fearing they might miss out on potential gains. This herd mentality can push the prices of securities higher, creating or amplifying existing momentum.
Confirmation Bias: Once investors have made a decision or taken a position in the market, they tend to seek out information that confirms their choice was correct. When they see a stock they own (or are considering buying) going up, it reinforces their belief in the positive momentum of the stock, and they may buy even more.
Overconfidence and Overreaction: Sometimes, investors can become overly confident in their predictions about the market. They may pile into a stock that has shown recent gains, expecting the trend to continue indefinitely. Alternatively, they may overreact to recent news or data, pushing prices further in the direction of the trend.
Anchoring: Investors often anchor their perception of a stock's value to recent price levels. If a stock has been on an upward trend, they might view dips as buying opportunities, believing the stock will return to its recent highs. This behavior can support and extend the momentum of a rising stock.
These behavioral tendencies, among others, contribute to sustained trends in stock prices. By recognizing and understanding these patterns, momentum investors aim to exploit them, buying stocks that are on an upswing and selling them before the trend reverses.
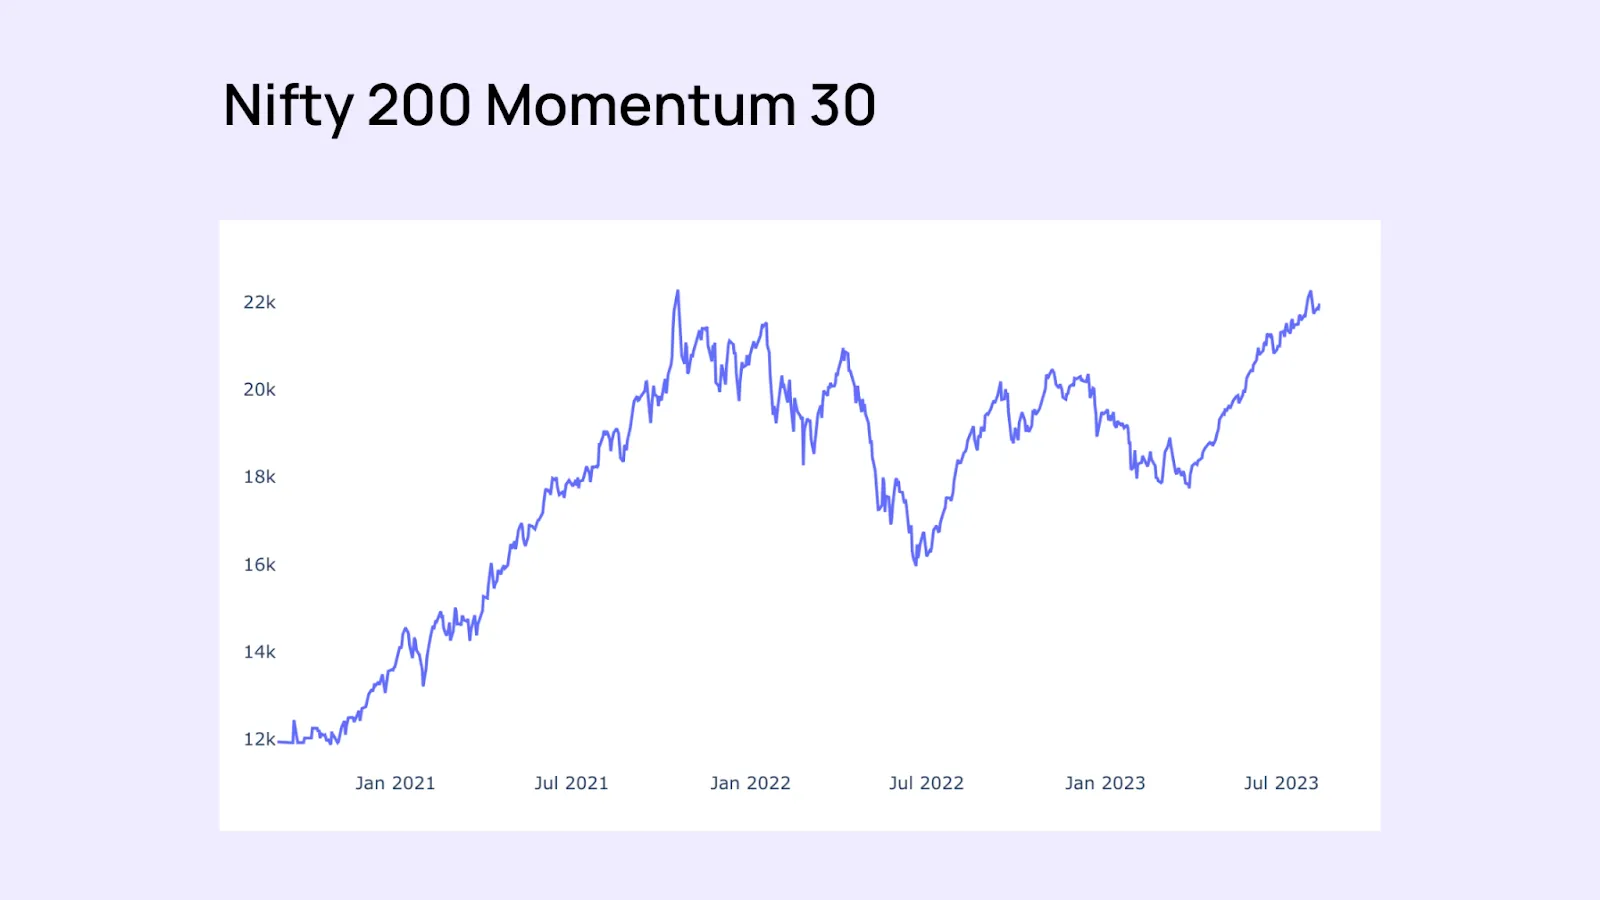
How the Nifty Momentum Index is Calculated
The Nifty200 Momentum 30 Index tracks the top 30 companies from the Nifty 200 based on their Normalized Momentum Score. Eligibility requires stocks to be part of the Nifty 200 with a minimum 1-year listing. The momentum of each stock is gauged through a combination of 6-month and 12-month price returns, adjusted for volatility. This data is used to calculate a Z Score , which forms the basis for the Normalized Momentum Score. The top 30 stocks with the highest scores are selected. Weights for each stock in the index are derived by multiplying their free float market capitalization with their momentum score. However, there's a cap: stocks cannot exceed 5% or 5 times their weight based purely on market capitalization. The index is rebalanced semi-annually and undergoes ad-hoc adjustments for specific corporate events or regulatory compliances.
Time Series Momentum
Time series momentum (TSM) refers to the persistence of an asset's own past returns in predicting its future returns. This is distinct from the more commonly referred to "cross-sectional momentum", which relies on comparing the performance of one asset to another. Time series momentum is about the trend-following based on an individual asset's historical performance.
Example:
Imagine a trader who wants to evaluate the time series momentum of a particular stock—let's call it Stock A. The trader decides to use a 12-month look-back period for this analysis.
1. Stock A's price at the beginning of the 12-month period was 50.
2. Stock A's price at the end of the 12-month period is 75.
Given this information, Stock A has a positive return over the past 12 months.
Now, based on the principle of time series momentum:
If Stock A has shown a positive return over the past 12 months (which it has in our example), a trend-following investor might predict that the stock will continue to generate positive returns in the following period and thus, consider buying the stock.
Conversely, if Stock A had shown a negative return over the past 12 months, the same investor might expect this negative trend to persist and might consider selling or shorting the stock.
The rationale behind this strategy is that assets which have been rising in price over a particular period (e.g., the last 12 months) are more likely to continue rising in the near future, and assets that have been falling are more likely to continue their decline.
It's worth noting that while time series momentum has been empirically observed in various studies and across different asset classes, like all investment strategies, it does not guarantee future returns and comes with its own set of risks.
Relative Momentum
Relative momentum, often just called "momentum" in the context of investing, refers to a strategy that compares the performance of different assets to each other in order to make investment decisions. This strategy is based on the idea that assets which have performed well in the recent past, relative to other assets, will continue to perform well, and vice versa.
Here's a breakdown:
Comparison Base: Unlike time series momentum, which looks at an asset's past performance in isolation, relative momentum compares the performance of one asset to another or to a broader market index.
Period of Measurement: The performance of assets is typically measured over a predetermined look-back period. This can be anywhere from a few months to several years.
Ranking: At the end of the look-back period, assets are ranked based on their performance. The top-performing assets are considered to have positive momentum, while the lower-performing ones have negative momentum.
Example:
Suppose an investor is considering two stocks: Stock A and Stock B.
Over the past 12 months, Stock A has returned 15%, while Stock B has returned 5%.
If the investor is following a relative momentum strategy, they would favor Stock A for investment because it has demonstrated stronger momentum compared to Stock B over the specified period.
In a broader application, investors might rank multiple assets or stocks and invest in the top performers, often adjusting their portfolio periodically to account for changes in momentum rankings
Dual Momentum
Dual momentum is an investment strategy that combines the principles of both relative momentum and absolute (or time-series) momentum to inform buying and selling decisions. The idea is to rotate into assets showing both strong relative and absolute performance, thus maximizing the chances of investing in assets that are in strong uptrends while avoiding or mitigating major drawdowns during bear markets.
Example:
Assuming an investor is comparing two assets – Stocks and Bonds:
Over the past 12 months, stocks have returned 10%, while bonds have returned 4%. Based on relative momentum, stocks are the preferred choice.
However, for absolute momentum, the investor checks if the stock market's recent return is positive when compared to a historical average or a risk-free rate. If stocks have had a negative return over a shorter timeframe, despite their 12-month performance, the investor might consider moving to a safer asset or cash position.
By combining both relative and absolute momentum, the dual momentum strategy aims to capture the gains of major uptrends in assets while avoiding severe drawdowns or losses during downtrends. Like all strategies, dual momentum is not foolproof and requires disciplined execution and an understanding of its limitations.
Other Momentum Investing Indicators
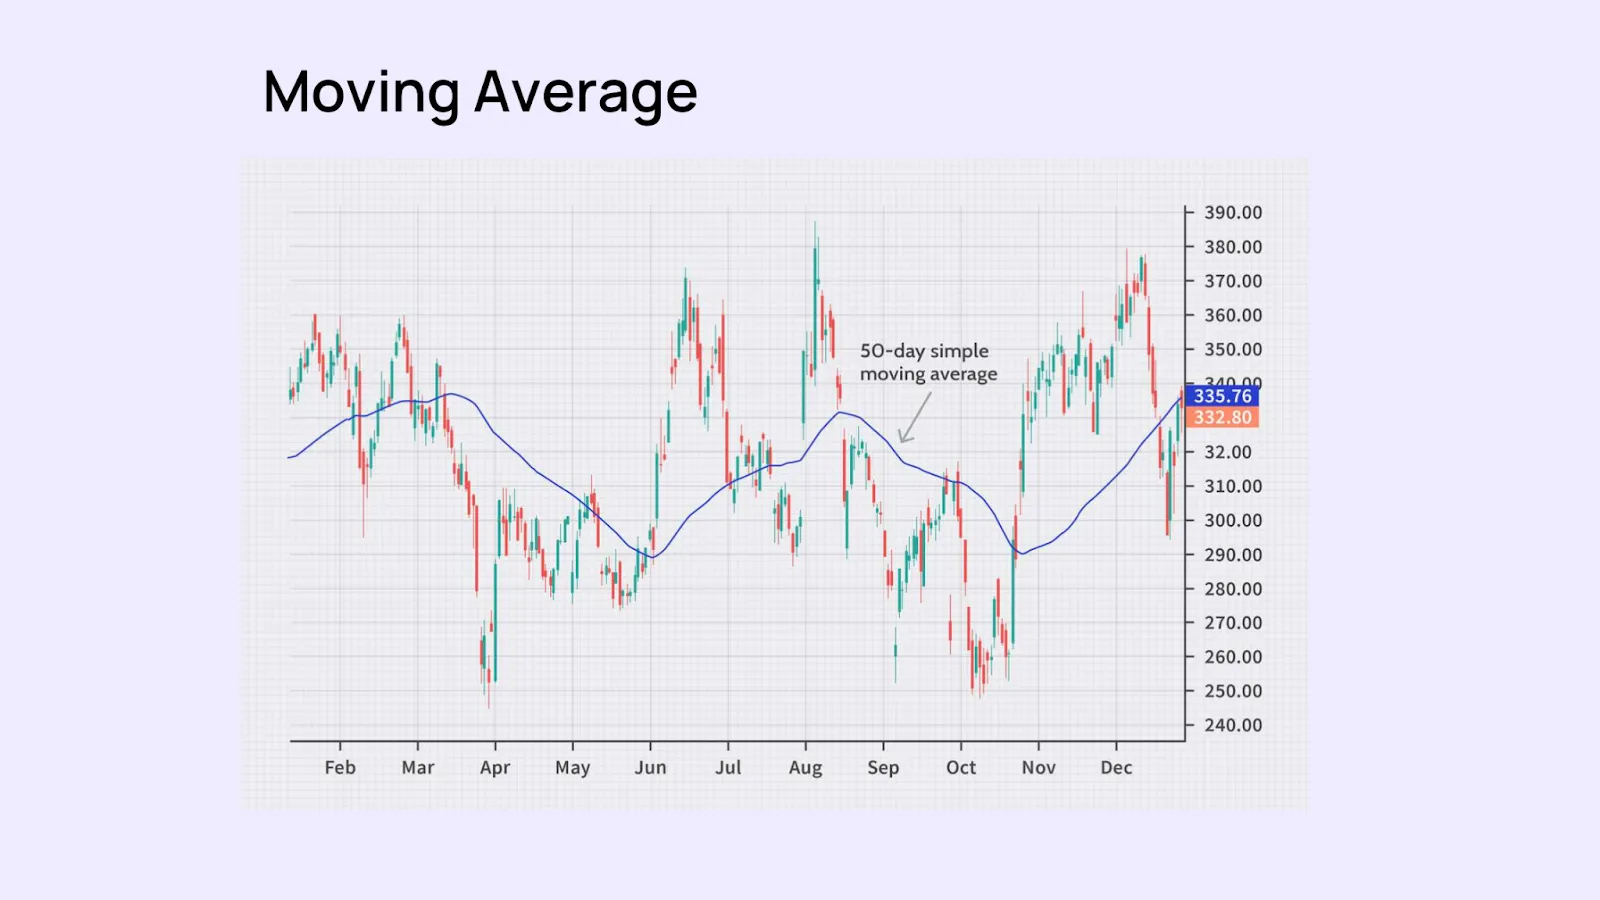
1. Moving Averages
A moving average strategy is one of the most widely used tools in momentum investing. It smoothens price data, creating a single flowing line, which makes it easier to identify the direction of the trend. The two most common types are:
- Simple Moving Average (SMA): This is the average stock price over a specific period. For instance, a 50-day SMA will average out the closing prices for the last 50 days.
- Exponential Moving Average (EMA): This gives more weight to the latest prices, and therefore reacts more quickly to price changes than the SMA.
When the stock price is above its moving average, it signifies bullish momentum, and vice versa.
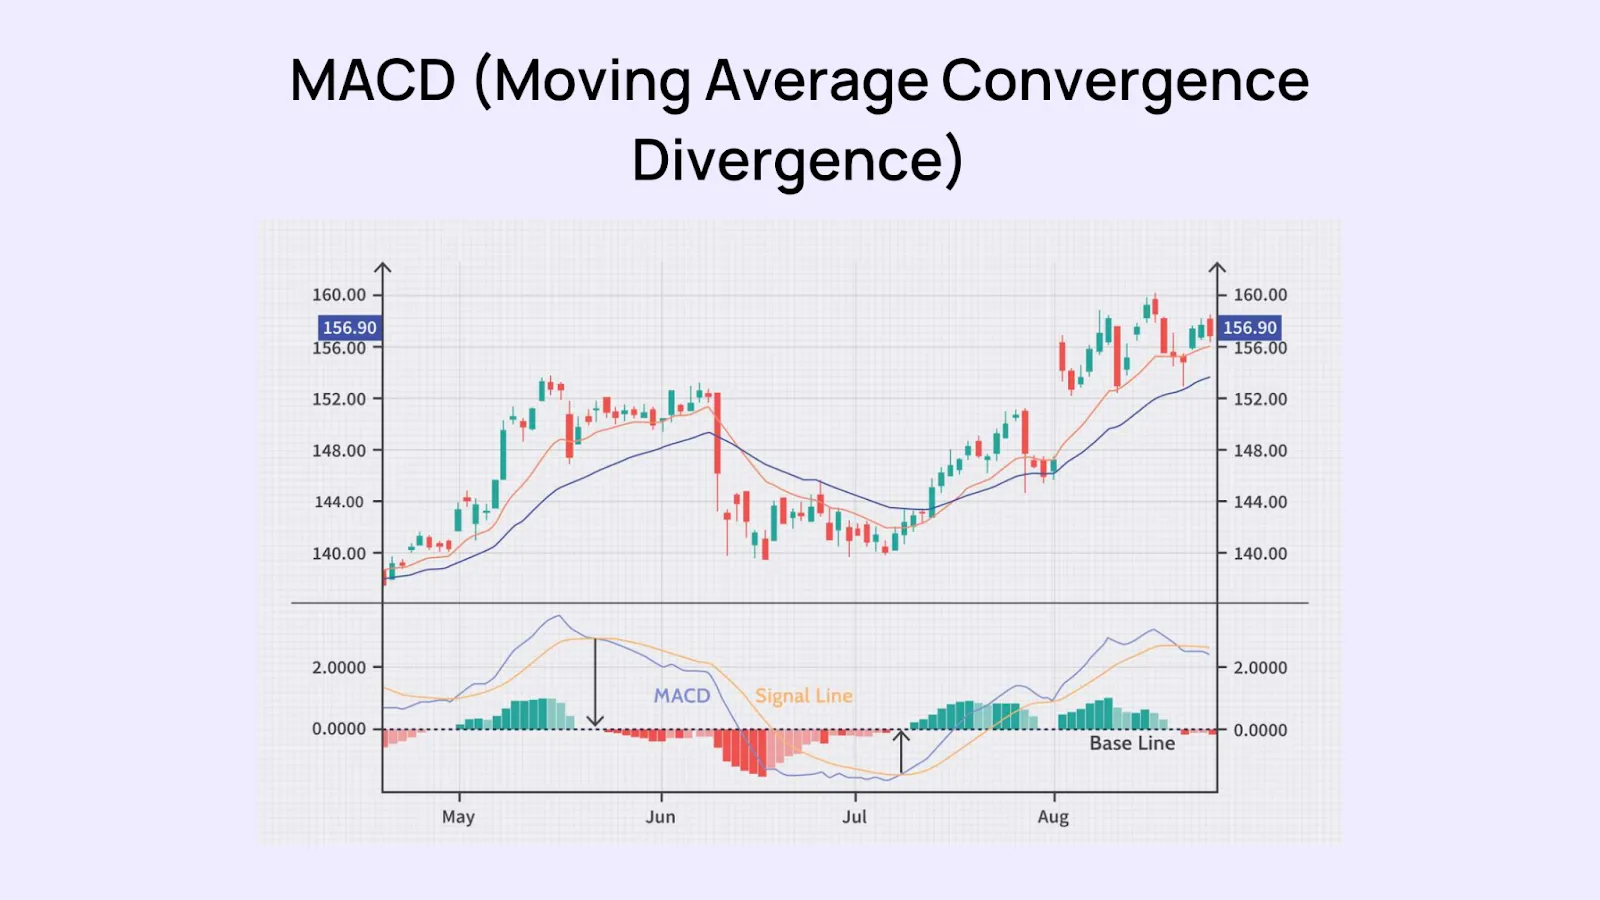
2. Moving Average Convergence Divergence (MACD)
The MACD is a trend-following momentum indicator that shows the relationship between two EMAs of a security’s price. The MACD is calculated by subtracting the 26-period EMA from the 12-period EMA. The result of that calculation is the MACD line. A nine-day EMA of the MACD, called the "signal line," is then plotted on top of the MACD line, which can function as a trigger for buy and sell signals.
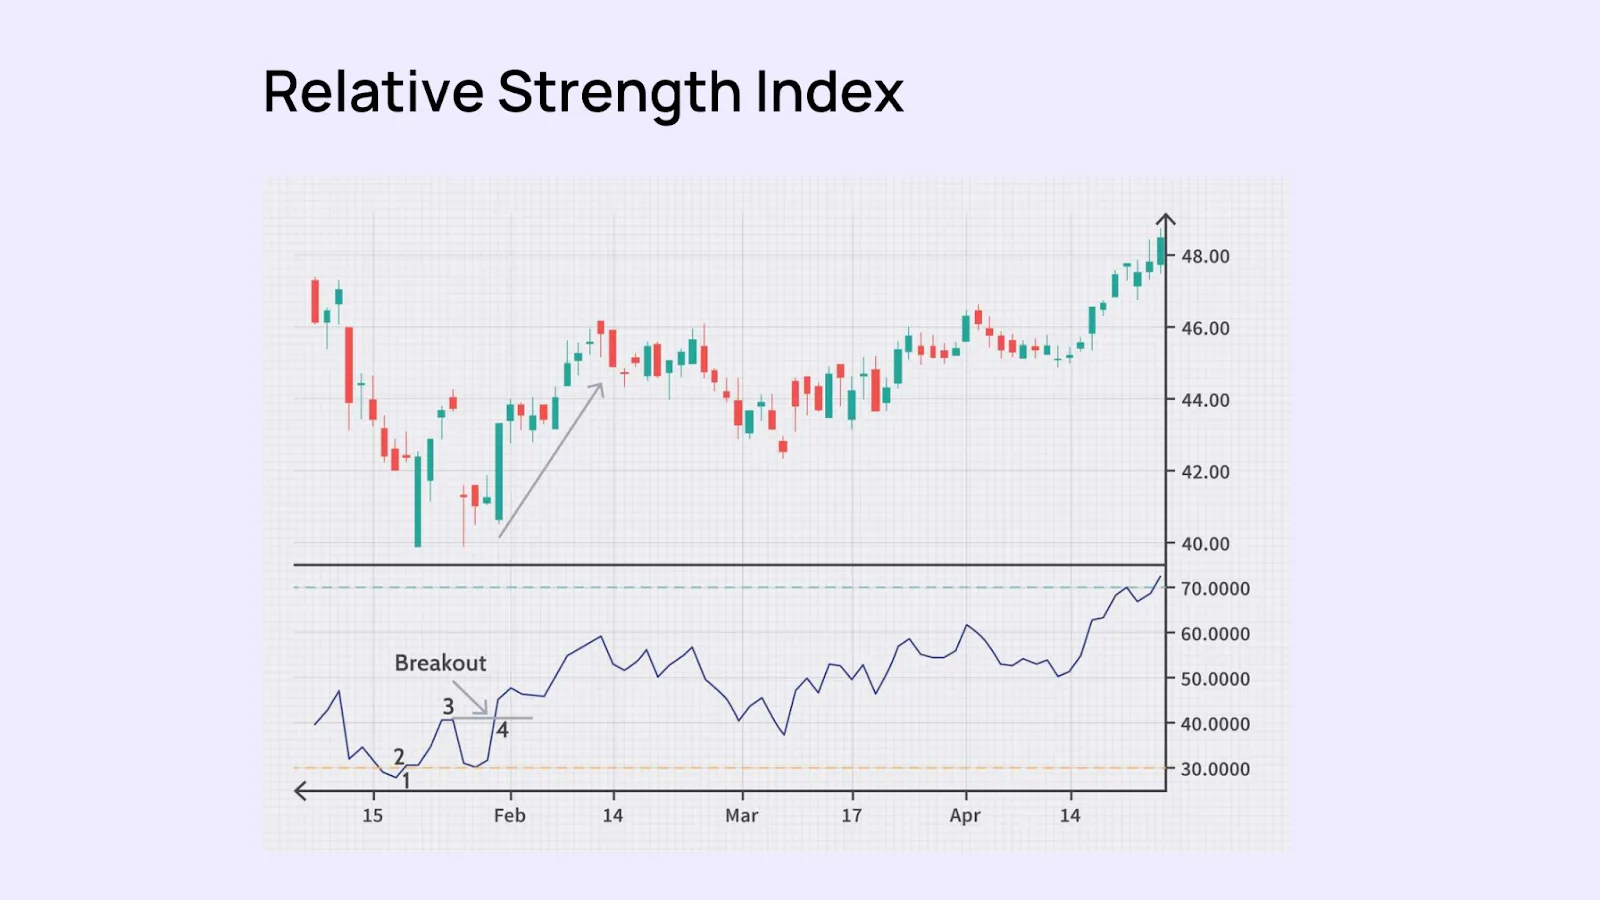
3. Relative Strength Index (RSI)
The RSI measures the speed and change of price movements. It oscillates between zero and 100. Traditionally, and according to its developer J. Welles Wilder, RSI is considered overbought when above 70 and oversold when below 30. If the RSI is above 70, it may indicate that the stock is overbought and could be primed for a trend reversal or corrective price pullback. If it’s below 30, the stock may be oversold and might be a good buying opportunity.
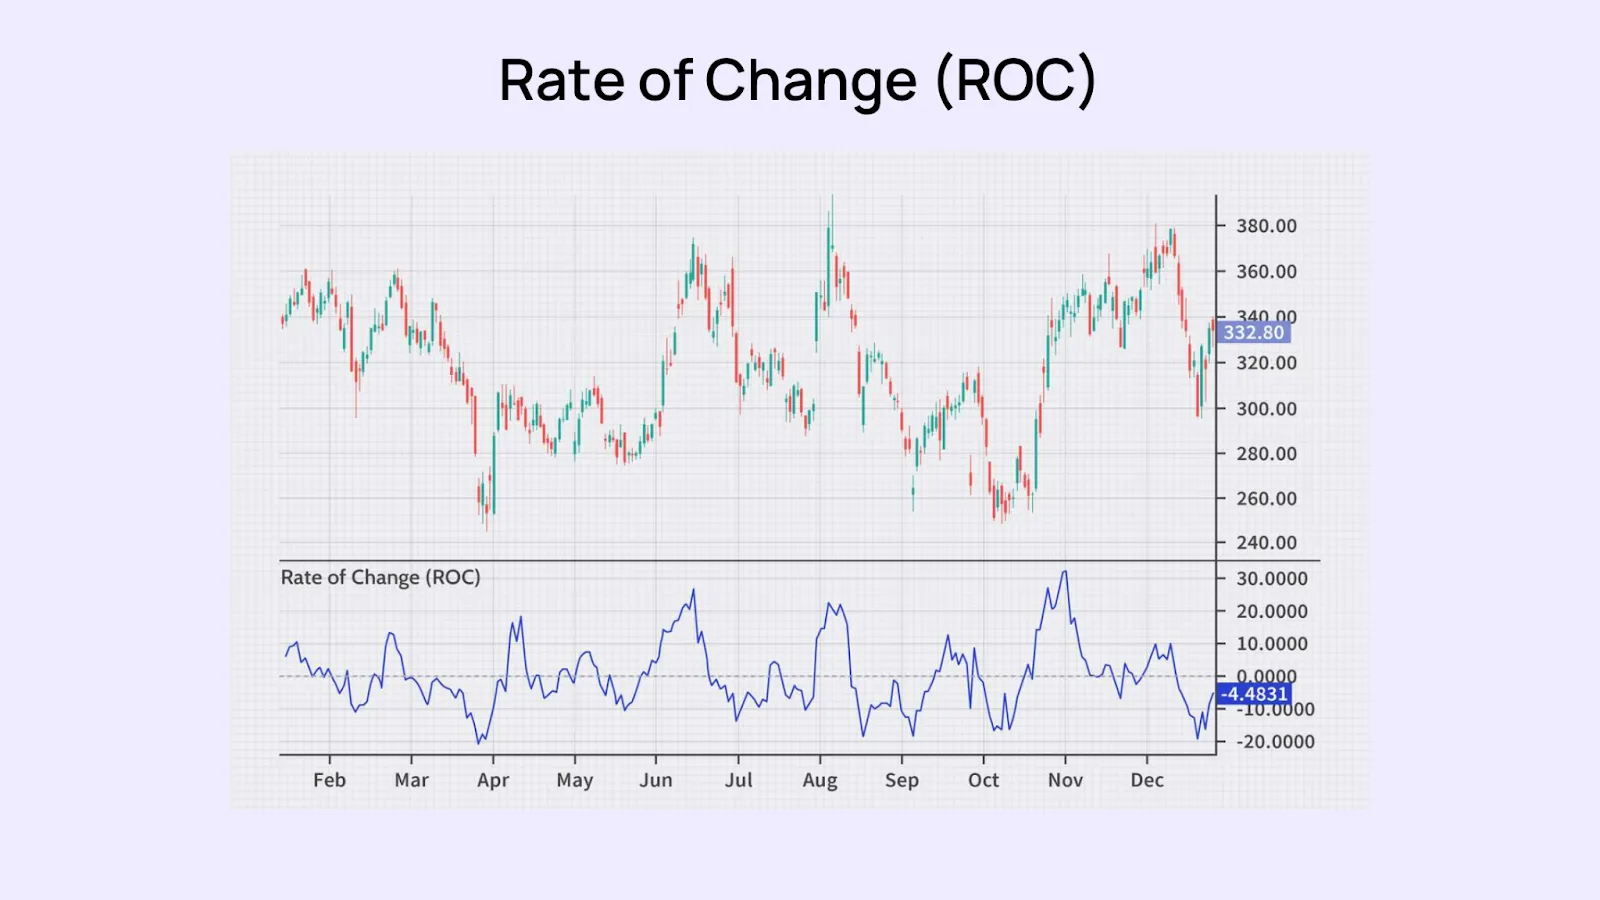
4. Rate of Change (ROC)
The ROC calculates the percentage change between the most recent price and the price "n" periods ago. This indicator gives investors a sense of how quickly a stock's price is accelerating or decelerating. If the ROC is rising, it indicates bullish momentum, while a falling ROC may signify bearish momentum.
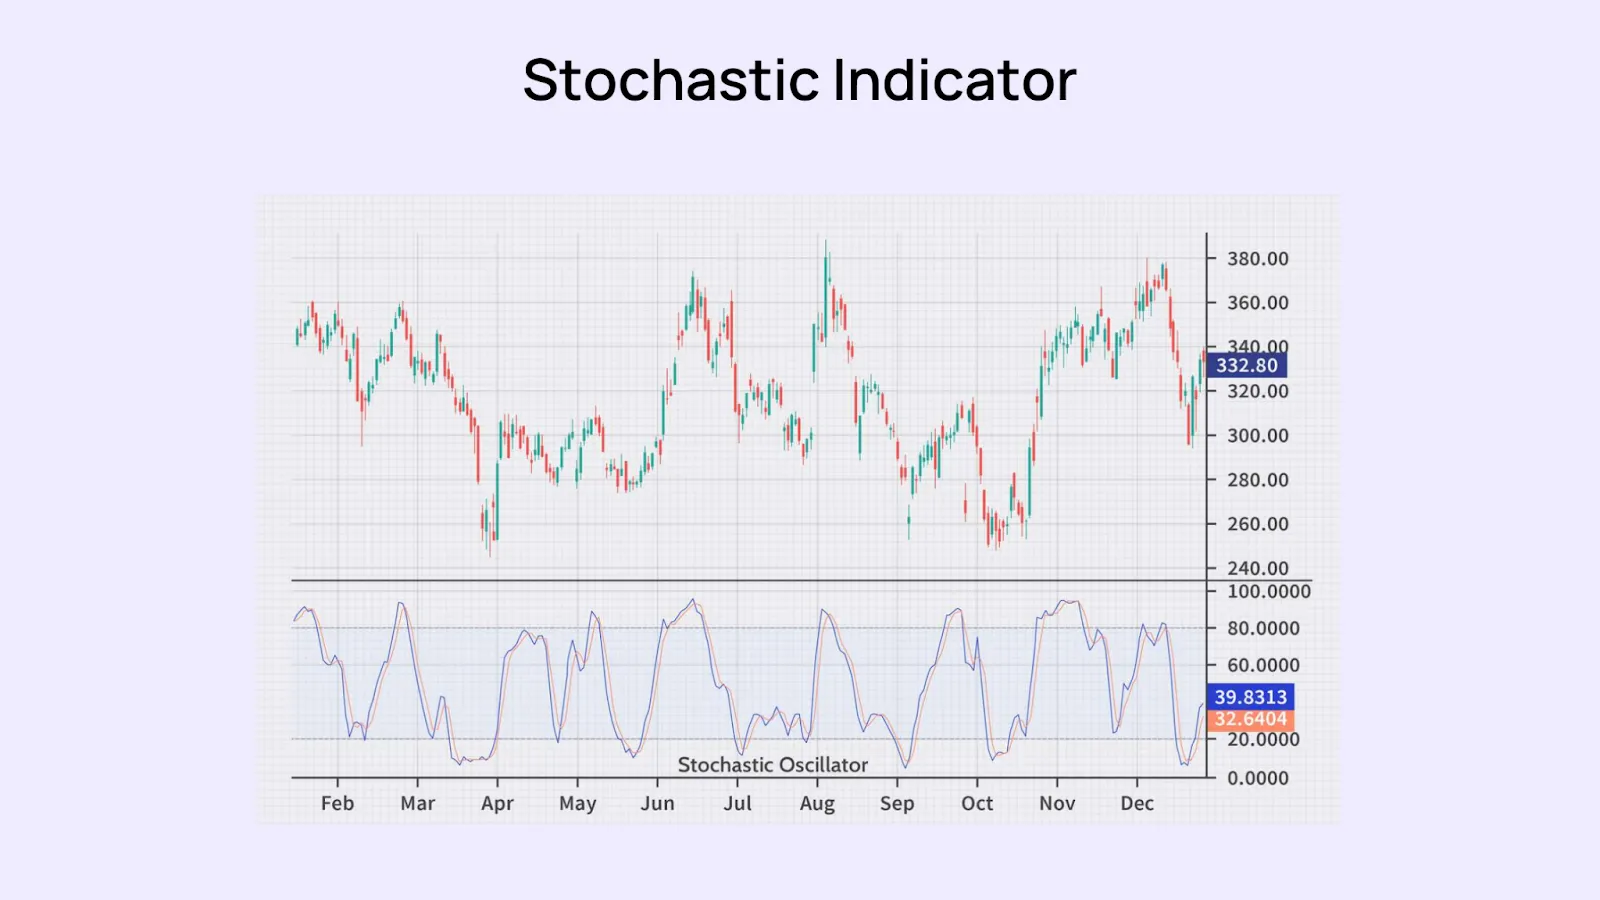
5. Stochastic Oscillator
This is a momentum indicator that compares a particular closing price of a security to a range of its prices over a certain period of time. The oscillator's sensitivity to market movements can be adjusted by changing the time period or by taking a moving average of the result. A reading above 80 is typically considered overbought, while a reading below 20 is considered oversold.
Conclusion
Momentum investing, while powerful, requires a keen eye for the right indicators. It's crucial to not just rely on one but to combine multiple indicators for a holistic view of the market's direction. Whether you're inclined towards the simplicity of relative strength, the clarity of absolute momentum, or the combined insight of dual momentum, the key lies in consistent application and periodic review of your chosen strategies.
Do check out our Momentum and Alpha Prime portfolios which are based on Momentum Investing to know more.
Remember, while momentum can give you an edge, it's essential to complement it with thorough research and a well-thought-out risk management plan. Happy investing!
Check out this interesting article on Unleashing the Power of Momentum: Factors to Consider before Investing in Small Caps
About the author

Our Investment Philosophy
Learn how we choose the right asset mix for your risk profile across all market conditions.
Subscribe to our Newsletter
Get weekly market insights and facts right in your inbox