As we navigate the labyrinth of financial markets, it often involves interpreting diverse signals, trends and noise. 2 key trends are standing out right now - the uptrend in small-cap stocks and the power of momentum investing. In this analysis, we delve into the factors fueling this trend, closely examining portfolio performances, exploring the myriad opportunities small-cap stocks offer, and taking a meticulous look at sector and industry trends. Coupling these factors with earnings previews, we aim to paint a comprehensive picture of the market dynamics at play. We will start with looking at a few of our portfolios to see if we can identify these trends.
The Growing Strength of Momentum – A Market Trend Unfolding
When we examine our two portfolios - the Momentum portfolio and the Balanced Factor portfolio - an intriguing narrative begins to emerge. Across various time frames, they have consistently outperformed their benchmarks, hinting at a potent momentum trend. Let’s explore our Momentum & Balanced Multifactor portfolios to see if we can identify this trend further.
Portfolio Performance - Balanced
The Balanced portfolio has remained a stalwart performer in a diverse market landscape, consistently outshining both the Large Cap and Multi Cap indexes. Over the past month, the Balanced portfolio recorded a robust return of 9.2%, clearly outpacing the Large Cap Index's return of 3.5% and the Multi Cap Index's return of 4.9%.
MTD | 1-mth | 3-mth | 6-mth | |
Balanced | 8.2% | 9.2% | 22.0% | 17.1% |
Multi Cap Index | 2.5% | 4.9% | 15.0% | 9.3% |
Large Cap Index | 2.0% | 3.5% | 10.5% | 6.0% |
The story of outperformance is further underscored as we expand our view to the past three months. During this period, the Balanced portfolio returned a staggering 22.0%, a significantly higher return than the 15.0% posted by the Multi Cap Index and the 10.5% recorded by the Large Cap Index.
Over a six-month horizon, the Balanced portfolio continued its strong performance with a return of 17.1%, markedly ahead of the 9.3% and 6.0% returns of the Multi Cap and Large Cap Indexes respectively. This trend is reflective of the Balanced strategy's objective - to maintain a diversified portfolio that balances growth and value stocks, thereby offering consistent returns across varying market conditions.
Here's a Complete guide to Factor Investing & Wright Balanced Multifactor Portfolio.
Portfolio Performance - Momentum
In the momentum-laden current market environment, the Momentum portfolio has emerged as a strong contender, notably outpacing its benchmarks, the Multi Cap and Large Cap Indexes. Over the past month, the Momentum portfolio yielded a return of 7.7%, decisively outperforming the Large Cap Index's return of 3.5% and the Multi Cap Index's return of 4.9%. This robust performance signifies the portfolio's ability to ride the momentum in upward market trends effectively.
MTD | 1-mth | 3-mth | 6-mth | |
Momentum | 7.0% | 7.7% | 20.9% | 13.7% |
Multi Cap Index | 2.5% | 4.9% | 15.0% | 9.3% |
Large Cap Index | 2.0% | 3.5% | 10.5% | 6.0% |
As we extend the timeline to a three-month period, the Momentum portfolio's impressive performance persists. During this period, it returned 20.9%, dwarfing the 15.0% and 10.5% returns of the Multi Cap and Large Cap Indexes respectively. Over the past six months, the Momentum portfolio sustained its superior performance, returning 13.7% against the 9.3% and 6.0% posted by the Multi Cap and Large Cap Indexes respectively. This trend corroborates the Momentum strategy's inherent ability to capitalize on positive market trends, leading to substantial returns.
The combination of the Momentum portfolio's robust short-term gains and the Balanced portfolio's steady long-term performance provides investors with unique opportunities. Both portfolios have demonstrated their ability to navigate a range of market conditions, underlining the importance of strategic asset allocation and astute investment selection in achieving optimal portfolio performance.
Here's a Complete guide to Momentum Investing & the Wright Momentum Portfolio.
A Deeper Dive into the Momentum Trend
Peering further into the performance of both portfolios, it's clear that the Momentum portfolio is riding high on this wave of market trends. Over the past year, it has delivered an impressive return of 35.6% and a year-to-date (YTD) return of 6.2%, which notably surpasses the Multicap Index's modest return of 0.4%. This is especially significant when we consider the market volatility due to the US banking crisis, the macroeconomic headwinds, inflation and rate hike related concerns during the period.
1-mth | 3-mth | 6-mth | 1-yr | YTD | Inception | |
Momentum | 7.7% | 20.9% | 13.7% | 35.6% | 6.2% | 44.9% |
Multicap | 5.9% | 19.0% | 13.5% | 35.2% | 0.4% | 28.7% |
Since its inception, the Momentum portfolio has delivered an impressive 44.9%, significantly outperforming the Multicap Index’s return of 28.7%. The Momentum portfolio, owing to its inherent focus on stocks displaying a strong upward trend, has put forth an impressive performance, consistently outshining the Multicap Index.

Over a 10 year horizon when we look at backtested data, the Momentum portfolio has demonstrated a strong upward trajectory with an annualized return of 32.3%, substantially higher than the Multicap Index's 13.88%. This showcases the long-term growth potential of the Momentum portfolio.
10 years | Momentum | Multicap |
Annualized Returns | 32.3% | 13.88% |
Annualized Volatility | 18.6% | 16.61% |
Worst Drawdown | -24.6% | -44.75% |
Correlation to NIFTY | 56.0% | - |
Sharpe Ratio | 174.0% | 83.57% |
However, it's important to note that higher returns often come with higher risk. The Momentum portfolio has an annualized volatility of 18.6%, slightly higher than the Multicap Index's 16.61%. Additionally, the Momentum portfolio experienced a worst drawdown of -24.6%, which is considerably less than the Multicap Index's -44.75%. This indicates the Momentum portfolio's better resilience during market downturns. Despite its higher volatility, the Momentum portfolio's risk-adjusted return (as measured by the Sharpe ratio of 174.0%) significantly surpasses that of the Multicap Index (83.57%). This showcases the portfolio's ability to deliver superior returns even when adjusting for the risk taken.
Finally, the Momentum portfolio's correlation to NIFTY is 56.0%, suggesting a moderate positive relationship. It indicates that while the Momentum portfolio generally moves in the same direction as the market, it also has the potential to outperform in certain market conditions.
Why is Momentum Gaining Ground?
Several converging factors have fueled the growing strength of momentum investing.
1. Strong Economic Growth: India's economy is projected to grow by 6.1% in 2023, outpacing many major economies. This growth is driven by potent consumer demand, robust manufacturing output, and flourishing exports.
2. Improved Corporate Earnings: Indian corporations are displaying robust earnings, which are elevating investor confidence and inciting a surge in market investments.
3. Favorable Valuations: Compared to other major markets, Indian stocks offer attractive valuations. This is a magnet for foreign investors who are continuously scouting for lucrative investment opportunities.
4. Positive Global Cues: The optimism surrounding the global economic outlook and a strong global stock market run are boosting investments in emerging markets, including India.
5. Foreign Investment Inflows: Persistent foreign investor interest in Indian stocks is providing sustained market support, further fueling the momentum trend.
Exploring Opportunities in Small Caps
In the realm of small caps, let’s explore our 3 portfolios - Smallcaps , Innovation , and New India. When benchmarked against the Small Cap Index, these portfolios consistently outperform across different time periods.

Portfolio Performance - Smallcaps
The Smallcaps portfolio, inherently more volatile but potentially more rewarding, has been performing admirably, consistently outperforming the Small Cap Index. In the last month, the Smallcaps portfolio has posted a solid return of 9.6%, compared to the Small Cap Index's return of 2.5%. This outperformance is indicative of the portfolio's ability to capitalize on the robust performance of smaller companies.
MTD | 1-mth | 3-mth | 6-mth | |
Smallcaps | 9.6% | 9.4% | 24.3% | 7.0% |
Small Cap Index | 2.5% | 4.9% | 15.0% | 9.3% |
Expanding the horizon to a 3 month period, the Smallcaps portfolio continues to impress with a return of 24.3%, significantly outpacing the 15.0% posted by the Small Cap Index. This sustained outperformance underscores the portfolio's strong resilience and ability to capture upside in a volatile market environment.
Here's a Complete guide to Invest in Smallcap Stocks & in Wright Smallcaps Portfolio.
Portfolio Performance - Innovation
The Innovation portfolio, with its strategic focus on disruptive innovators across sectors such as electric mobility, biotech, ecommerce, digital revolution, and fintech, has shown considerable strength. Over the past month, the Innovation portfolio has yielded a 6.0% return, more than doubling the 2.5% return of the Small Cap Index.
MTD | 1-mth | 3-mth | 6-mth | |
Innovation | 6.0% | 10.4% | 25.0% | 15.2% |
Small Cap Index | 2.5% | 4.9% | 15.0% | 9.3% |
In a 3 month period, the Innovation portfolio’s performance remains robust, returning an impressive 25.0% compared to the 15.0% return of the Small Cap Index. Over a six-month period, the portfolio sustains this outperformance, returning a commendable 15.2%, well above the 9.3% return of the Small Cap Index. This performance attests to the portfolio's ability to identify and invest in innovative firms that are reshaping their respective sectors.
Portfolio Performance - New India
The New India portfolio, designed to align with the Atmanirbhar vision and consisting of stocks set to benefit from robust government policies, has demonstrated impressive performance. Over the past month, the New India portfolio has delivered a return of 5.9%, exceeding the Small Cap Index's return of 2.5%.
MTD | 1-mth | 3-mth | 6-mth | |
New India | 5.9% | 8.8% | 23.2% | 16.1% |
Small Cap Index | 2.5% | 4.9% | 15.0% | 9.3% |
When viewed over a three-month horizon, the portfolio's return of 23.2% substantially outperforms the 15.0% return of the Small Cap Index. Over a six-month period, the portfolio returns 16.1%, dwarfing the 9.3% return of the Small Cap Index. This consistent outperformance is a testament to the New India portfolio's effective strategy of leveraging strong government policies and initiatives.
The Smallcap Surge: What's Driving It?
The recent surge of investing in small-caps in India paints an intriguing investment landscape, propelled by an amalgamation of market forces:
Economic Recovery: The resilience of the Indian economy and small-caps' sensitivity to economic health play significant roles. It is a potent force driving their outperformance. Small-cap stocks, known for their volatility, are also recognized for their capability to yield greater returns during periods of economic recovery.
Attractive Valuations: Post-pandemic, undervalued small-cap stocks have found recognition for their investment potential and substantial growth opportunities. These undervalued entities have subsequently piqued the interest of discerning investors, contributing to the small-cap surge.
Domestic Demand: Small-cap advantage in local-focused sectors, coupled with strong growth in consumer goods, manufacturing, and construction, propels this rally.
Broad Market Rally: Positive market sentiment supports small-cap growth, with investor diversification favoring small-cap stocks.
Favorable Government Policies: Government initiatives supporting SMEs and measures boosting liquidity and easing regulations propel the rise of small-cap stocks.
At the same time, it is equally important to monitor the inflow and outflow pressure on small-cap stocks, as heavy inflows on the back of past performance can lead to overvaluation and reduced future returns. It's also essential to keep a close eye on the liquidity of these stocks, given the potential for redemption pressure when the market cycle turns. An examination of valuations is also crucial. While broader market valuations might not indicate that small-cap stocks are expensive, this may not hold true for all individual stocks, especially those with high institutional interest. A prudent approach would be to individually assess the valuations of small-cap stocks to gauge whether it aligns with the portfolio’s objectives and risk tolerance.
Finally, considering the volatility of small-cap stocks, investors should exercise caution, fully understanding that while these may offer potentially higher returns, they also carry significant risks, including liquidity risk in bearish market conditions. Learn more about the top small cap stocks to invest in 2023.
An Aggressive Momentum Investment Strategy
Small-cap stocks and momentum strategies stand out as promising avenues for high returns. Both have shown a solid performance trend, with small-caps benefiting from robust economic recovery, favorable policies, and undervaluation, and momentum stocks capitalizing on current market trends. Wright Research, consistently exploring new avenues to derive value for its investors, is excited to introduce its latest portfolio - Alpha Prime.
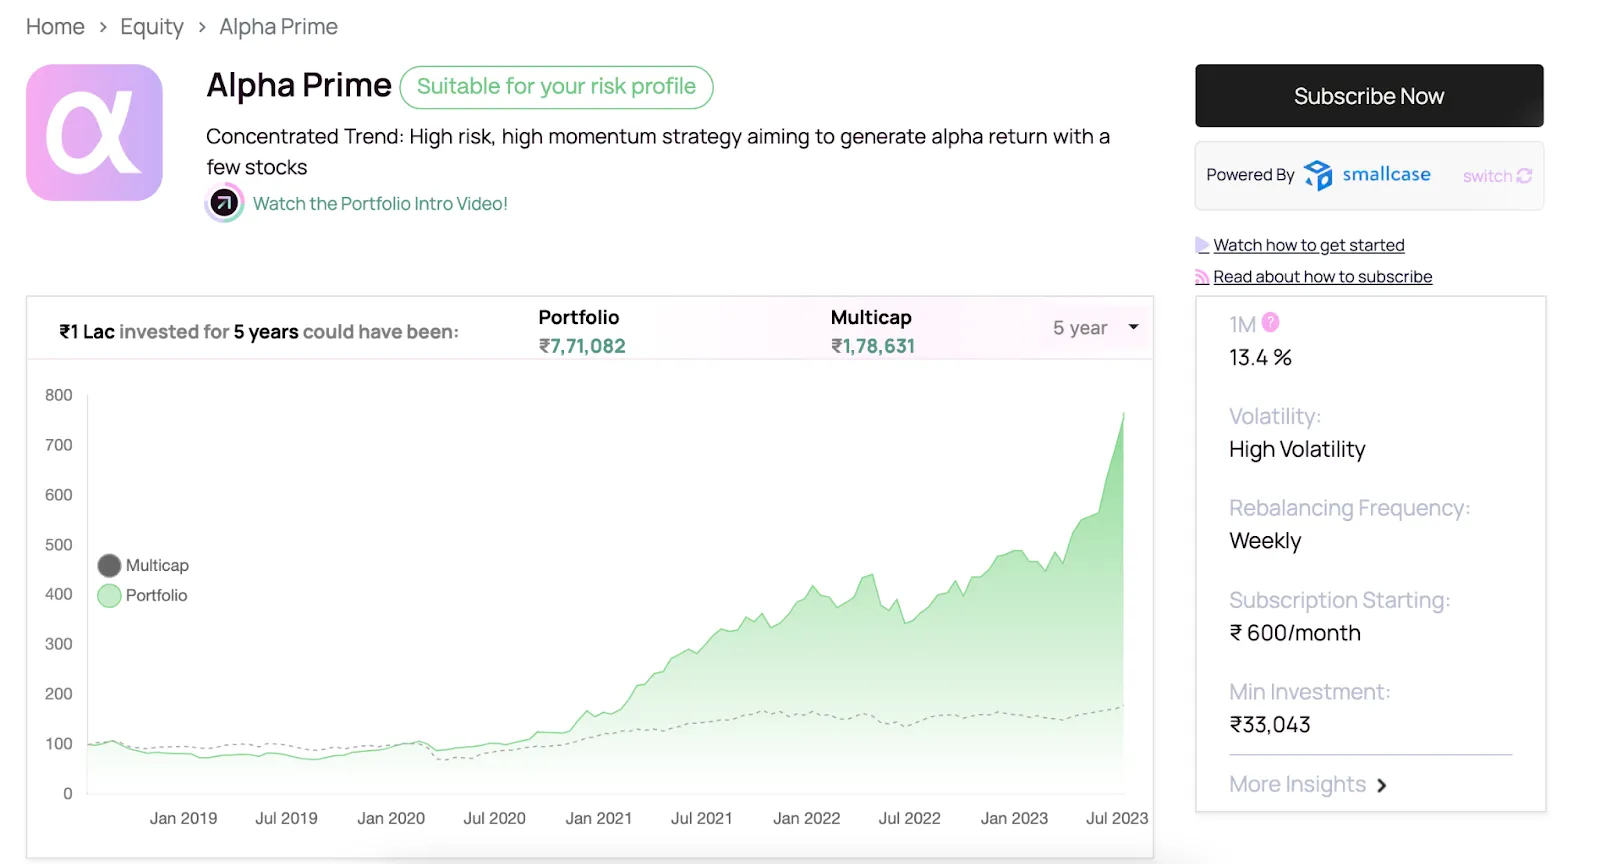
Alpha Prime is an ingenious blend of both worlds. Crafted to leverage the power of concentrated momentum investing, it leans into the high-return potential of quality small-cap stocks, many of which often fly under the mainstream radar but offer incredible growth potential. Utilizing sophisticated AI technology, we identify promising trends and employ aggressive strategies to potentially generate significant alpha returns.
However, with its high-risk, high-return nature, Alpha Prime is best suited for investors with a larger appetite for risk, comfortable with the volatility associated with small-cap and momentum investing. It's an embodiment of our commitment to creating innovative, data-driven investment strategies that cater to diverse investor needs. The journey of investing is as thrilling as the destination, and with Alpha Prime, we aim to make that journey more rewarding. To learn more about our new portfolio read this article Alpha Prime: Unveiling Our New Concentrated Momentum, High-Risk Investment Portfolio
Sector and Industry Analysis: Understanding the Patterns
The market movements are often a reflection of various sectors and industries that shape the economy. Diving deep into the sectoral trends for 2023 and since March 2023, we gain valuable insights.
Sectoral Trends
Automobile and Industrial sectors lead the charge in 2023 with returns of 19.07% and 18.99% respectively. They demonstrate strong resilience with returns of 21.81% and 20.21% since March 2023, hinting at a robust underlying momentum. The Real Estate sector, with a 2023 return of 11.07% and 22.17% since March 2023, also showcases a promising outlook.

On the other hand, sectors such as Textiles, Chemicals, and Utilities faced a downturn in 2023, with returns of -8.13%, -3.11%, and -17.81% respectively. However, these sectors show signs of recovery since March 2023, with positive returns of 1.18%, 4.45%, and 4.98% respectively, reflecting a possible turnaround.
Industry Trends
Industries like Finance, Finance Term Lending Institutions, and Finance Investment Others exhibited robust growth in 2023 with returns of 0.24%, 0.28%, and 0.21% respectively. These industries also reflected strong returns since March 2023, with respective returns of 0.28%, 0.30%, and 0.29%.

Conversely, industries such as Gas Distribution, Pesticides Agrochemicals Indian, and Mining Minerals were sluggish in 2023 with returns of -0.21%, -0.07%, and -0.02% respectively. However, since March 2023, these industries show signs of recovery, indicating possible upcoming opportunities.
Earnings Previews: Factoring in Sectoral and Industry Trends
Automobiles: Given the impressive sectoral trend in the automobile industry, we expect a significant YoY jump in earnings. Growth is likely to be led by frontrunners like Maruti, Bajaj Auto, TVS Motors, and M&M. Anticipated expansion in margins further strengthens the outlook.
BFSI: Reflecting the healthy growth in the finance sector, we expect a promising start to FY24 earnings. Private banks are likely to report a PPoP growth of around 31% YoY and a PAT growth of approximately 32% YoY in 1QFY24.
Chemical Specialty: The underperformance in the chemical sector paints a subdued quarter due to demand woes.
Consumer: Aligning with the positive FMCG sector trend, we see an improvement in demand momentum with expected Sales/EBITDA/PAT growth of 9%/18%/19% YoY.
Healthcare: The upward trend in the healthcare sector points towards sustained YoY earnings growth from US generics. We expect Sales/EBITDA/PAT growth of 14%/19%/13% YoY in 1QFY24.
Technology: Despite the healthy return in the technology sector, deteriorating macro and wage hikes are expected to impact earnings.
Telecom: As suggested by the positive return trend in the communication sector, we anticipate an uptick in revenue growth with elevated capex.
Oil & Gas: The strong performance in the energy sector sets the stage for robust marketing margins and a decline in refining margins QoQ.
Real Estate: In line with the strong return in the real estate sector, we anticipate a steady start to the year with Bengaluru leading the show.
Retail: Despite the strong returns in the consumer discretionary sector, a subdued demand environment persists in the retail industry.
Metals:Despite the healthy return in the metals sector, a weak macroeconomic scenario and slowdown in China are expected to drag the sector.
Infrastructure: Despite the robust growth in the industrials sector, the infrastructure industry is expected to see a slow execution despite a healthy order book.
Logistics: Stable economic activity in 1QFY24 is expected, with margins improving QoQ, aligning with the positive trend in the industrials sector.
Non Lending: With the mixed-bag return trend across finance sectors, we expect a similar outcome for the non-lending industry in the quarter.
Cement: Higher volumes are expected to underpin profit growth; EBITDA/t is expected to dip YoY, reflecting the slightly positive return trend in the cement sector.
What to expect from Momentum & Smallcaps going forward?
So, what should we expect going forward, particularly for momentum and small-cap stocks?
Momentum Stocks: The outlook remains positive, fueled by robust economic indicators and promising corporate earnings. However, we cannot ignore potential risks. Factors like rising interest rates and geopolitical uncertainties could disrupt the momentum. Hence, a vigilant eye for signs of reversal is a prudent approach for investors in this realm.
Smallcap Stocks: The potential for high returns persists, thanks to the ongoing economic recovery, the undervaluation of some stocks, and the prevalence of favorable policies. But, like all sectors, small-caps aren't immune to risks. They are inherently prone to higher volatility and liquidity risks and can be more sensitive to adverse market events. Additionally, the wave of profit booking post the recent rally could impact small-cap performance.
To summarize, the financial markets are ever-evolving, and successful navigation requires both understanding the current trends and anticipating future ones. Whether it's the promising outlook of momentum stocks or the potential high returns of small caps, the opportunity for robust returns exists. However, equally important is recognizing the risks and adjusting investment strategies accordingly. With careful analysis and strategic investment decisions, the dynamic world of momentum and small-cap stocks can prove to be rewarding.
Explore the Wright Alpha Prime Portfolio. To invest in Alpha Prime , use discount code ALPHA25.
About the author

Our Investment Philosophy
Learn how we choose the right asset mix for your risk profile across all market conditions.
Subscribe to our Newsletter
Get weekly market insights and facts right in your inbox