

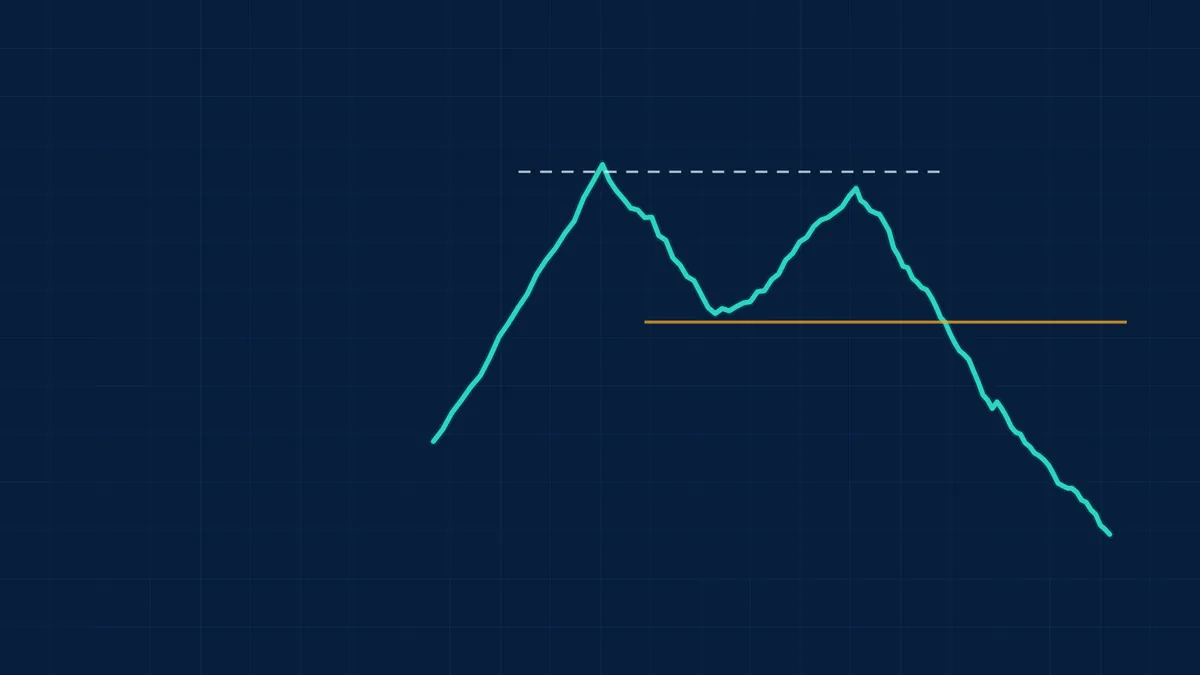
A double top is a reversal pattern in which price rises to a level, falls back, rises to about the same level again and fails. It looks like the letter M. A double bottom is the mirror image, like a W, after a downtrend.
How to recognise it
- Double top: two peaks at about the same height with a trough between them, after an uptrend.
- Double bottom: two troughs at about the same level with a peak between them, after a downtrend.
- The pattern is confirmed when price breaks the middle trough (top) or the middle peak (bottom).
- Peaks or troughs within 1% to 3% of each other are usually accepted, and the pattern usually forms over several weeks.
See what markets are pricing in
Live indices, sector moves and market breadth — the backdrop to every story we publish.
A worked example
Double top: peaks at 110 and 109, trough in between at 100. The prices are illustrative.
| Item | Calculation | Result |
|---|---|---|
| Pattern height | 110 - 100 | 10 |
| Confirmation | Close below 100 | |
| Measured target | 100 - 10 | 90 |
| Double bottom (mirror): troughs at 90, peak at 100 | Target 100 + 10 | 110 |
Get research like this in your inbox
The week’s research that mattered, in five minutes. Joined by 2L+ investors.
How traders read it
- The failure at the same level twice shows that buyers (top) or sellers (bottom) could not push through.
- Volume is often lower on the second peak of a top, which shows weakening demand.
- A stop is often placed just beyond the second peak or trough.
Limits to keep in mind
- Patterns are judgement calls. Two traders can draw the same chart differently, so results depend on how strictly the rules are applied.
- False breakouts happen. Many traders wait for a close beyond the level, ideally with higher volume , before acting. See breakout pattern.
- Sideways ranges can look like double tops. A third test often follows, which makes it a triple top or part of a range.
- Targets are estimates, not guarantees. Limit risk with a stop-loss.
- Evidence is mixed. Studies of chart patterns have found modest and inconsistent predictive power. Systematic investors test rules on large samples with costs, as described in backtesting.
See the full chart patterns guide.
Large caps or small caps: who is winning?
Nifty, midcap and smallcap returns from one day to ten years, with the spread and valuation by segment.
Frequently Asked Questions
What is a double top?
An M-shaped reversal pattern in which price fails twice at about the same high, confirmed by a break below the trough between the peaks.
What is a double bottom?
A W-shaped reversal pattern in which price holds twice at about the same low, confirmed by a break above the peak between the troughs.
How do you calculate a double top target?
Subtract the pattern's height (peak minus trough) from the break level.
Is a double top always bearish?
It is a bearish setup only after it is confirmed. Before the trough breaks, price can still rise.
This article is for education only and is not investment advice. Indicator readings describe past price behaviour and do not predict future returns.



