Today we will talk more about quantitative investing strategies - our focus is on momentum investing. So, let’s imagine we already have a set of profitable investment strategies, and we need to combine them. Our goal is to use strategic allocation to get the best risk-adjusted return that is possible for our individual investment strategies and combined together for our investment portfolio. Naturally, there is no correct answer here. We will look at a few ways to understand what happens when we combine different quantitative investing strategies. The question we will look at in depth is whether we can combine similar yet different investing strategies.
But first, let’s get into Momentum investing as we all know by now is based on a simple principle - stock returns exhibit positive autocorrelation over time. This naturally contradicts the efficient market hypothesis since there appears to be predictability in stock returns. What is the efficient market hypothesis? Well it is a well known theoretical finance concept (some may argue it has real world implications too), which says that stock prices reflect all available information. What does this mean? It means it should be impossible for anyone to consistently achieve returns that exceed the average market returns on a risk-adjusted basis. And as we can see in Wright Momentum, and other momentum strategies - all of these capitalize on the continuation of existing market trends, which challenges the efficient market hypothesis.
Now, momentum investing works pretty well in bullish markets. And has become widely adopted by many investors, FIIs, quant funds, mutual funds & others - all of whom use momentum as part of their core strategy for building their investment portfolio. However, a crucial question that we get asked is whether investing in overlapping momentum strategies yield higher returns for investors? Can you actually build a portfolio with multiple momentum investing strategies that overlap one another? And can this actually work to get better risk adjusted returns?
Let’s look at this in depth.
Learn more about What is momentum?
Momentum Investing and Investor Heterogeneity
Investors, limited by their ability to process information, often rely on past data and historical returns to predict future performance. With the advent of AI, machine learning models - few quant funds such as Wright Research are building towards predicting and forecasting how stock markets will move over the next 1 day, 1 week and 1 month. But for a large majority of investors historical return analysis is the starting point of their analysis.
What does this mean?
Real-world investors, contrary to the theoretical investors that form part of economic models, have inherent limitations. We are limited by the amount of information we can process, how to predict future valuations & much more. This investor heterogeneity means that different investors may interpret the same market data differently, leading to a variety of momentum-based strategies in the market. They may even look at a different time period or time horizon to lookback on to assess a stock or a market’s performance.
Why is it important to understand this?
The key to understanding the potential of overlapping momentum strategies lies in this investor heterogeneity. The differing time horizons employed by momentum investors can lead to distinct outcomes in terms of portfolio performance. For example, an investor focusing on a six-month lookback period might identify different 'winning' stocks than one looking at a twelve-month period. This diversity can affect the overall profitability of momentum strategies.
And when there are all these investors taking decisions based on their own analysis and investing in their own momentum strategies this could impact how stock markets move. Significant market players like mutual funds or foreign investors, hedge funds, quant funds, and even a combination of individual investors etc could have some implications that could influence stock price movements. This could potentially lead to market scenarios where trends are both created and amplified by the actions of momentum investors.
Let’s look at some of the research that has been conducted into overlapping momentum portfolios to understand this a little better. We will first focus on well-developed markets first, and then we will jump into emerging markets.
Overlapping Momentum Investing Portfolios In Developed Stock Markets
The latest research in this topic has been conducted by Ivan Blanco, Miguel De Jesus & Alvaro Remesal - “Overlapping Momentum Portfolios”. They analyzed U.S. stocks from 1928 to 2018. And defined an Overlapping Momentum (OMOM) investing strategy, which focuses on stocks that are top performers over both 6-month and 12-month periods, and shorting those that are the weakest over these same periods. This dual-criteria approach aimed to capture a more nuanced view of momentum by considering multiple time frames. And they compared it with traditional momentum (MOM) strategies that typically rely on a single time horizon. They also compare it against Non Overlapping Momentum Strategies (Non-OMOM).
Do Overlapping Momentum Portfolios Beat Other Momentum Strategies?
Here’s the quick summary of how overlapping momentum portfolios performed in their analysis against traditional momentum & non-overlapping momentum portfolios:
MOM (Traditional Momentum) Portfolio: The MOM portfolio, based on past 12-month returns, yielded an average annualized excess return of 7.20%.
Non-OMOM (Non-Overlapping Momentum) Portfolio: The Non-OMOM portfolio’s excess returns averaged at 4.32%.
OMOM (Overlapping Momentum) Portfolio: The OMOM portfolio outperformed both, with an excess return of 10.89%.
Read this article on Momentum Investing: Risk, Reward & Everything Else
Stocks at the intersection of winners-minus-losers portfolios across different formation periods display substantial return momentum. Let’s dive a little deeper to understand what is happening here. And whether it is statistically significant or if it is just randomness or luck.
The excess return of the OMOM portfolio over the MOM portfolio is 3.69% percentage points (pp), and over the Non-OMOM portfolio is 6.57 pp.
These differences are statistically significant at the 1% level i.e. this outperformance is not randomness or luck in their analysis.
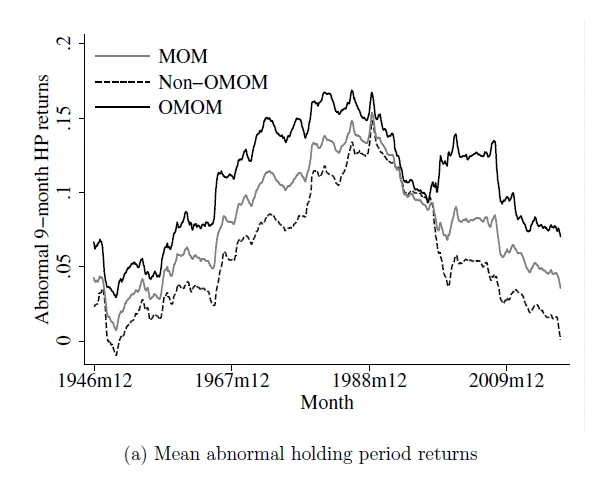
Correlation between MOM and OMOM returns over a 9-month period is high, at 0.88, suggesting a significant overlap in performance patterns.
When adjusted for risk using various asset pricing models (CAPM, 3-factor, and 5-factor models), the OMOM portfolio still maintains higher abnormal returns than both MOM and Non-OMOM portfolios.
Here’s an extract from their analysis that you can look at -
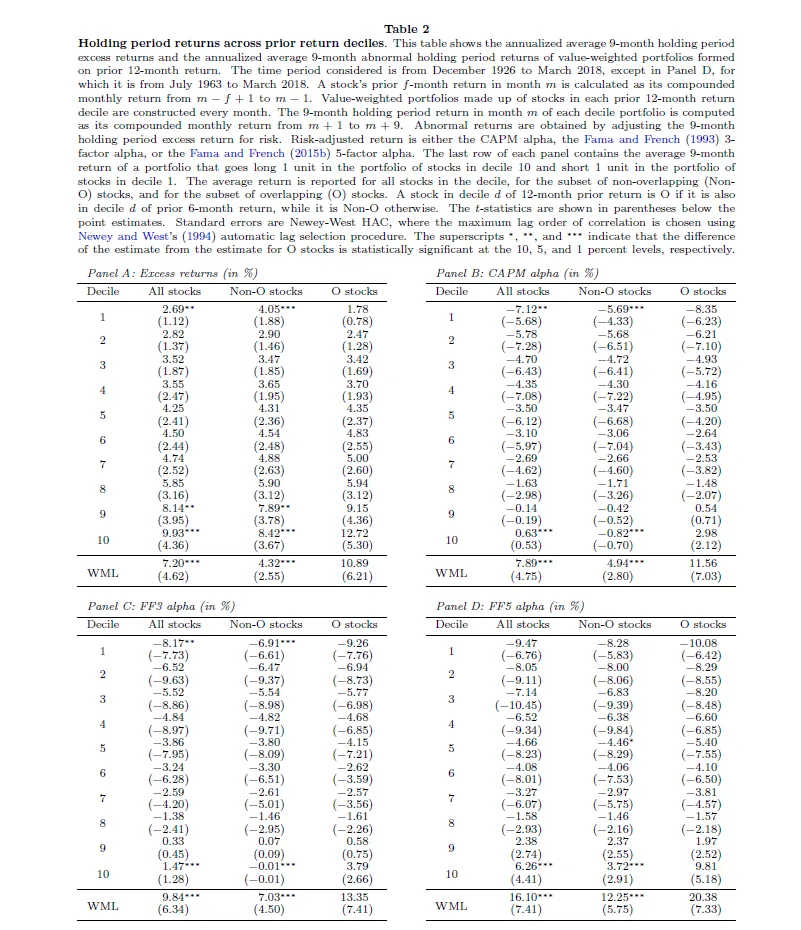
What are the 3 other tables in this image?
CAPM Alpha: OMOM’s CAPM alpha is significantly higher (11.56%) than MOM (7.89%) and Non-OMOM (4.94%).
3-Factor Alpha: The OMOM portfolio also exhibits a higher 3-factor alpha compared to MOM and Non-OMOM portfolios.
5-Factor Alpha: Consistent with the CAPM and 3-factor model, the OMOM portfolio shows improved performance under the 5-factor model.
Did they take higher risk to achieve these higher returns?
The researchers analysed risk measures to determine whether their analysis and findings for getting higher returns is impacted by taking on higher risk. In short, they find the OMOM portfolio doesn’t take higher risk to achieve higher returns and negate the assumption that its higher returns are due to increased market risk.
Here’s a Complete guide to Momentum Investing & the Wright Momentum Portfolio
The portfolio, despite its higher return volatility, achieves a higher annualized Sharpe ratio over medium-term horizons (6 to 12 months) compared to MOM and Non-OMOM portfolios. It also presents lower downside and tail risk.
Return Volatility (Panel A)
The OMOM portfolio has higher annualized standard deviations than the MOM portfolio, suggesting greater volatility across all considered holding periods.
Despite higher volatility, the OMOM portfolio contains momentum stocks with both higher expected returns and higher volatility.
Return Skewness and Kurtosis (Panels B and C)
OMOM portfolio shows less negative skewness for holding periods of one to 12 months compared to the other portfolios, indicating lower downside risk.
The OMOM portfolio has lower return kurtosis, particularly for holding periods of one, 9, 12, and 24 months, suggesting it is less likely to produce extreme returns.
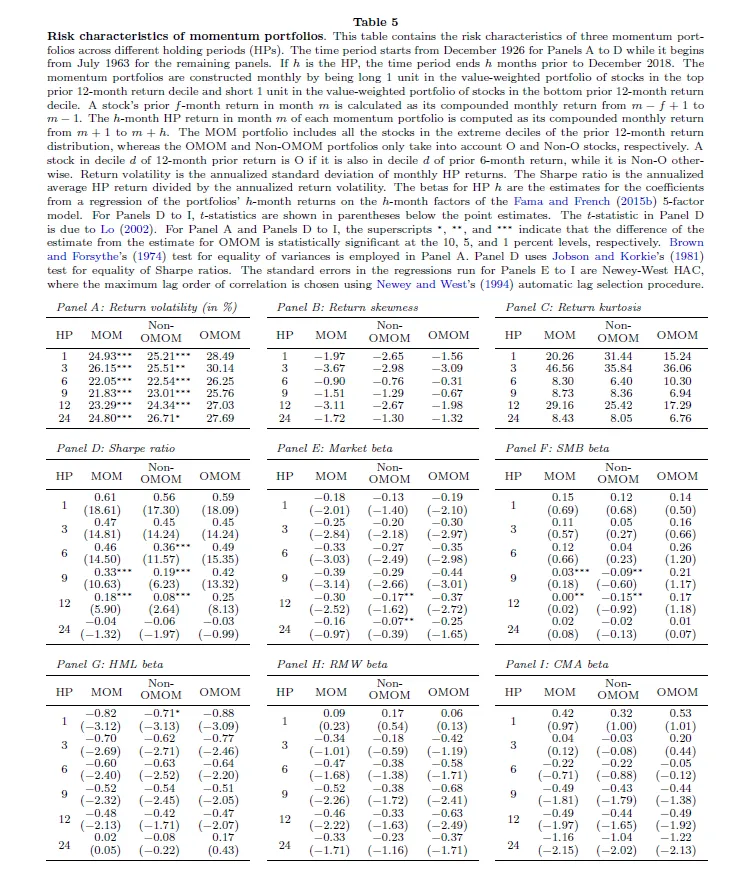
Sharpe Ratio (Panel D)
The OMOM portfolio's Sharpe ratios are higher than those of both the MOM and Non-OMOM portfolios for holding periods ranging from 6 to 24 months.
For 9 and 12-month holding periods, the OMOM portfolio's Sharpe ratio significantly exceeds that of the MOM portfolio at the 1% level, indicating a better risk-return tradeoff.
Market Beta (Panel E)
The OMOM portfolio's market beta is largely similar to the MOM and Non-OMOM portfolios, negating the assumption that its higher returns are due to increased market risk.
For 12 and 24-month holding periods, the OMOM portfolio's market beta is significantly lower than that of the Non-OMOM portfolio, suggesting less exposure to market risk.
Risk Factor Exposures
The OMOM portfolio's exposure to the Fama-French five risk factors is generally lower than or not statistically different from the other portfolios.
The size factor is the exception, where OMOM's loading is significantly higher at 9 and 12-month holding periods, but this does not explain the outperformance, as it persists even after risk-adjusting for the size effect.
Key Findings For Momentum Investors
These insights provide a foundation for understanding the enhanced medium-term performance of OMOM portfolios. The empirical data showing that OMOM strategies outperform standard momentum (MOM) strategies is consistent with the theoretical models used by other researchers and their predictions.
Read this article to understand Why Momentum has worked historically.
What factors don’t explain this outperformance?
The researchers present a robust defense of the Overlapping Momentum (OMOM) investing strategy's outperformance, ruling out alternative explanations and reinforcing the argument that the strategy's success is due to the intrinsic benefits of selecting overlapping stocks. Let’s look at a few of these:
1. Stock Characteristics
Outperformance isn't solely due to differences in stock characteristics between overlapping and non-overlapping stocks.
This was confirmed through regressions controlling for various stock characteristics.
This suggests that the OMOM strategy's effectiveness isn't merely a product of selecting stocks with more pronounced past performance extremes.
2. Transaction Costs
Although the OMOM portfolio incurs higher transaction costs, these costs do not adequately account for its higher medium-term returns.
This implies that the OMOM strategy's superior performance can't be dismissed as simply a compensation for higher transaction costs.
3. Seasonal Effects
The findings are robust against seasonal biases and are consistent across various time periods, indicating that the outperformance is not a result of time-specific anomalies or seasonal trading patterns.
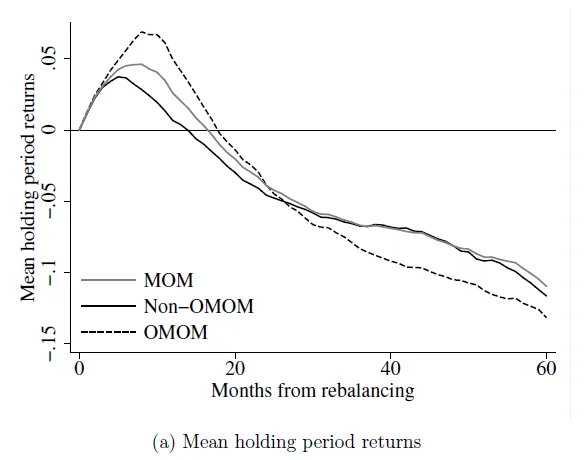
Price Overreaction and Reversal
The model predicts that the presence of momentum traders with different formation periods leads to more significant price overreactions to new information about an asset’s fundamentals. This overreaction is eventually corrected, leading to price reversals. This theoretical result aligns with the empirical finding that OMOM portfolios exhibit higher momentum followed by reversals.
Due to the absence of cross-awareness among momentum traders, both 6-month and 12-month traders engage in aggressive trading that amplifies the momentum effect. This collective behavior exacerbates both the initial momentum and the subsequent price reversals.
Impact of Bounded Rationality
Momentum traders are characterized by bounded rationality, meaning they have a limited ability to process all relevant information. This limitation is evident in their tendency to interpret price changes primarily as the result of informed trading rather than the influence of other momentum traders.
An alternative scenario, where momentum traders are aware of each other’s presence, results in weaker momentum effects. In this scenario, 12-month traders would be more cautious in their trading, knowing that 6-month traders are reacting to more recent information and could potentially capitalize on their slower response.
Heterogeneous Momentum Traders
The introduction of two distinct types of momentum traders (12-month and 6-month formation periods) in the model helps explain the observed empirical phenomenon where stocks with strong past performance over multiple time frames (OMOM stocks) have more pronounced momentum.
A key aspect of the model is that momentum traders do not recognize the existence of other traders employing different strategies. Each group of momentum traders acts as if they are the only ones pursuing a momentum strategy, which leads to a more aggressive trend-chasing behavior.
Institutional Momentum Demand
One of the driving factors behind OMOM's success is attributed to the high institutional momentum demand for stocks that are winners in both 6 and 12-month periods.
Portfolios comprising stocks with high institutional momentum demand over these periods yield greater abnormal returns than those focusing solely on 12-month demand.
The researchers posit that overlapping winners, which are likely to continue seeing high demand from institutions operating over different time horizons, are a key reason for the OMOM portfolio’s outperformance.
Learn whether Your Investment is Generating Alpha?
Combining Momentum Strategies With Volatility In Emerging Markets - Can It Give Better Returns?
In a research conducted by Graham Bornholt & Mirela Malin for Finsia Journal of Applied Finance, they looked at combining momentum strategies with volatility to determine if portfolio of emerging market stocks’ returns can be improved. Let's look at this a bit more in depth.
Comparing Profitability of Momentum + Volatility against a traditional Momentum strategy
The results imply that volatility can be a valuable factor in momentum strategies, offering potentially higher returns. Especially in emerging markets, where volatility and returns may be more pronounced, the momentum/volatility strategy appears to be significantly advantageous.
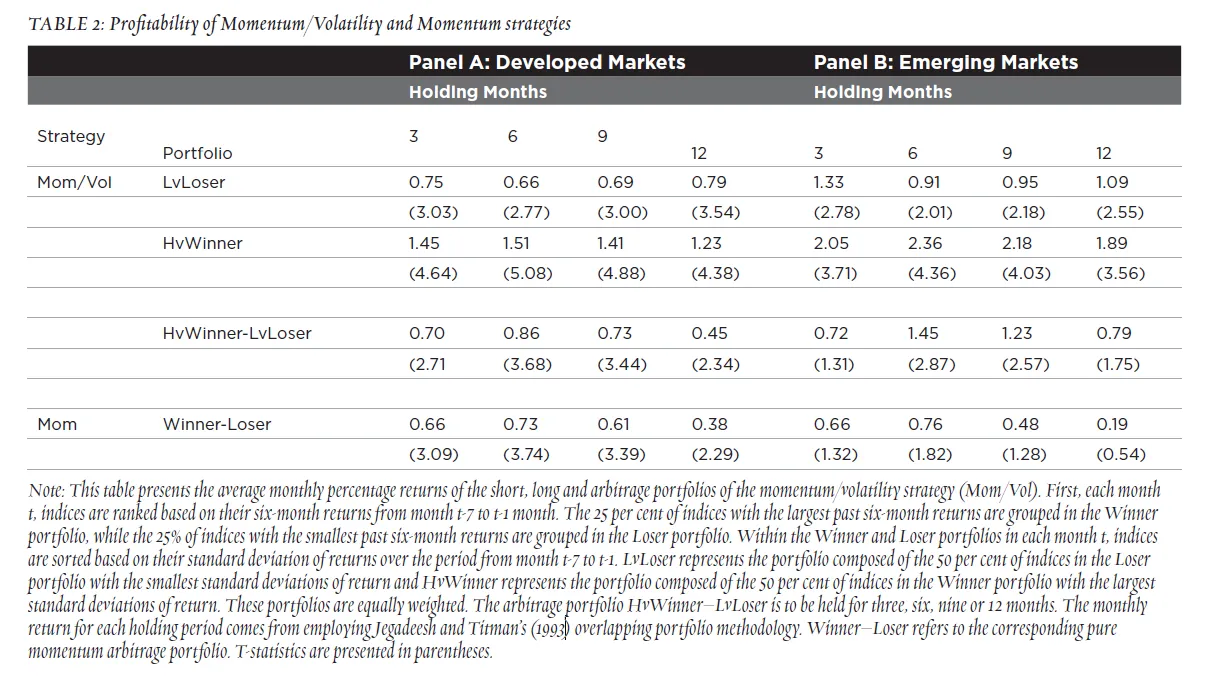
The momentum/volatility strategy, which involves buying high-volatility winners and shorting low-volatility losers, consistently outperforms the traditional winner-loser momentum strategy across all holding periods in both market types.
The strategy appears to be particularly effective in emerging markets, where the returns are notably higher than in developed markets.
Investors who prefer not to engage in short-selling could still benefit significantly by investing solely in the high-volatility winners (HvWinner) portfolio.
The HvWinner portfolio's remarkable performance suggests that incorporating volatility into momentum strategies can enhance profitability.
Comparing Risk-adjusted Returns of a Momentum + Volatility against a traditional Momentum strategy
The study confirms that incorporating recent volatility into momentum strategies improves performance, especially in emerging markets. High-volatility winners in emerging markets yield significant returns and alphas. The study has linked momentum profits to risk by using past volatility to enhance the momentum strategy. Although risk adjustment by a two-factor model does not fully explain the momentum profits, it suggests a possible role for risk in the momentum anomaly.
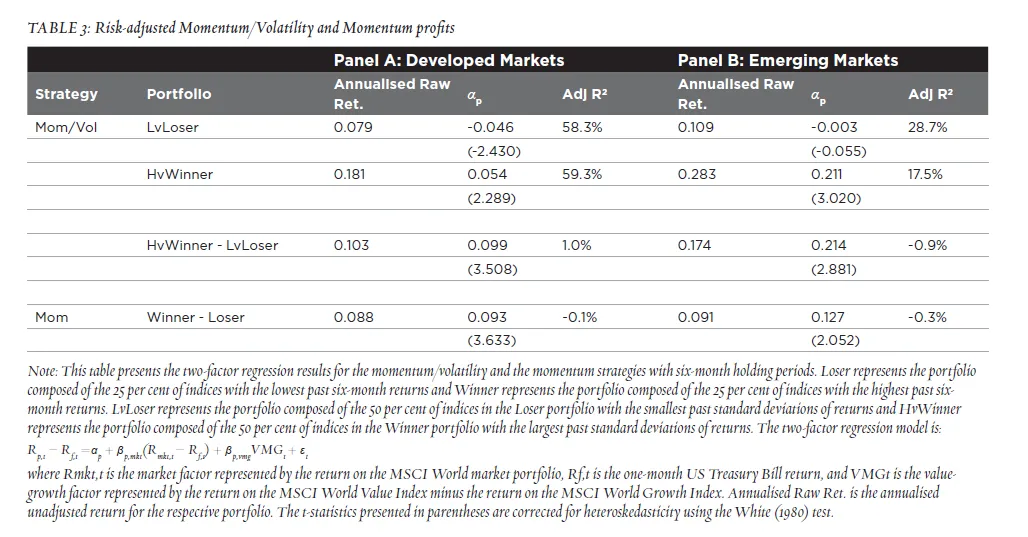
The risk-adjusted returns of the momentum/volatility strategy are significantly positive in both markets, particularly so in emerging markets.
The momentum/volatility strategy outperforms the pure momentum strategy, especially in emerging markets where high-volatility winners substantially outperform low-volatility losers.
The t-statistics indicate that the results are statistically significant, especially for the HvWinner portfolio in emerging markets.
Pure momentum strategy profits are reversed within five years, whereas momentum/volatility profits are not, indicating the robustness of the latter strategy. There is an implication that momentum might be a composite phenomenon that requires different explanations for different components.
Overlapping between Wright Momentum & Alpha Prime
The fundamental difference between Wright Momentum and Alpha Prime is that Alpha Prime is a 10 stock only portfolio - it is highly concentrated, highly aggressive and a very high risk portfolio.
Wright Momentum on the other hand is a more diversified portfolio as it contains 20-25 stocks which mean it is less aggressive albeit still a high risk portfolio. Both portfolios follow the momentum strategy but also look at different momentum attributes.
Alpha prime currently is more focused on smallcap stocks as they have rallied well so far, however this may change in the future depending on how markets perform and what is doing well at the time. The decision of which is best, depends on your risk profile, tolerance level and preference. As we stated earlier, Alpha Prime is highly risky and if you are not comfortable with sharp price movements when the market corrects, then this may not be the right portfolio for you.
Here’s a Complete guide to Momentum Investing & the Wright Momentum Portfolio
As both of these strategies are built independently there can be an overlap of stocks between the 2 portfolios. Usually there is very little overlap in the stocks that are selected and added to each of Wright Momentum & Alpha Prime portfolios. And this overlap is restricted to 1 or 2 stocks. And as we have seen in recent times, when market’s are extremely bullish - both of these portfolios are performing at their peak. In such scenarios we may see a higher overlap in our momentum strategies. For instance, we may buy a stock in Alpha Prime portfolio, but may have to sell it in the Wright Momentum portfolio. We would do this since Alpha Prime, as discussed above, is a much higher risk - aggressive portfolio where such a stock may benefit it while Momentum may not benefit from it since the risk-return characteristics are different. For investors that have invested in both Momentum & Alpha Prime - you can choose to manually opt out of such rebalances.
If you would like us to actively manage your portfolio, then do consider joining the Wright Portfolio Management Service , where the team is looking at the whole investment portfolio and not just building individual investing strategies.
This is naturally a complicated topic, and we will be releasing a video explaining this in more detail. Be sure a keep an eye out on our Youtube channel.
4 Years Of Wright Momentum: Smallcase & Stock Market Update
Come join us for an insightful live for our Smallcase & Stock market update - 4 years of Wright Momentum update.We will discuss in detail the smallcases, stock market updates & give you an overview of how momentum has done over 4 years. 💰
📈 4 Years of Momentum ⚡ Sonam Srivastava, Siddharth Bhaisora🗓️ Start Date: 10th December🕚 Timing: 11:00AM
Don't miss this live stream!👇🏻
Join our Telegram Channel to get daily morning market updates. Subscribe to our Youtube Channel to learn about all things investing, understand sector performance, get key insights into new topics like concentrated portfolio, quantitative investing and more!
Read the full article on Wright Research, Should you invest in overlapping momentum investing strategies?
Other interesting articles to explore Greatest Momentum Investors Ever: A Look At Their Best Momentum Bets , Four Years of Wright Momentum: Mastering the Art of Building a Successful Momentum Strategy.
About the author

Our Investment Philosophy
Learn how we choose the right asset mix for your risk profile across all market conditions.
Subscribe to our Newsletter
Get weekly market insights and facts right in your inbox