It’s the four year anniversary of Wright Momentum! We launched the Momentum portfolio in December 2020, in a market ripe for Momentum investing. Momentum has been my favourite strategy to work on in the markets and I had been researching quantitative momentum strategy for years before that. I started this strategy with giddy excitement in 2020, and the reception that momentum has received has also been beyond exciting.
So this week, we are celebrating the power of momentum investing with the Wright Research edge. We’ll explore how momentum has looked for the investors, the performance, the multi-baggers, the hits and the misses.
What is Momentum?
Momentum in investing is like a snowball rolling downhill, gaining size and speed. It refers to the rate at which a stock's price is moving, emphasizing the strength and speed of price changes. Imagine a stock gradually increasing in price - momentum is the force driving it upwards.
To measure momentum, we look at the rate of change in price over a specific period or other technical definitions of momentum. A stock rising 10% in a month versus a week shows different momentum levels.
It’s not just about rapid gains, but also the consistency of these gains. Whether for short-term trading or long-term investing, momentum is about spotting these continuous upward trends and capitalizing on them. It’s a strategy of joining the trend at the right time and exiting before it reverses, leveraging the market's tendency to persist in a direction.
Learn more about What is momentum?
Wright Momentum Performance
Wright Momentum has given a 322% returns in the last 4 years and is a three fold multibagger in itself! What is amazing is that the strategy has performed 150% better than the Multicap Index as well.
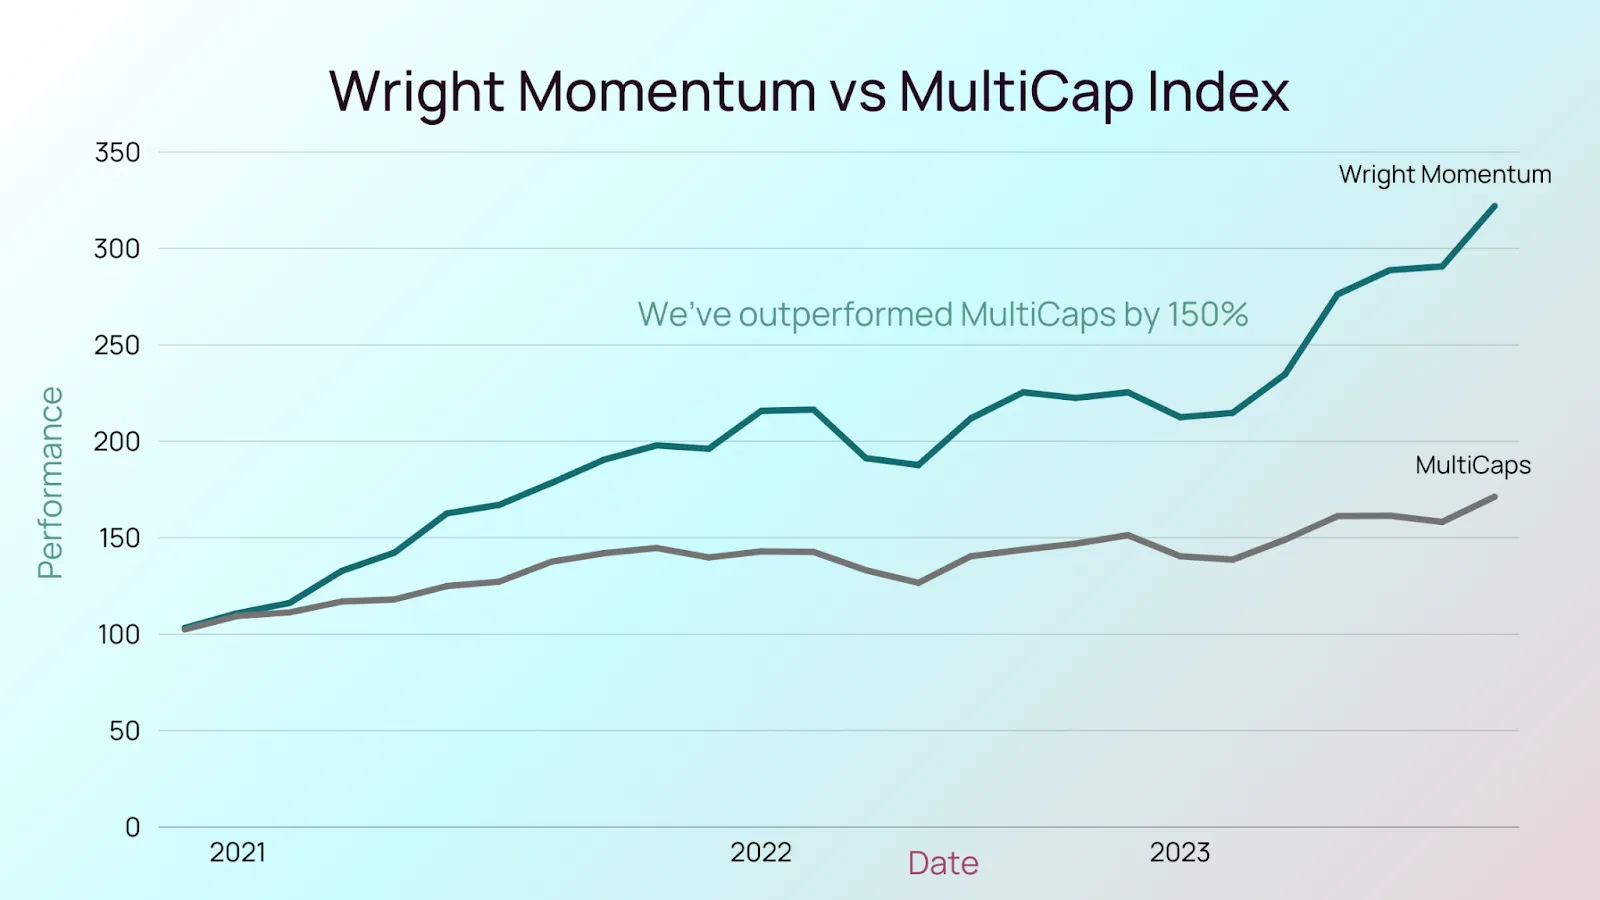
And not just the multicap index, Wright Momentum has infact done better than the Momentum benchmark - Nifty Momentum also by a wide margin.
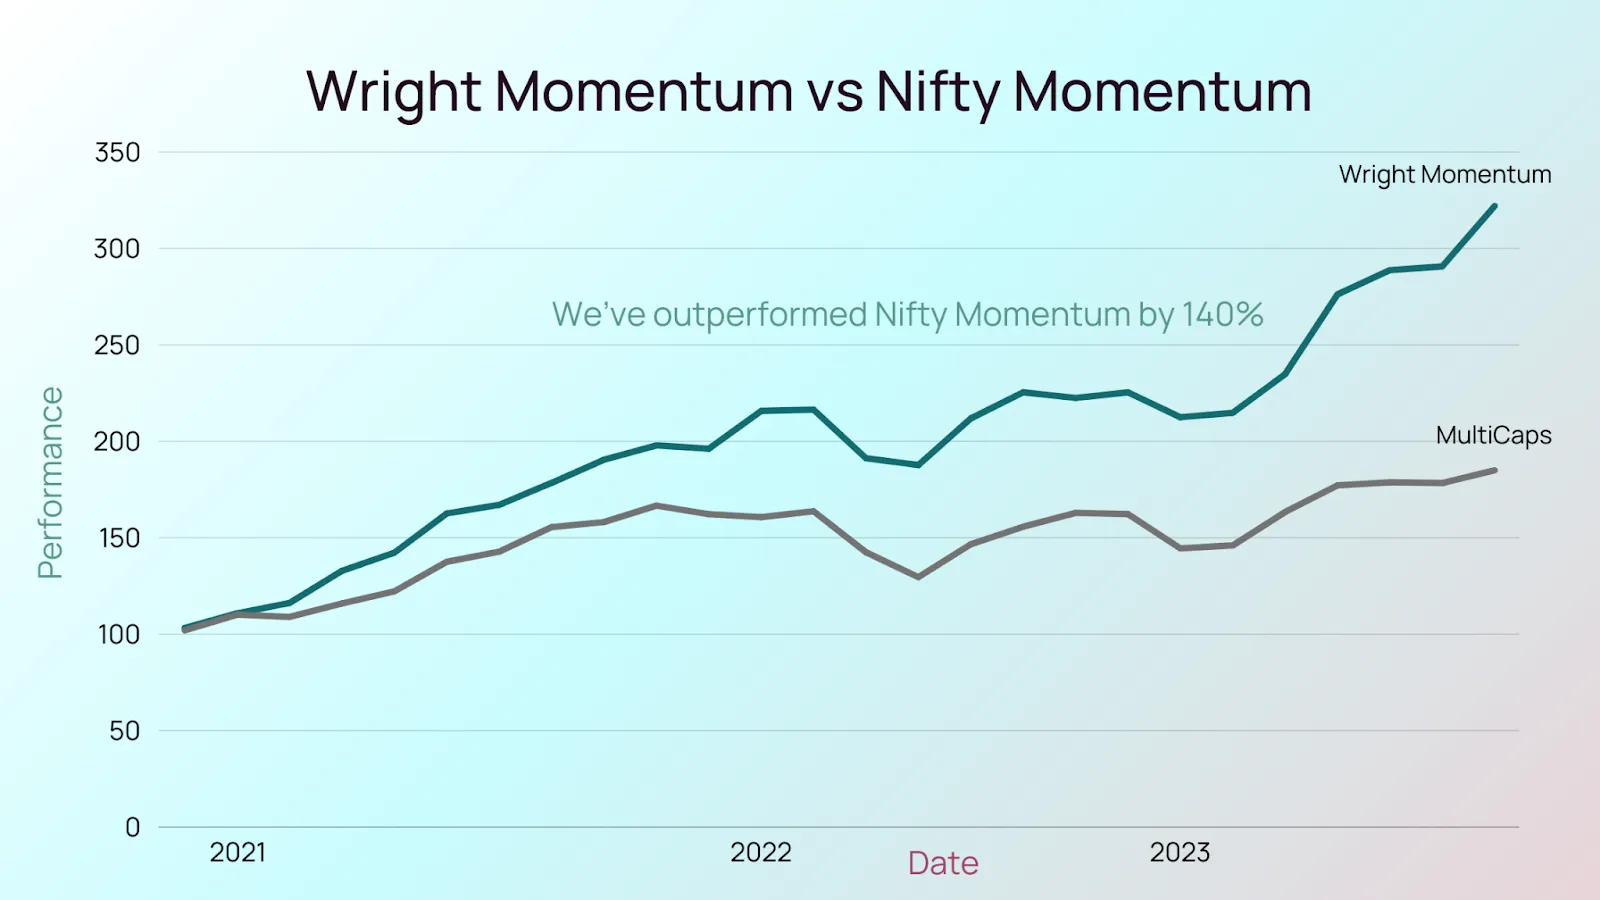
Momentum has built its performance in the bull markets of 2020-21 and 2023 but it has help on its edge over the market during the sideways market of 2022 as well, speaking a lot about its strong risk management.
Read this article on Momentum Investing: Risk, Reward & Everything Else
The Stocks in Momentum Portfolio
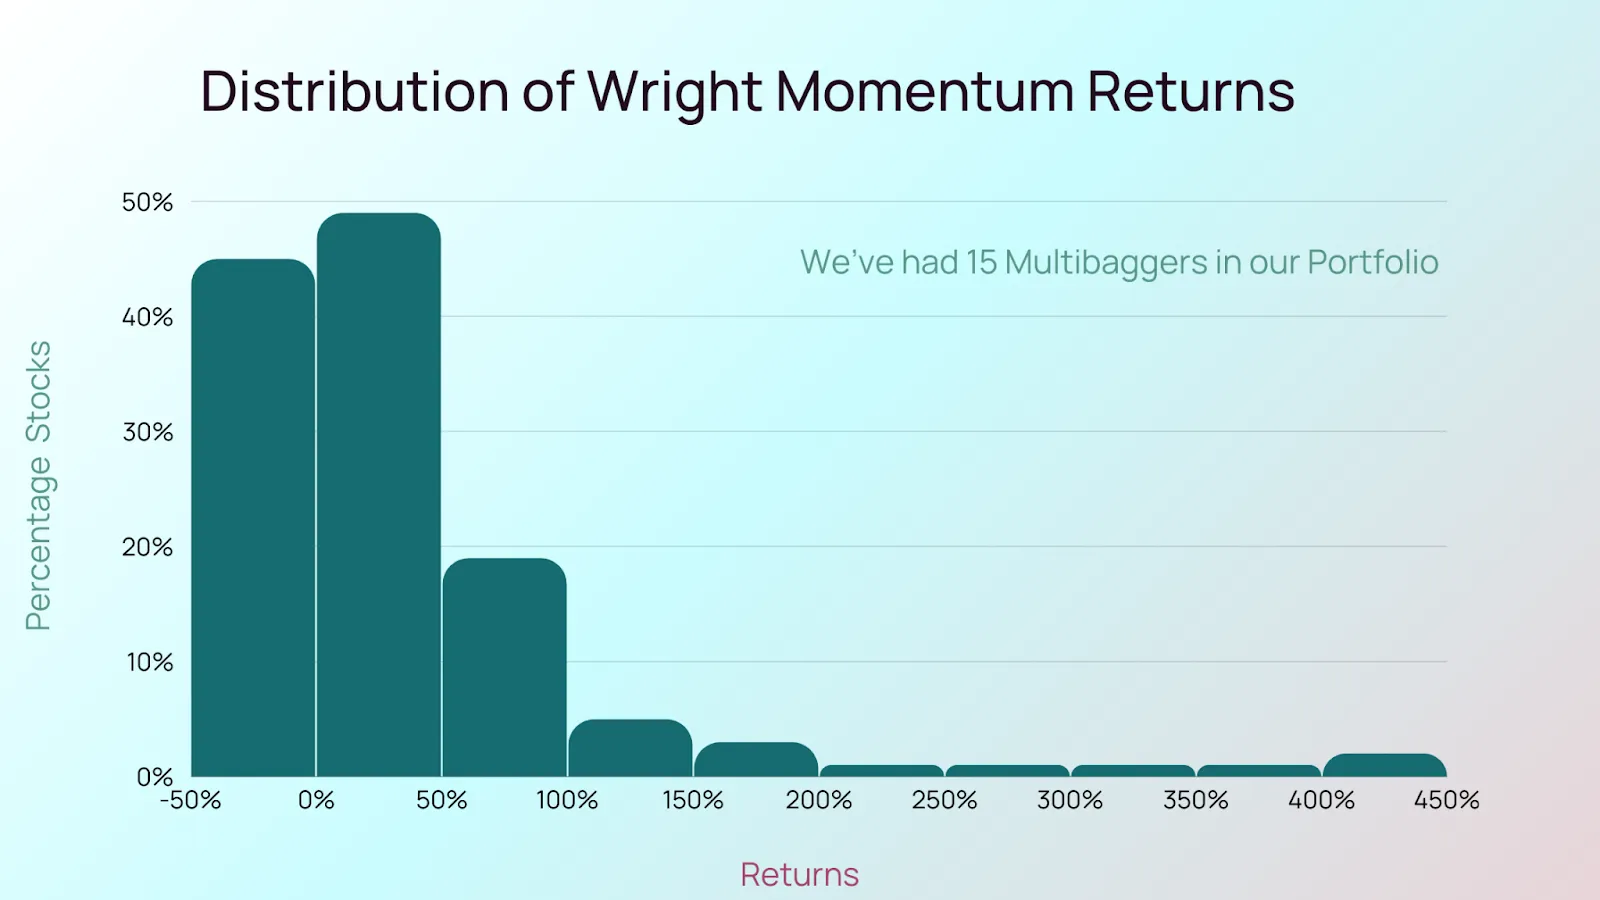
Let’s talk about the stocks in the Momentum Investing portfolio. We’ve held around 130 stocks at various times in the last 4 years with the portfolio being 20-25 stock strong at most times.
In these 130 stocks 15 have indeed turned multibaggers!
The distribution of returns shows a skew. While most stocks are exited with between 0-50% returns a few of the stocks turn out to be all out winners and skew up the strategy returns.
What is also interesting is that 35% of the stocks are indeed sold at a loss.
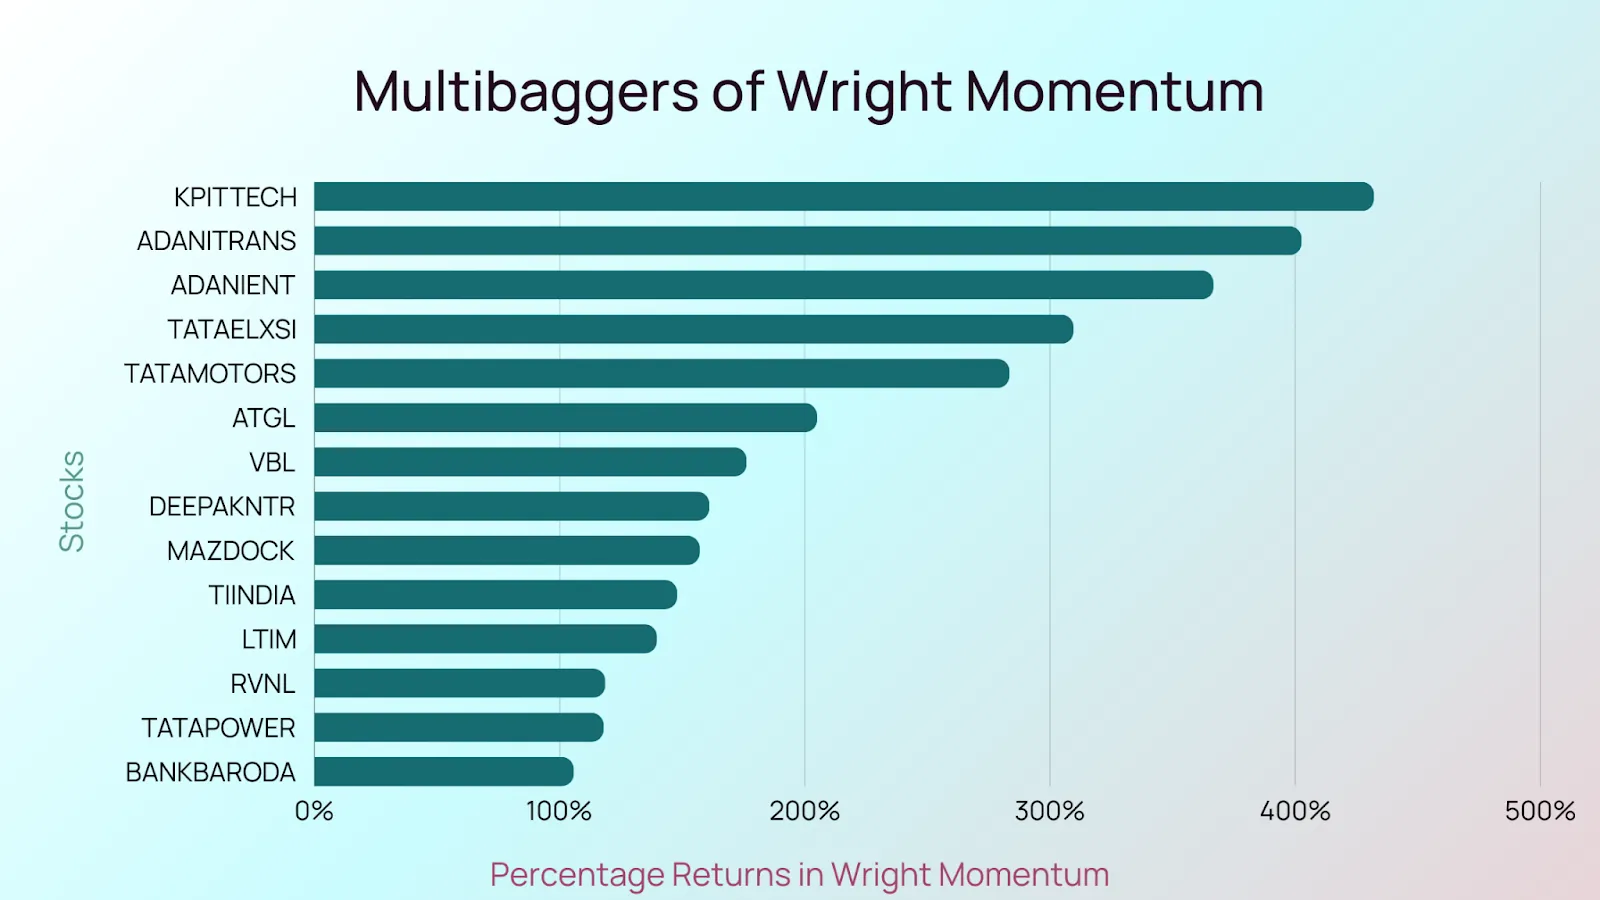
The biggest multibaggers of Momentum came in the 20-21 bull market - KPIT Tchnologies, Adani stocks, Tata Elxsi, Tata Motors, Tube India were the best performer at the time. More recently Mazdock, Bank Baroda, RVNL, Tata Power have turned multibaggers in this portfolio.
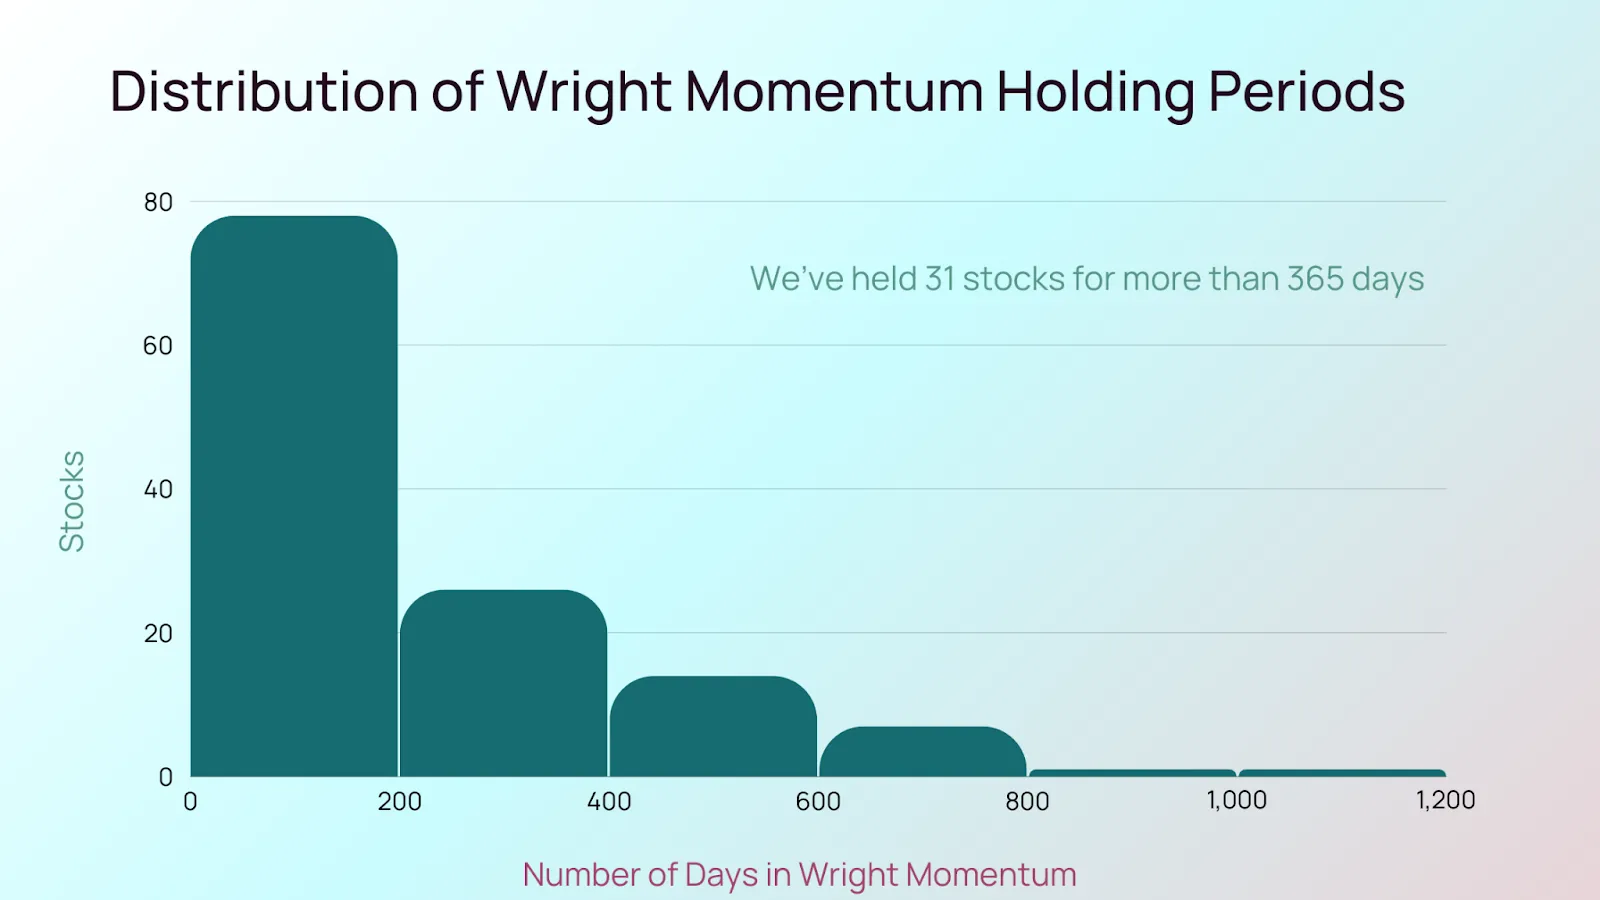
 How long do we hold the winners?
We hold on to the winners quite a lot!
In fact we have help 31 out of the 131 stocks for more than a year. But majority of the stocks are offloaded within 200 days of buying.
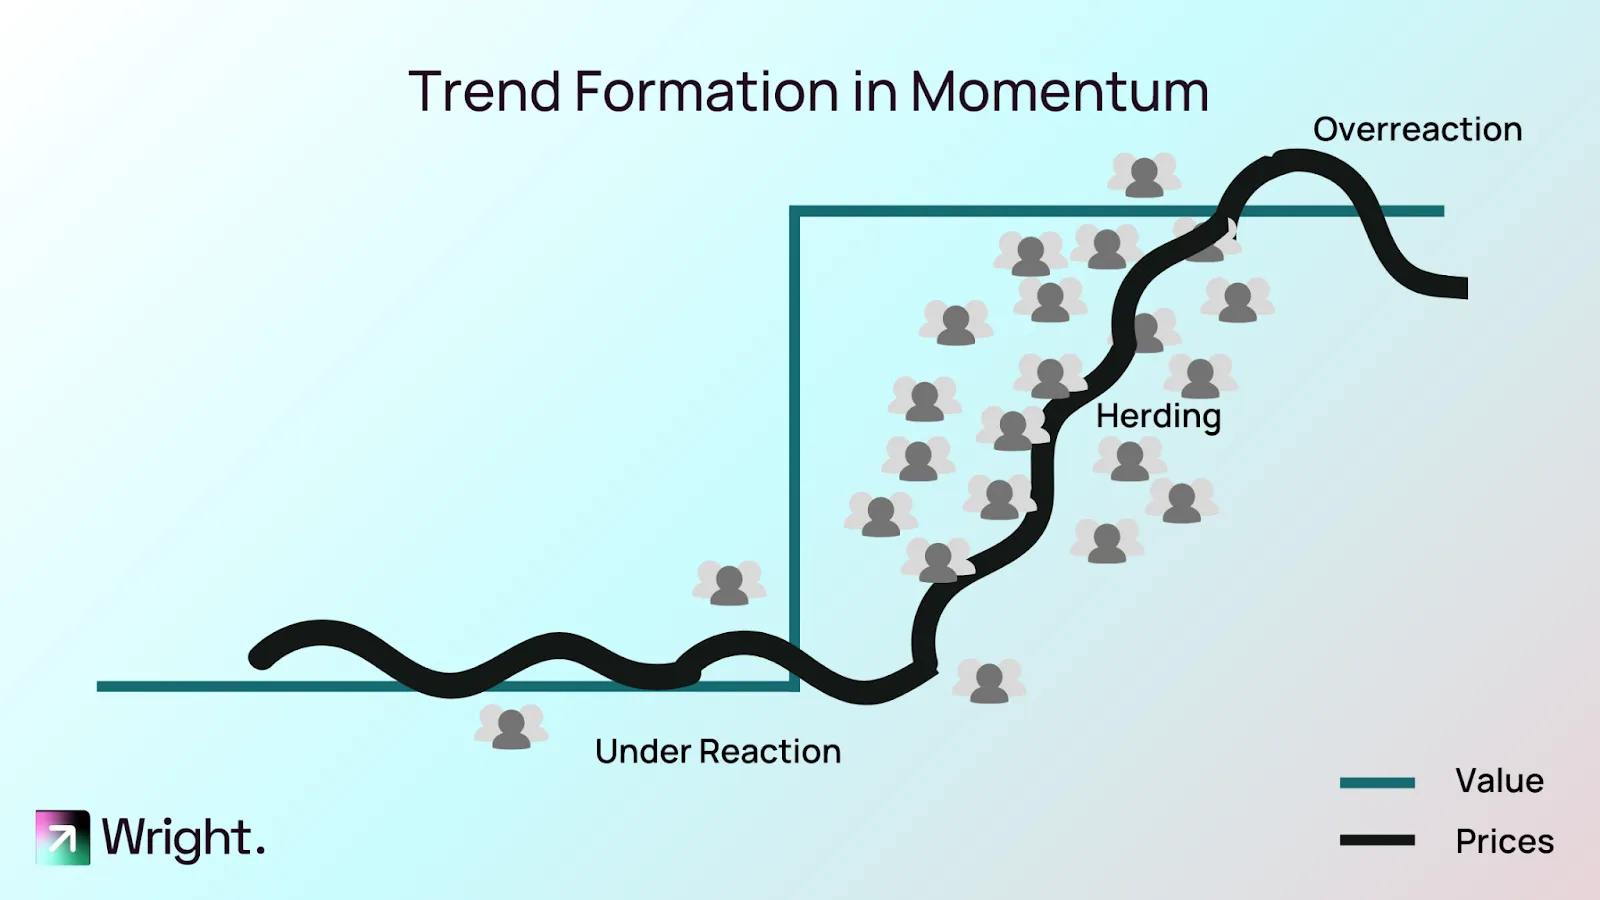
 Why does Momentum Work?
Momentum investing works largely due to behavioral patterns in the market. Key among these is the 'herding behavior' where investors often mimic others. When a stock rises, it attracts more investors, creating a self-fulfilling cycle of price increases.
Another aspect is the 'anchoring effect.' Investors tend to be slow in adjusting their expectations, often sticking to previous price levels or trends. This can prolong a stock's momentum as market participants are slow to react to new information.
Confirmation bias also plays a role. Once investors commit to a stock, they often focus on information that supports their decision and ignore contradictory evidence, sustaining the stock's upward trajectory.
Finally, automated trading systems can amplify momentum. As a stock rises, these systems might trigger additional buying, reinforcing the trend.
These behavioral tendencies explain why momentum can be a powerful force in the stock market, driving prices beyond fundamental valuations.
Legendary Momentum Investors and Their Iconic Trades
Richard Driehaus - The Innovator of 'Buy High, Sell Higher'
Richard Driehaus is often hailed as the father of momentum investing. His philosophy was simple yet revolutionary: 'Buy high and sell higher.' He focused on growth stocks showing strong price trends. One of his famous strategies was investing in small-cap stocks that had the potential for significant growth. By recognizing these stocks early in their upward trajectory, Driehaus capitalized on their momentum, generating substantial returns.
William O'Neil - The CAN SLIM Method
William O'Neil, the founder of Investor's Business Daily, devised the CAN SLIM system, a unique blend of quantitative and qualitative analysis. This method focuses on buying stocks with strong earnings growth, market leadership, and industry strength - all key indicators of momentum. One of his notable trades was in the 1960s with Syntex Corporation, which saw a meteoric rise, exemplifying his method's effectiveness in identifying high-momentum stocks.
Paul Tudor Jones - The 1987 Market Crash Prediction
Paul Tudor Jones, a renowned hedge fund manager, is known for his macroeconomic approach to investing, heavily relying on trend analysis and momentum. His most famous trade was predicting and profiting from the 1987 stock market crash. By recognizing the loss of momentum in the market and using technical analysis, Jones positioned his portfolio to benefit from the downturn, showcasing his skill in using momentum (or lack thereof) to guide investment decisions.

How is Momentum Measured?
There are Various Ways to Measure Momentum
Rate of Change (ROC):
The most straightforward way to measure momentum is by calculating the rate of change. This is done by comparing the current price of a stock to its price from a specific period ago, like 10 days or 12 months. The formula is:
ROC=(Current Price−Price n periods ago)/Price n periods ago
A higher ROC value indicates stronger momentum.
Relative Strength Index (RSI):
RSI is a popular technical indicator used to gauge momentum. It measures the speed and change of price movements on a scale of 0 to 100. Generally, an RSI above 70 suggests a stock is overbought (potentially losing momentum), while an RSI below 30 indicates it may be oversold (gaining momentum).
Moving Averages:
Comparing a stock’s price to its moving average (MA) is another common method. For instance, if a stock’s price is consistently above its 50-day MA, it's considered to have upward momentum. Some investors also look for crossovers, such as when a short-term MA crosses above a long-term MA.
MACD (Moving Average Convergence Divergence):
This tool measures momentum by plotting the difference between two exponential moving averages (EMAs), typically the 12-day and 26-day EMAs. A rising MACD indicates increasing momentum, while a falling MACD suggests decreasing momentum.
Stochastic Oscillator:
This momentum indicator compares a stock's closing price to its price range over a specific period. It oscillates between 0 and 100, indicating overbought or oversold conditions, which can signal shifts in momentum.
Volume-Weighted Average Price (VWAP):
While not a direct momentum indicator, VWAP combines price and volume data to show where the majority of trading volume has occurred, providing insight into momentum and potential support or resistance levels.
Trend Analysis: At its simplest, observing the price trend of a stock over time can indicate momentum. An upward trend in price suggests positive momentum, while a downward trend indicates negative momentum.
Each of these methods offers a different perspective on momentum, and investors may use a combination of these tools to get a more comprehensive view of a stock's momentum
How we build the Momentum Strategy
Building A Momentum Strategy - Step 1: Define the Universe of Stocks
We focus on the top 500 stocks on the NSE as our universe.
Building A Momentum Strategy - Step 2: Identify the Momentum indicator
We look at signals like rate of change, all time highs, trend break out signals, technical analysis, even earnings momentum - based on analyst ratings and analyse a broad set of indicators to pick the best ones.
Building A Momentum Strategy - Step 3: Rank/Normalize Stocks Based on Momentum
We use various types of nomalization techniques and ranking to assign a final momentum score to stocks in the universe.
Building A Momentum Strategy - Step 4: Build the Momentum Portfolio
We use portfolio optimization techniques to get the stock weights. The weights are assigned such that the diversification is also high and risk is reduced.
Building A Momentum Strategy - Step 5: Monthly Portfolio Rebalancing
At the start of each month, re-run the whole model which leads to some stocks coming in and others going out
This ensures your portfolio always consists of the top momentum stocks and adjusts for any significant changes in stock performance.
Other Salient Points Related to Momentum
These are 5 simple steps you can follow to build your own momentum strategy. Before we move on, here are a few pointers to keep in mind when you are building your own momentum strategy:
Momentum portfolios are most effective in trending markets.
Check for market trends using tools like a 200-day moving average over broader market indices.
Momentum Strategy Limitations:
Be cautious using this strategy in choppy or sideways markets as momentum strategies tend not to perform well in such conditions.
Naturally, if you can predict market movements, then it becomes easier to navigate
Flexibility in Rebalancing Frequency:
The portfolio can be rebalanced quarterly, weekly, or even daily.
Higher rebalancing frequency can lead to increased costs, including brokerage fees.
Momentum Criteria Variability:
Looking at a single Momentum criteria can we prone to risk but combining multiple momentum signals can reduce risk and smoothen the return profile.
Importance of Backtesting:
The robustness of the backtest of the momentum strategy is the key to creating a portfolio that does well in the live market
Deallocation Policy
In unforeseen market conditions, we also have a policy that moves away from equities if the risks are too high. This is important to navigate extreme risks.
In conclusion, Wright Momentum’s four-year journey since its inception in December 2020 has been nothing short of remarkable. Achieving a 322% return and outperforming various benchmarks, the strategy has demonstrated the profound impact and potential of momentum investing. This approach, akin to a snowball rolling downhill, capitalizes on the market's behavioral patterns and trends, leveraging the continuous upward trajectories of stocks.
With a carefully curated portfolio of around 130 stocks, of which 15 became multibaggers, Wright Momentum’s strategy has shown resilience not only in bull markets but also in more challenging sideways markets. This success is underpinned by a combination of sophisticated momentum indicators and robust risk management strategies.
The journey of Wright Momentum embodies the essence of what Richard Driehaus, William O'Neil, and Paul Tudor Jones exemplified in their iconic trades: the power of recognizing and harnessing the momentum in the stock market. As we celebrate this anniversary, it’s clear that Wright Momentum isn't just a testament to the strategy’s past success, but also a beacon of potential for future investment endeavors.
This celebration and reflection not only acknowledge past achievements but also set the stage for continued innovation and excellence in momentum investing. With a solid foundation and a proven track record, Wright Momentum is well-positioned to navigate the complexities of the market and continue delivering exceptional results. Here’s to the power of momentum investing and the promising future that lies ahead with the Wright Research edge. And to that, I say, very nice indeed!
Wright Research Telegram and Youtube Channel
Join our Telegram Channel to get daily morning market updates. Subscribe to our Youtube Channel to learn about all things investing, understand sector performance, get key insights into new topics like concentrated portfolio, quantitative investing and more!
Read the full article on Wright Research, Four Years of Wright Momentum: Mastering the Art of Building a Successful Momentum Strategy
Other interesting articles to explore Complete guide to Momentum Investing & the Wright Momentum Portfolio , All About Alpha: Is Your Investment Generating Alpha?
About the author

Our Investment Philosophy
Learn how we choose the right asset mix for your risk profile across all market conditions.
Subscribe to our Newsletter
Get weekly market insights and facts right in your inbox