

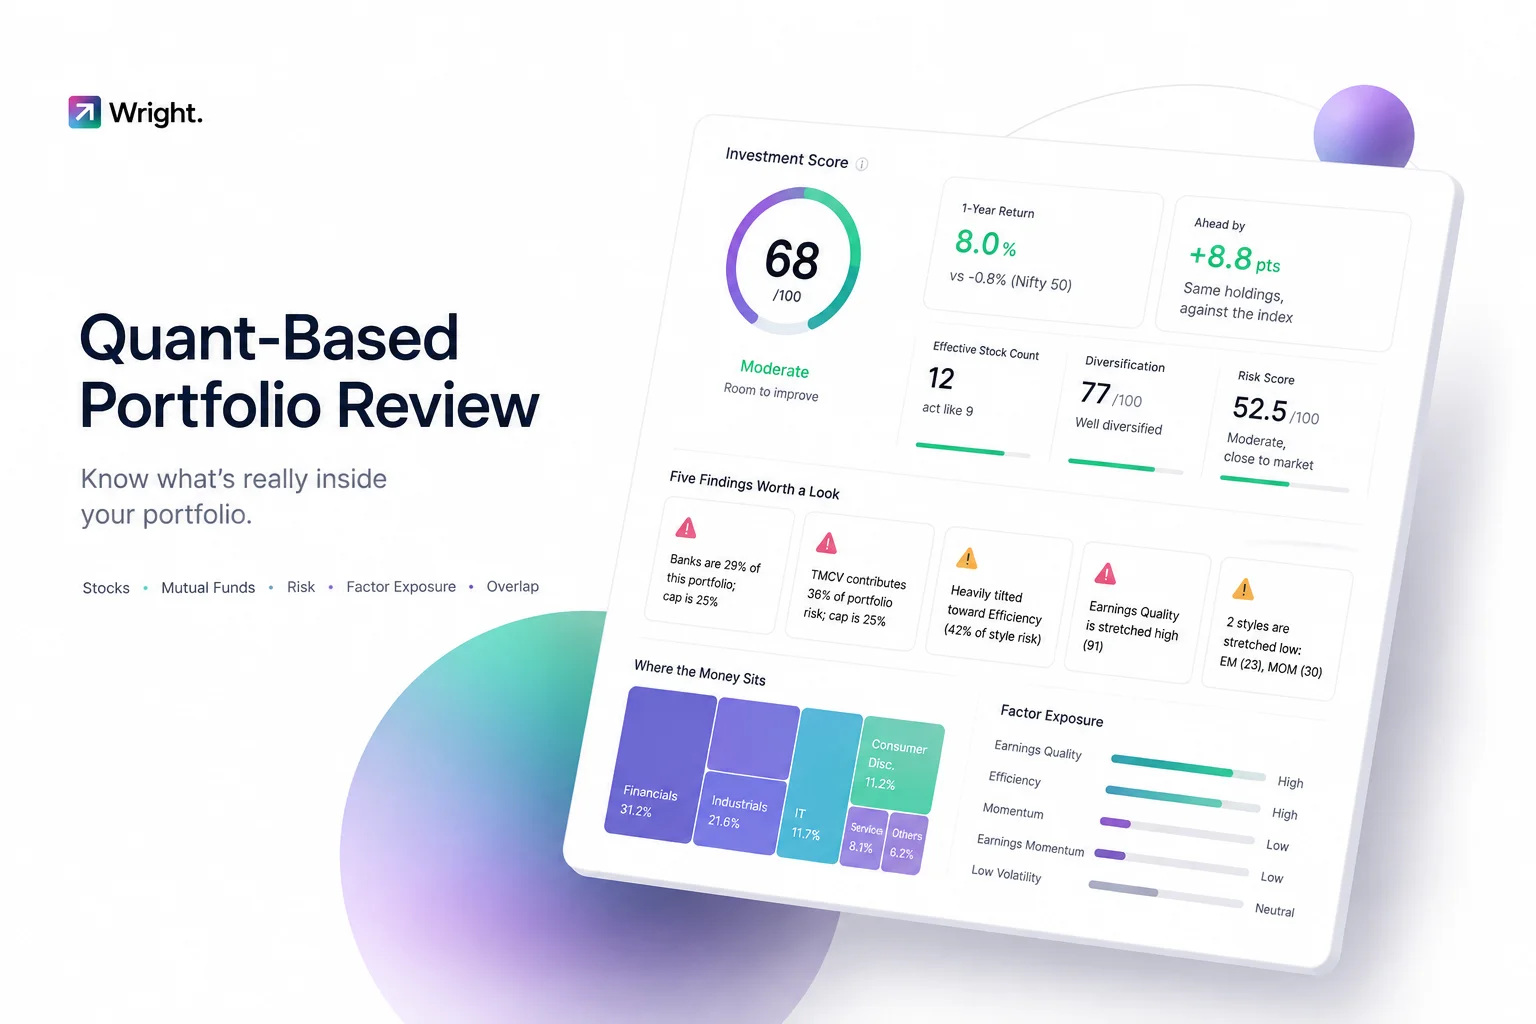
Introducing Wright Portfolio Review — bring in your stocks or your mutual funds, and see them measured against the same published framework we use in our own research.
You know what your portfolio is worth. Your broker app tells you every morning, in green or in red. What no app tells you is what the portfolio actually is — whether your twelve stocks are twelve independent bets or nine wearing different names, whether two of your funds quietly hold the same companies, what the word "Regular" on a fund's name will cost you by year ten, and how far this exact mix fell in March 2020.
Those are answerable questions. They only need two things: every holding in one place, and a fixed yardstick to measure them against. That is what Wright Portfolio Review does. You bring the holdings; we apply the same published checks — concentration limits, correlation, style exposure, fund overlap, direct-versus-regular fees, category weights, real crash history — that sit behind our own research.
One thing to be clear about before the tour. The review is information, not investment advice. Every number on the page is your portfolio measured against a framework that is published and identical for every user. It never asks about your goals, your income or your risk appetite, and nothing on the page tells you to buy or sell anything. It shows you where you stand. What to do about it is a conversation with an advisor — and you can book one from the same page.
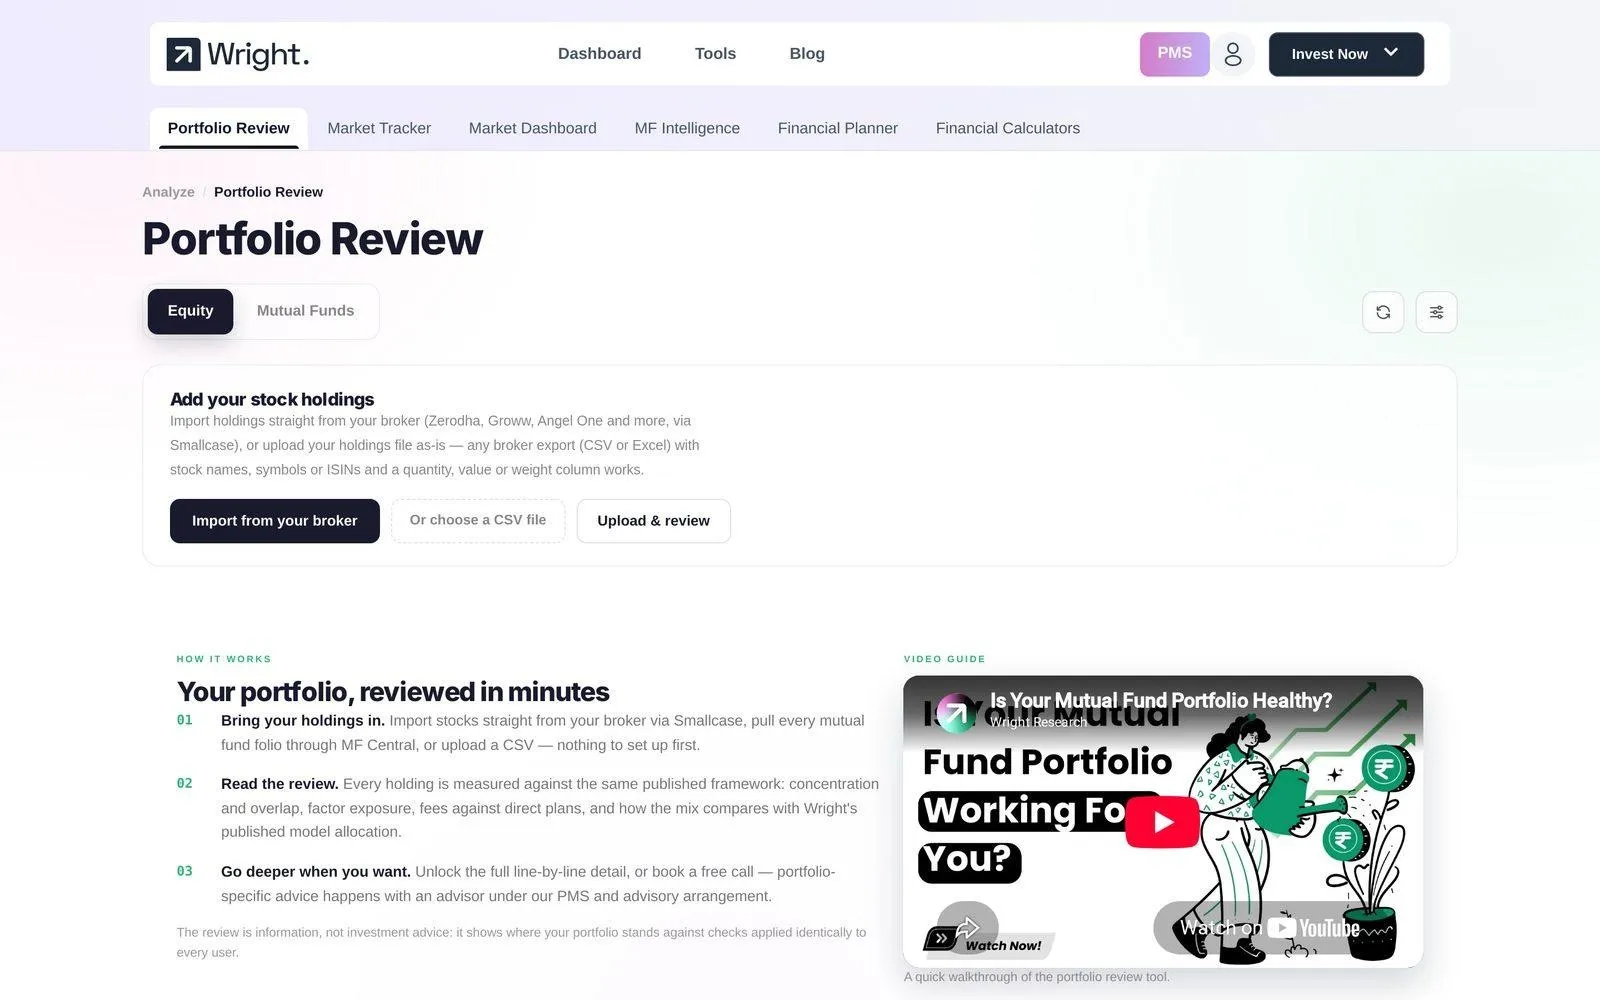
The Portfolio Review page, with the equity and mutual fund tabs and the import panel
Step one: getting the holdings in
The review is only as honest as the holdings behind it, so there are three ways in and none of them involve an evening of typing.
Fetch straight from your broker. Tap Import from your broker, pick yours in the Smallcase gateway — Zerodha, Groww, Angel One, Upstox, HDFC Securities, ICICI Direct, Kotak and the rest — and log in inside the broker's own window. Your demat holdings arrive with quantities and buy prices. Your credentials never touch Wright. A refresh button at the top of the review re-imports whenever you want, so the review can be re-run after every trade.
Pull every folio from MF Central. On the mutual fund tab, Import from MF Central connects to the industry registry run by CAMS and KFintech with your PAN and an OTP, and returns every folio you hold across every AMC — including the SIP you started through an app you no longer use. This matters more than it sounds. Most people's funds are scattered across two or three platforms, and overlap and fee analysis are only meaningful when the fund you forgot is counted too.
Or upload the file you already have. A broker holdings export, a CAMS or KFintech statement, CSV or Excel — as-is, no reformatting. Columns are recognised by meaning rather than position, so "Stock Name / ISIN / Quantity / Average buy price", "Scheme Name / Folio / Balance Units / NAV" and "Symbol / Quantity Available / Average Price" all work. Names are resolved the way a person would resolve them: NSE symbols, ISINs, broker suffixes like INFY-EQ, fund names in broker shorthand, direct versus regular, growth versus IDCW, and schemes that have since been renamed. Anything it cannot place with confidence is flagged and skipped rather than guessed at — you see exactly what matched before a single row is saved.
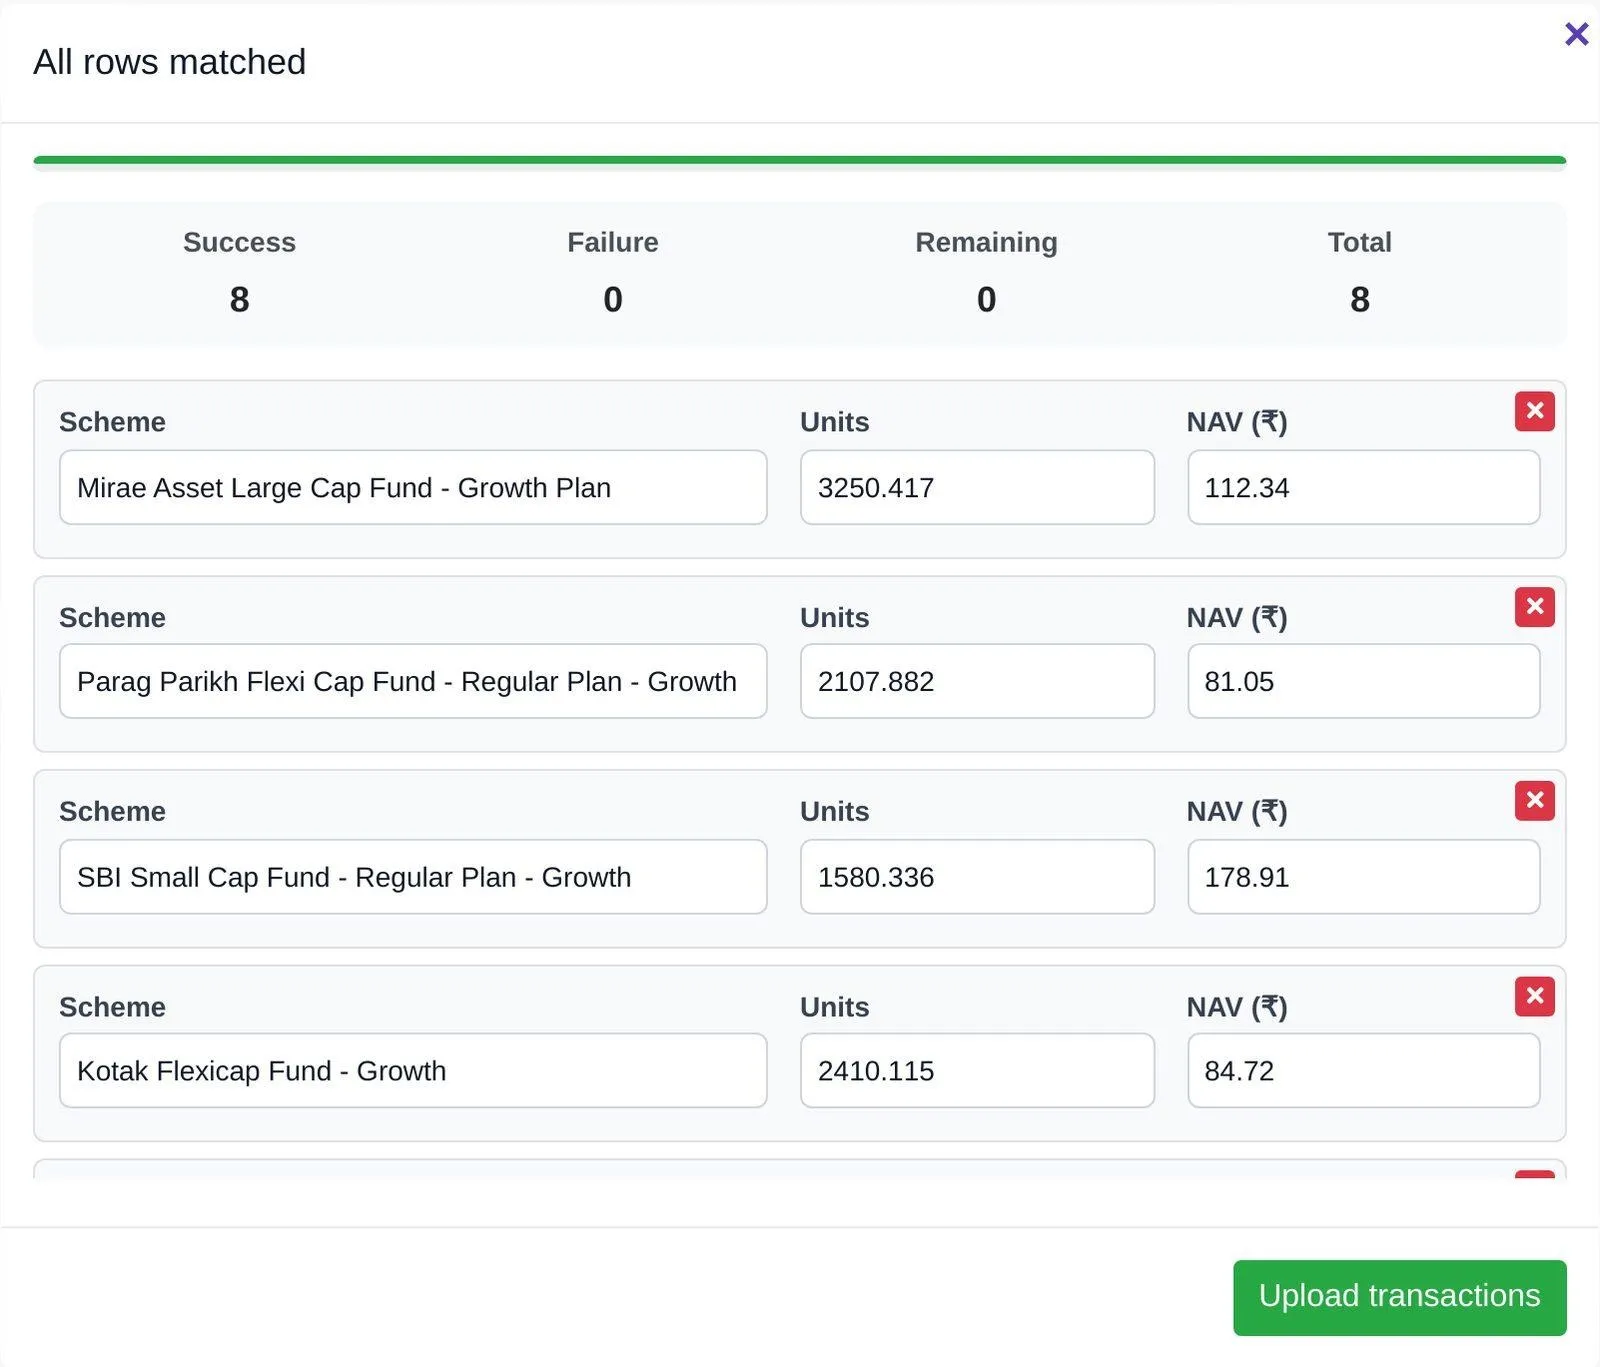
The import confirmation showing all eight scheme rows matched with units and NAV
See what markets are pricing in
Live indices, sector moves and market breadth — the backdrop to every story we publish.
The equity review
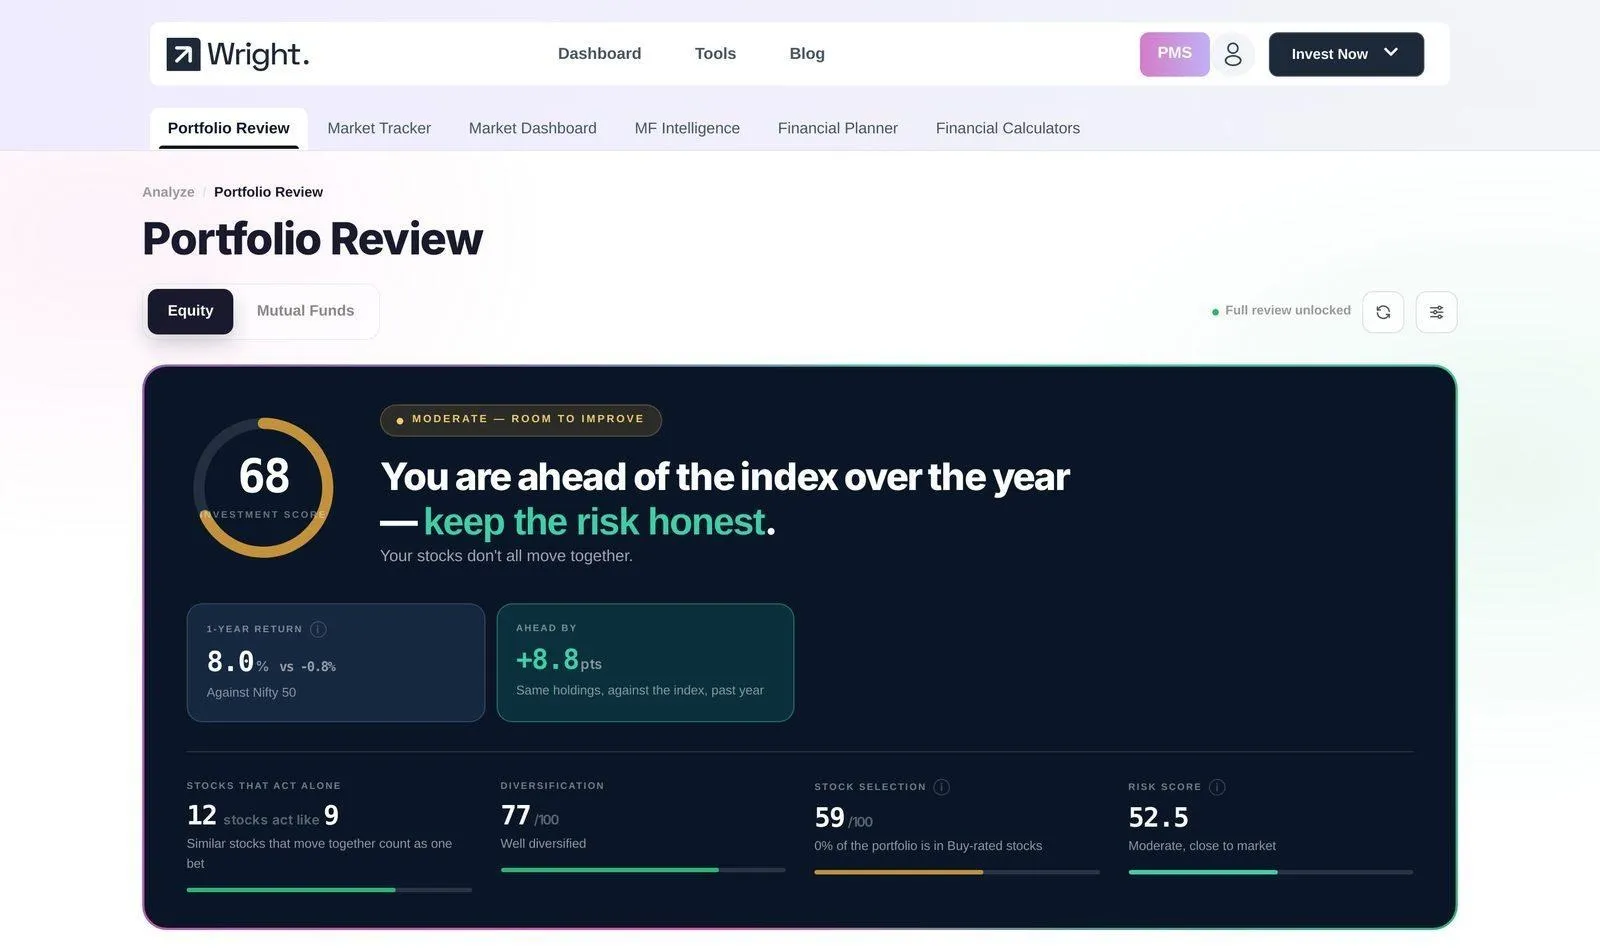
The equity review hero card, showing an investment score of 68 out of 100
At the top: a single investment score — 68 out of 100 in this demo book of twelve large caps — built from the diversification, stock-selection and risk sub-scores beneath it, with a band that reads it for you (Moderate — room to improve). The headline next to it is generated from the numbers, not from a template of encouragement: "You are ahead of the index over the year — keep the risk honest."
Then the four numbers that describe the book:
1-year return, 8.0% against the Nifty 50's −0.8% — ahead by 8.8 points. Deliberately measured on today's holdings at today's weights, which answers "is this portfolio any good" separately from when you happened to buy.
12 stocks act like 9. Twelve names is not twelve bets when some of them move together. This is the effective count once similar-sized, similar-moving positions net down.
Diversification 77/100 — how evenly risk is spread across sectors, industries and individual names, against the published caps.
Risk score 52.5 — where the portfolio's beta and volatility sit as a percentile of the whole market. Around 50 moves like the market; 65-plus is aggressive; below 35 is defensive.
Where you sit against the limits
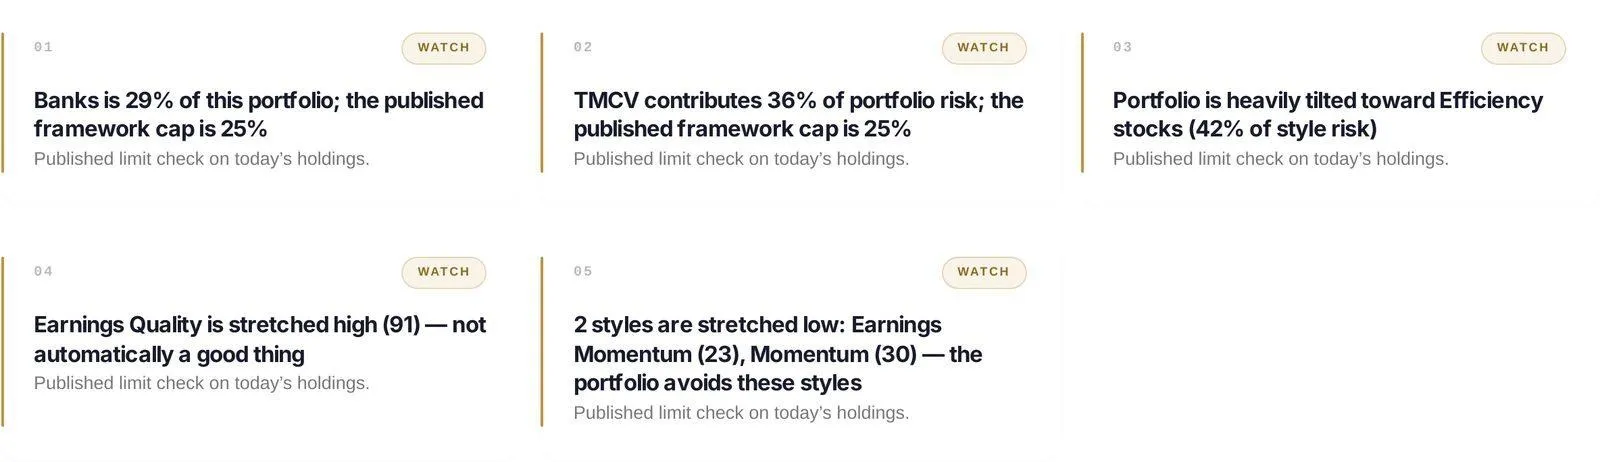
Five numbered flag cards, each stating a holding or weight against its published limit
Each finding is a card marked Breach (outside a published limit) or Watch (close to one), and each is a fact with the limit printed beside it: Banks is 29% of this portfolio; the published framework cap is 25%. TMCV contributes 36% of portfolio risk; the cap is 25%. The limits are ours, they are published, and they are the same for every investor who runs the tool. When nothing breaches, the section says so.
What the portfolio is actually betting on
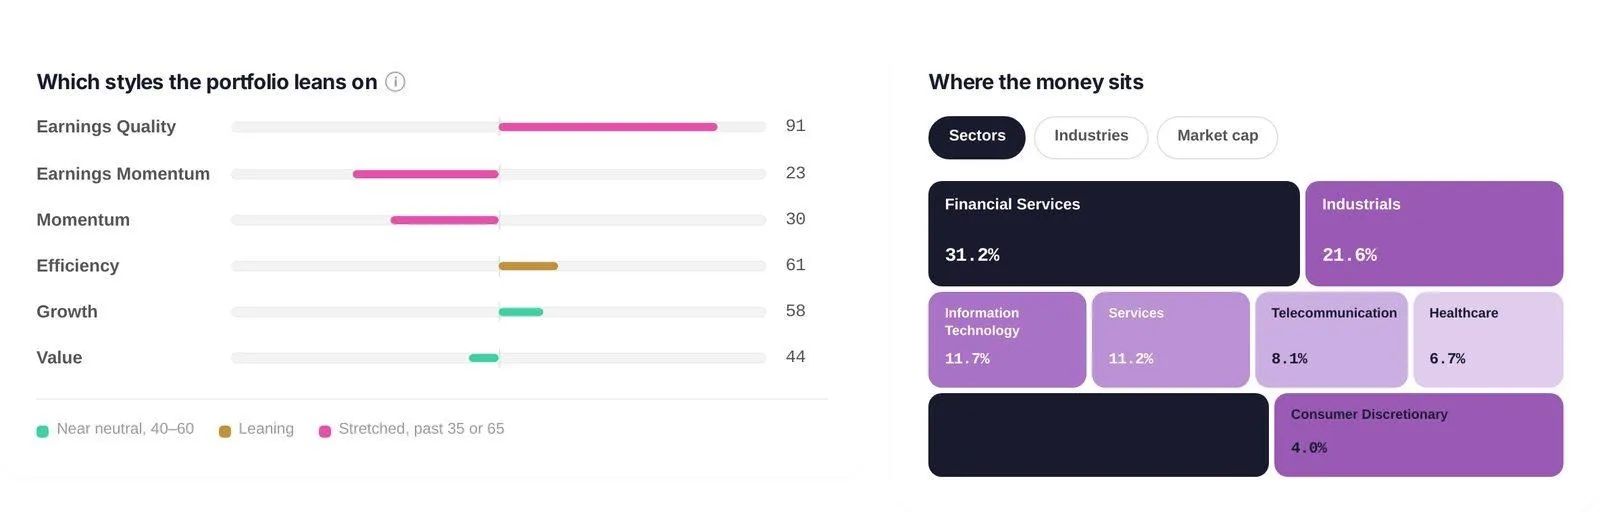
Style exposure bars and a treemap of sector weights
Six styles explain most of why an equity portfolio behaves the way it does, and every holding carries a 0–100 score on each. The portfolio bars are the weight-averaged result, read against the market: this book sits at Earnings Quality 91 — stretched high — with Earnings Momentum 23 and Momentum 30 stretched low. That is a real personality: a portfolio that owns profitable, efficient businesses and deliberately avoids what the market is currently chasing. It will behave differently from a momentum book in both directions. Beside it, Where the money sits maps the same portfolio by sector, industry or market cap — here, Financial Services 31.2% and Industrials 21.6% together are more than half the book.
Which holdings are really one decision
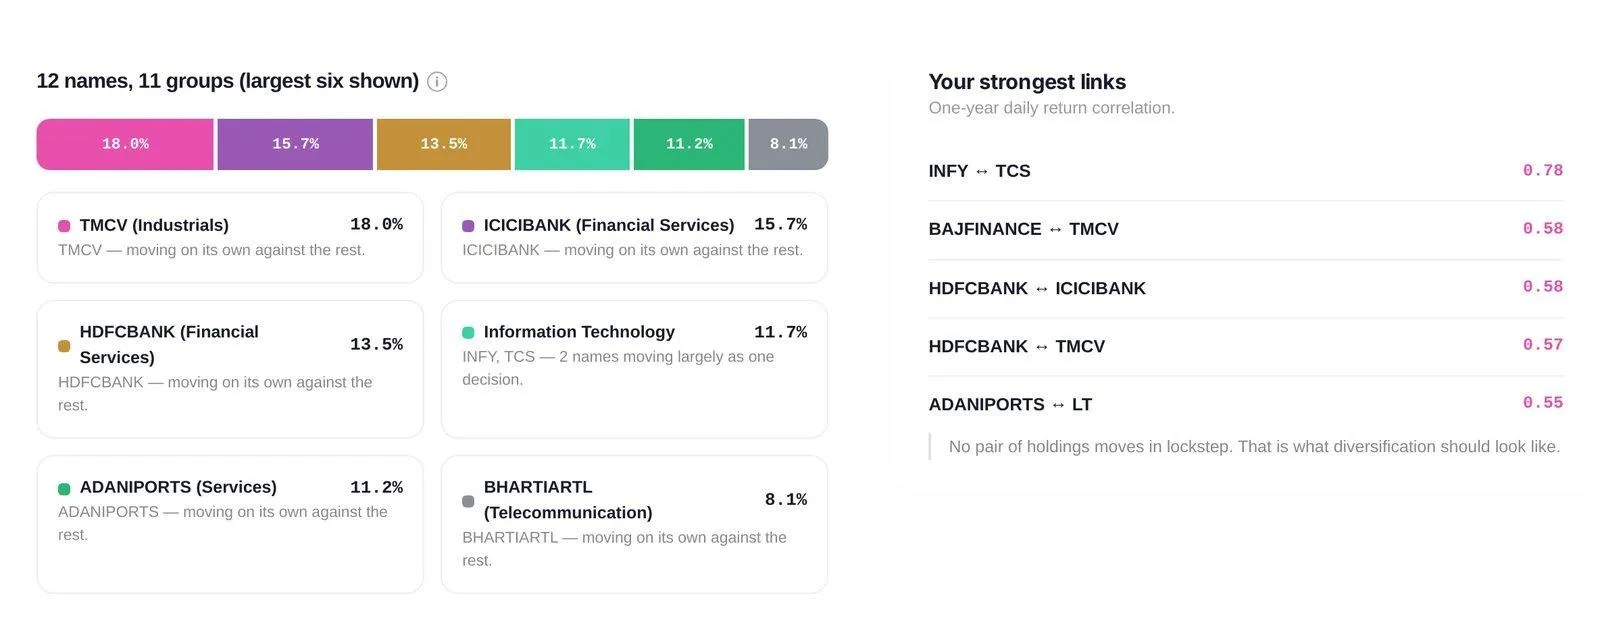
Correlation clusters with the strongest linked pairs listed
Holdings whose daily returns move together get grouped: twelve names here resolve into eleven genuinely separate groups, with INFY and TCS the tightest pair at 0.78. A cluster of five names is, for practical purposes, one decision — and that is exactly the kind of thing a holdings list will never show you. The panel reads the result out loud: here, no pair of holdings moves in lockstep. That is what diversification should look like.
Quality, risk and the governance checks
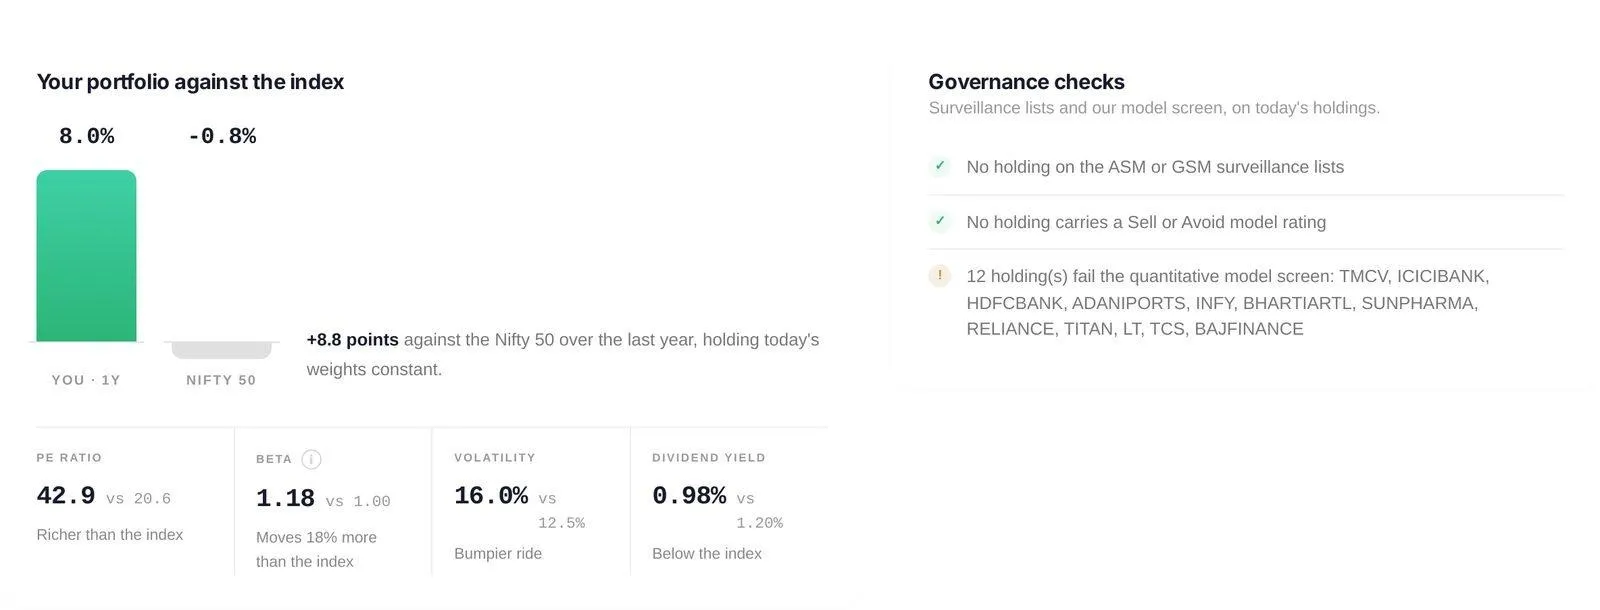
Portfolio versus index bars, PE, beta, volatility and dividend yield, plus governance checks
Four like-for-like comparisons against the Nifty 50, each with a plain reading beneath it: PE 42.9 vs 20.6 (richer than the index), beta 1.18 (moves 18% more), volatility 16.0% vs 12.5% (bumpier ride), dividend yield 0.98% vs 1.20% (below the index). Alongside, the governance block checks whether any holding sits on an exchange surveillance list (ASM/GSM), carries a Sell or Avoid model rating, or fails our quantitative model screen — and reports the misses by name, as it does here for all twelve.
What this mix did in real crashes
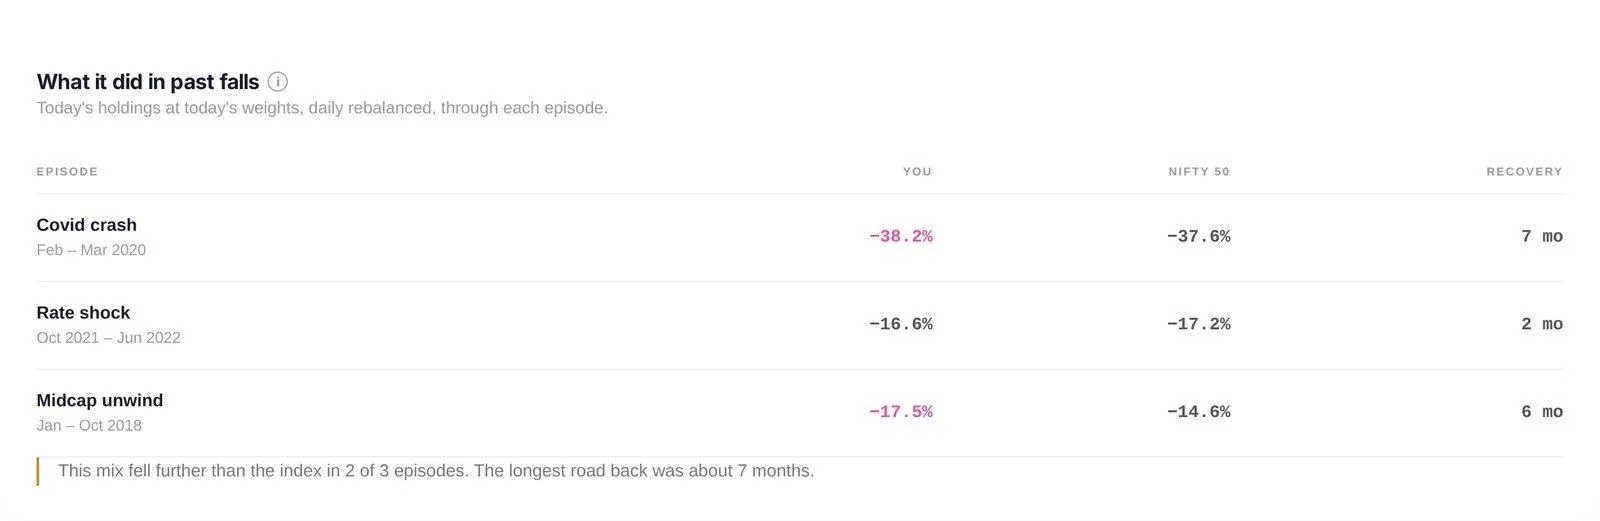
The past falls table showing the portfolio against the Nifty 50 in three historical episodes
Not a hypothetical stress test. The tool replays today's holdings at today's weights through three real episodes using each stock's actual daily price history: the Covid crash (Feb–Mar 2020, this mix −38.2% against the index's −37.6%, seven months to recover), the rate shock (Oct 2021–Jun 2022, −16.6% against −17.2%, two months) and the midcap unwind (Jan–Oct 2018, −17.5% against −14.6%, six months). Where a holding has no price history for an episode, it is dropped and the rest re-weighted, and where too little of the book has history for an episode, the table says so instead of filling the gap.
Then, every holding, line by line
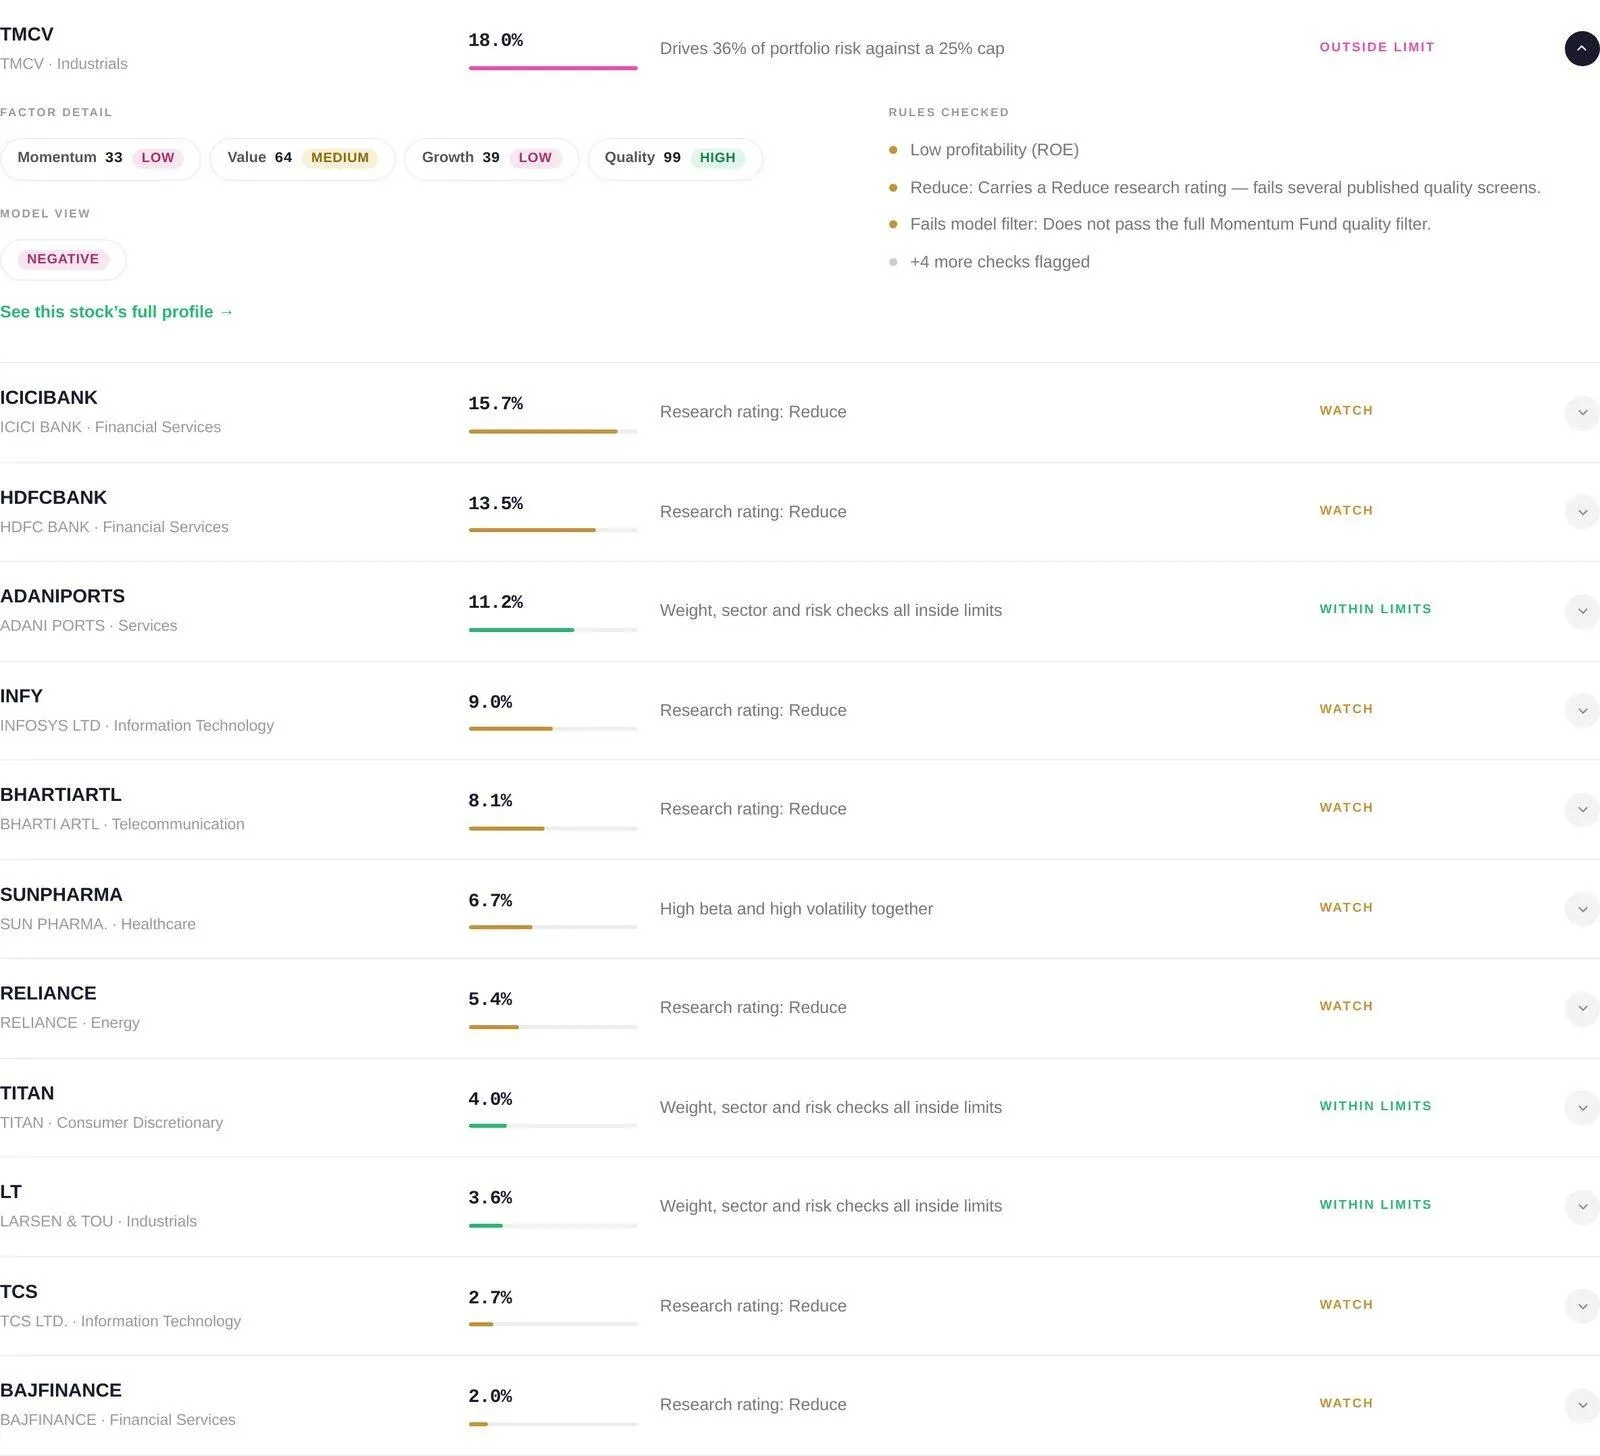
The holdings list with weight bars, one-line reasons and status chips
Every stock with its weight, a one-line reason and a status chip — Outside limit, Watch or Within limits. Open a row for its four factor scores with High/Medium/Low bands, a one-word model view, the most severe rules it flagged, and a link to the full stock profile. Research ratings appear here as findings about the stock — Reduce, Negative — never as an instruction about your portfolio.
Get research like this in your inbox
The week’s research that mattered, in five minutes. Joined by 2L+ investors.
The mutual fund review
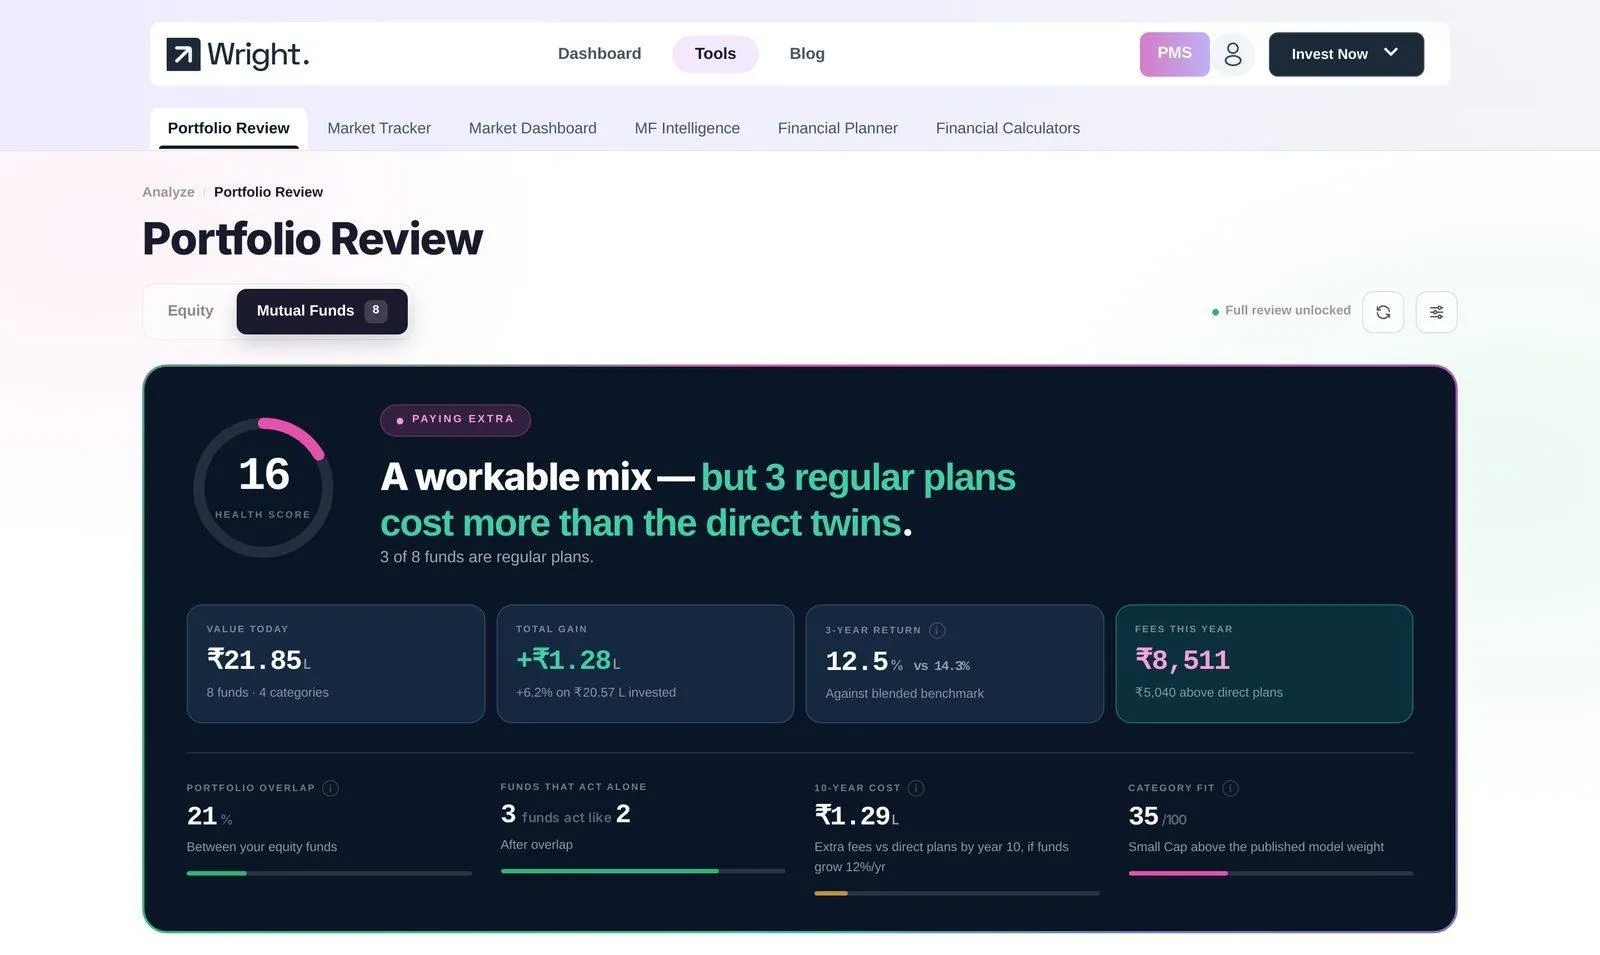
The mutual fund review hero card, showing a health score of 16 out of 100
Same architecture, different questions — because funds fail differently from stocks. They fail by holding each other's portfolios, and by charging you for the privilege.
This demo book scores 16 out of 100 — Paying extra — and the headline says why: "A workable mix — but 3 regular plans cost more than the direct twins." Across ₹21.85 lakh in eight funds and four categories: a total gain of ₹1.28 lakh (+6.2% on ₹20.57 lakh invested), a three-year return of 12.5% against a blended benchmark's 14.3%, and ₹8,511 of fees this year, ₹5,040 of it above what the direct plans of the very same funds would charge. Below that: 21% overlap between the equity funds, three funds that behave like two, a ₹1.29 lakh ten-year cost, and a category fit of 35/100.
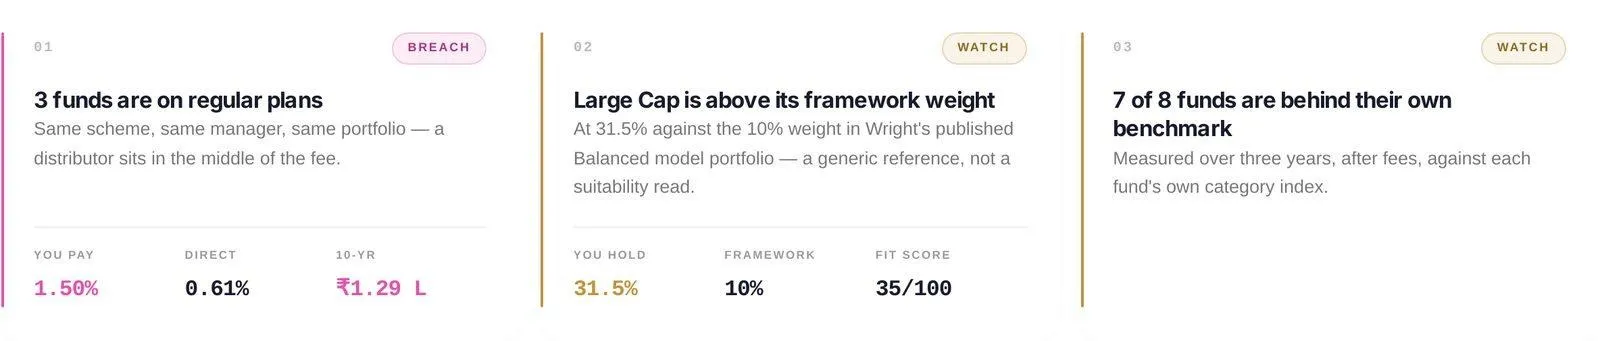
Three flag cards covering regular plans, category weight and benchmark performance
The overlap matrix
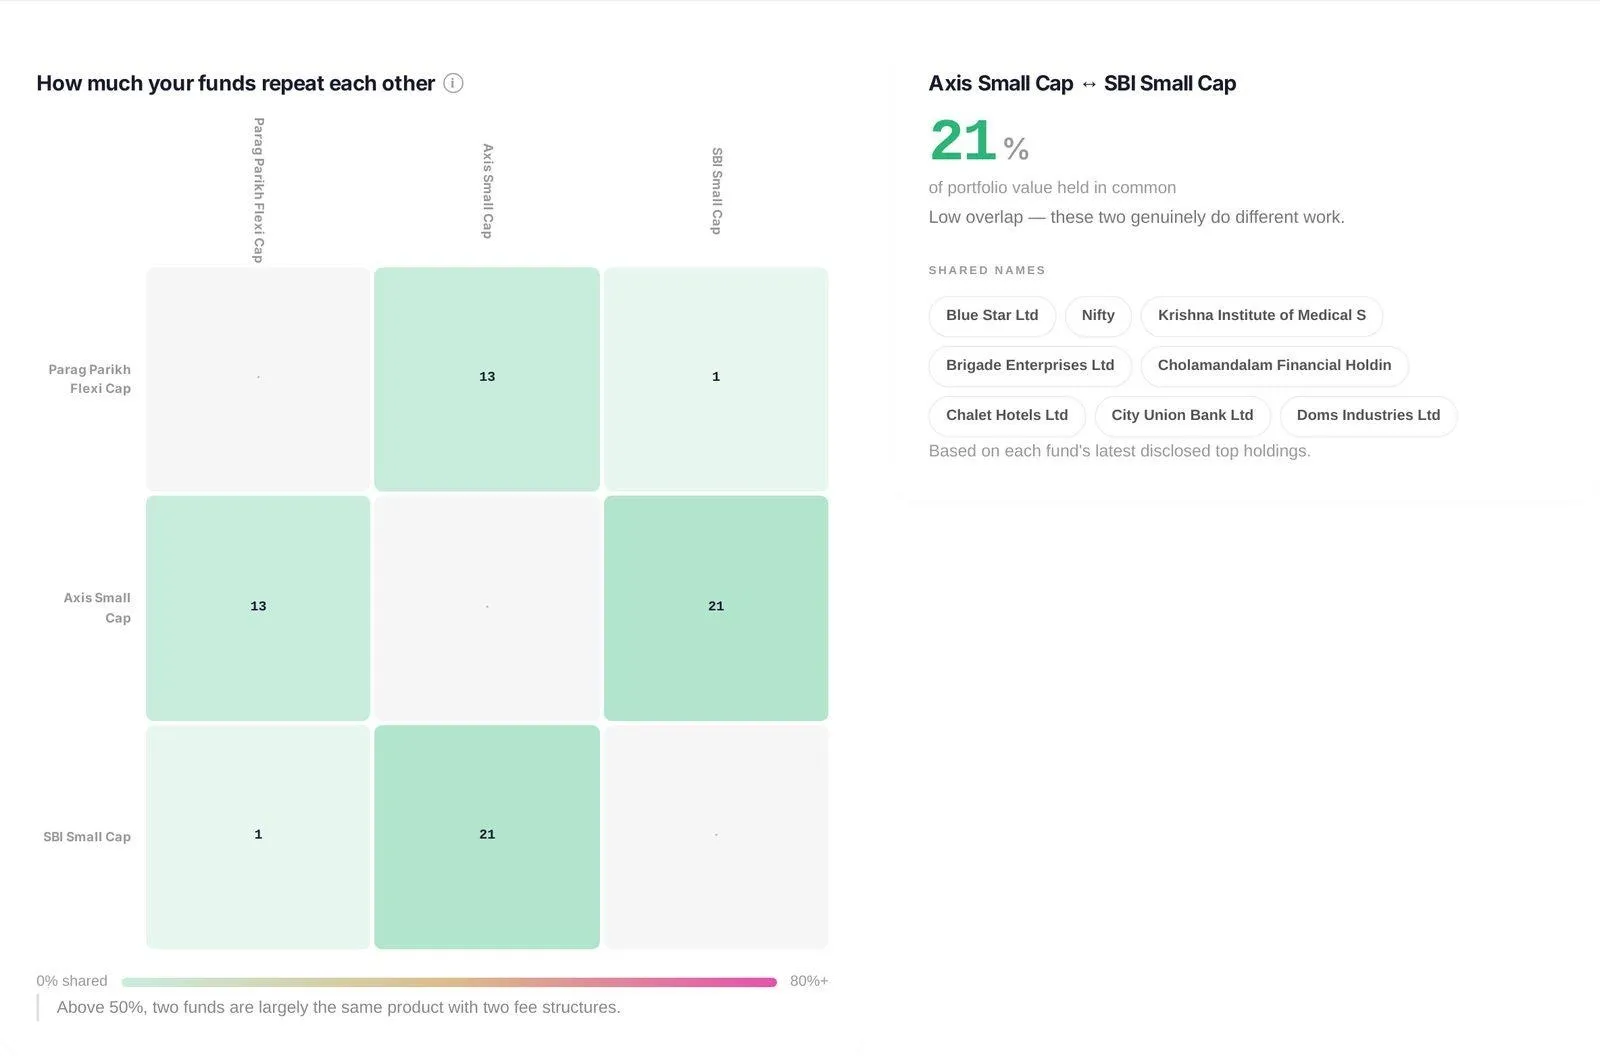
The fund overlap matrix with a side panel listing shared holdings
Each equity fund against every other, built from each fund's latest disclosed holdings. The number in a cell is the percentage of portfolio value the two funds hold in common; the colour reads it on a continuous scale from 0% shared to 80%-plus, with the line drawn at 50%: above that, two funds are largely the same product with two fee structures. Click any cell and the panel lists the actual shared names. Here, Axis Small Cap and SBI Small Cap share 21% — genuinely different work, and the tool says so rather than manufacturing a problem.
What the fees really cost
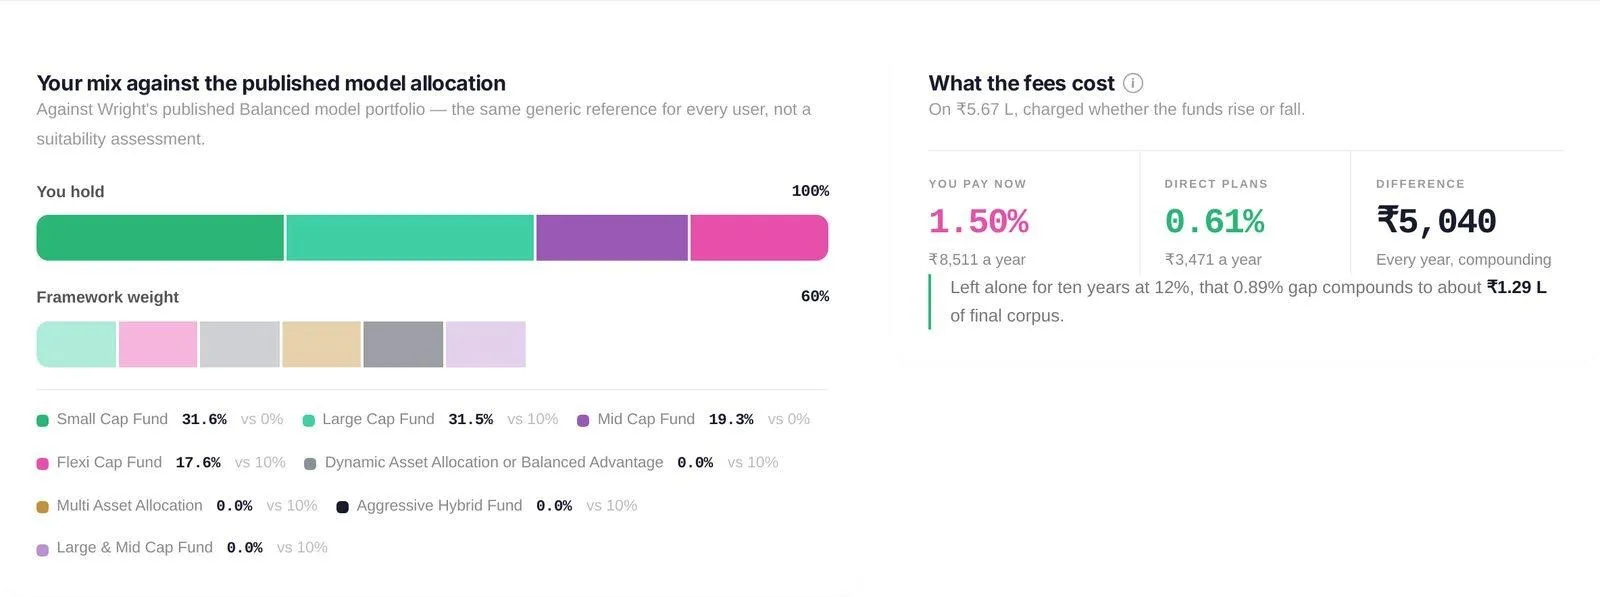
Category mix against the published model allocation, and the fee comparison
Two things side by side. On the left, your category weights against Wright's published Balanced model portfolio — the same generic reference for every user, explicitly not a suitability assessment. On the right, the fee arithmetic in three numbers: you pay 1.50% a year (₹8,511), the direct plans of the same schemes charge 0.61% (₹3,471), the difference is ₹5,040 — every year, compounding. Left alone for ten years at 12%, that 0.89% gap costs about ₹1.29 lakh of final corpus. Because the comparison uses the actual expense ratio of the direct twin of the same scheme, it is like-for-like: same fund, same manager, same stocks, different price tag.
Are the funds earning their fee?
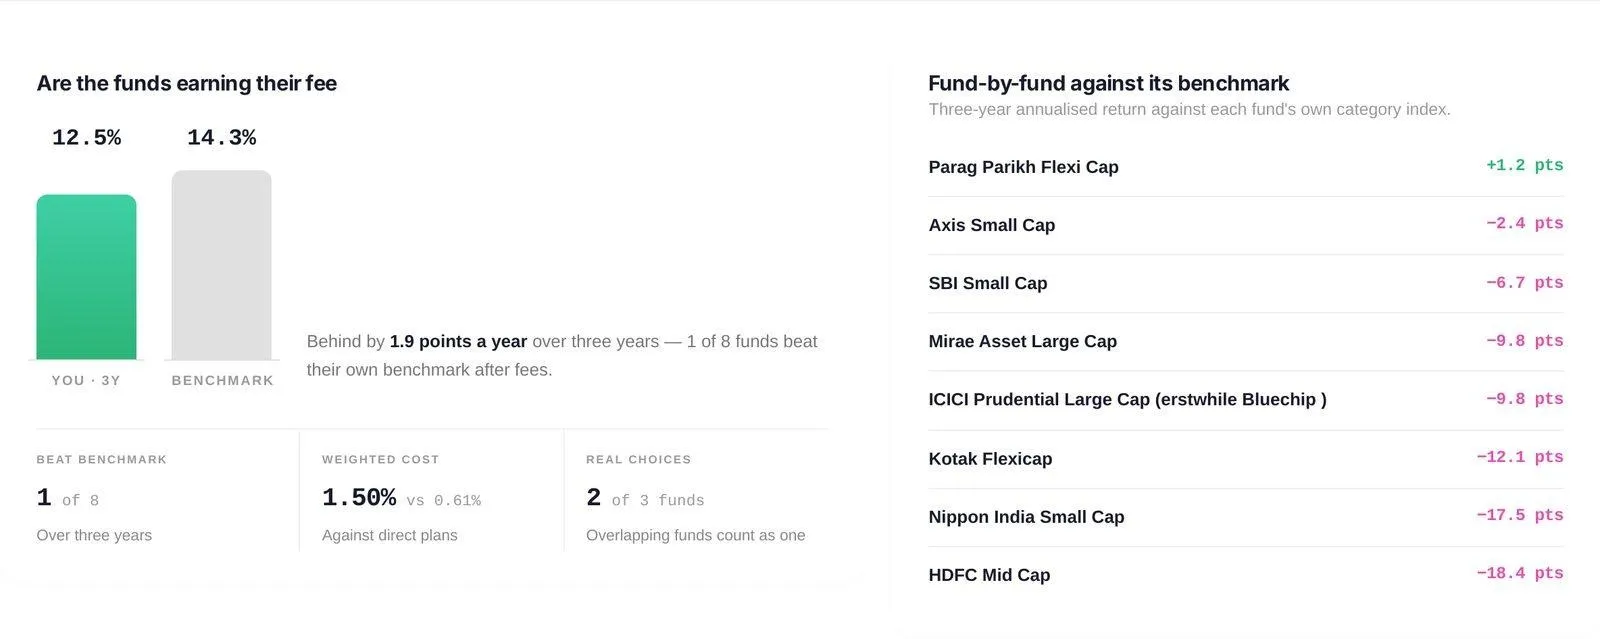
Three-year returns against benchmark, with a fund-by-fund ranking
Weighted three-year return against each fund's own category index — behind by 1.9 points a year here, with one of eight funds beating its own benchmark after fees. The ladder beside it ranks every fund by how far it sits above or below its benchmark, from Parag Parikh Flexi Cap at +1.2 points to HDFC Mid Cap at −18.4.
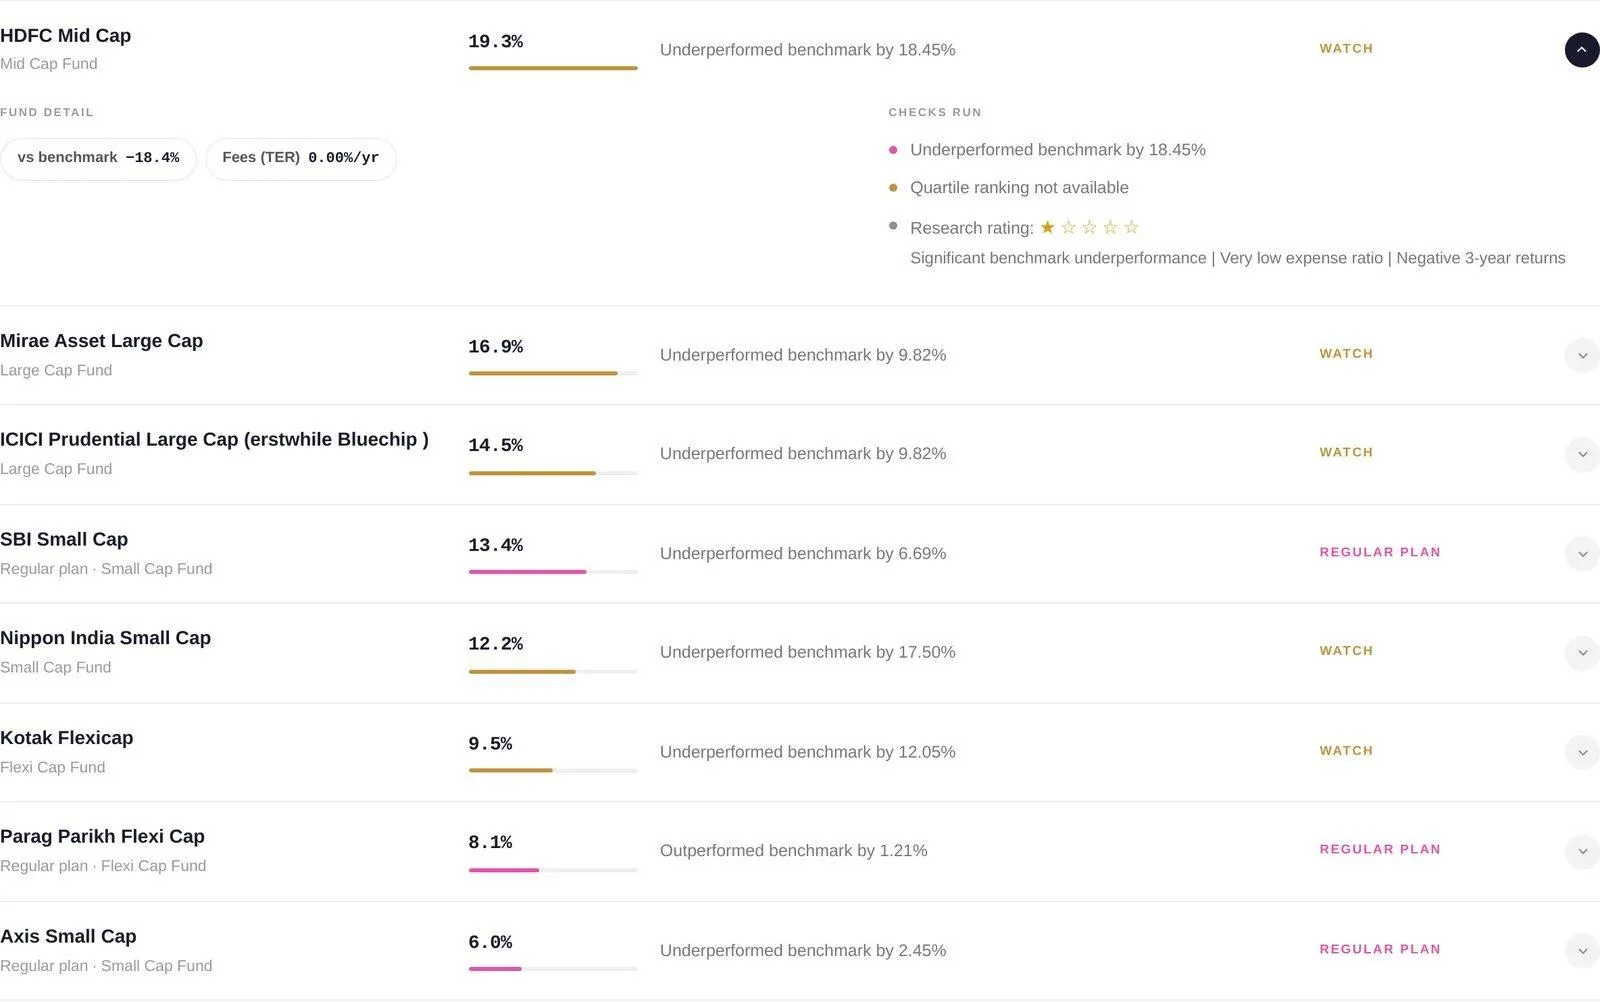
The fund list with weights, flags and status chips
And then, as with equity, every fund line by line: weight, what the checks flagged, and a chip — Regular plan or Watch. Open a row for the return against benchmark, the expense ratio, and — on a regular plan — the rupee gap against the direct plan on your own holding, plus a star rating with the factual reasons printed beneath it. The same three crash replays run here too, on each fund's NAV history — and where only a fraction of today's funds existed through an episode, the table says exactly that instead of quietly filling the gap.
What's free, and what isn't
The hero card, the headline and the flag summary are free on both tabs. The line-by-line detail, the fee arithmetic, the overlap matrix and the crash replays sit behind a single unlock: book a free call, or unlock it for ₹500. One payment covers both reviews for a month. Unlocking signs our Research Analyst Terms & Conditions with an email OTP — no KYC form and no risk questionnaire, because research doesn't require one.
Is your portfolio built for what’s coming?
Get a free AI-powered review of your holdings — risk, overlap and quality in minutes.
Where the numbers come from
Live prices and NAVs; each fund's latest disclosed holdings; Wright's own factor scores, research ratings and published model portfolios; and full daily price and NAV history back to 2017 for the crash replays. The design principle underneath all of it is a single rule: every number is a fact measured against a published yardstick that is the same for every user. No suitability language, no "for you", no instruction to buy or sell.
That is a deliberately narrow promise, and it is the useful one. A review that told you what to do with a portfolio it had known for four seconds would be worth less than one that shows you, precisely and without flattery, what you are holding.
Run yours — it takes about a minute. Import from your broker or MF Central, or drop in the file your broker already gave you.


