

Statistical analysis heavily depends on the Z-score, which is an important tool to understand data distribution. But its usage does not just stop with the theoretical calculation; rather, it is highly applicable in the stock market as well. A z-score financial analysis gives a comprehensive view of a company's credit risk and possibilities of experiencing financial distress, basing this on key financial ratios. It provides a company with the essential understanding of its financial health and stability. This is sort of a financial X-ray, showing the hidden vulnerabilities and strengths that might not be that apparent from traditional financial statements.
Why has z-score analysis become so widely used? The answer is in its capability to provide an objective and standardized measurement of financial health. That is, by comparing a company's z-score with established benchmark values, investors and analysts can quickly determine the risk position of that company relative to others. This allows for informed decision making, whether it is on investment opportunities, creditworthiness, or the predictability of financial distress.
This blog post will equip you with the information to understand and apply z-score analysis. We'll take the mystery out of the z-score formula, instruct you as to how you might calculate the z-score for any company and illustrate its practical application in a clear example of z score. Along the way, we will explore what does z score mean and how you interpret it. By the end, you will have understood what z-score means and why it is important in informed investment decisions.
What is Z-Score Analysis?
Consider a student's test score. Knowing the raw score doesn't tell you much. You have to know how it compares to the class average to understand its significance. That's where the z-score comes in. It tells you how many standard deviations away from the average, or mean, score that student's score lies.
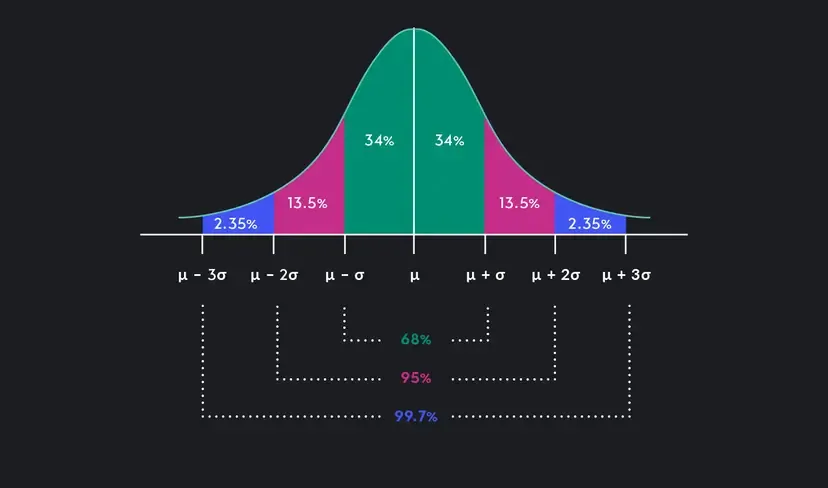
This same concept is applied within the financial world to a firm's performance. Instead of test scores, we make analyses regarding profitability, liquidity, and leverage ratios in financial performance. The z-score derived through this financial analysis lets us know by how many deviations from a standard a firm's financial health deviates away from those of similar companies. Therefore, a more significant deviation would mean superior financial health and lower probabilities of debt, while fewer deviations in the z-score might give a signal toward financial distress.
In other words, z-score analysis standardizes an approach in comparing the given company's financial performance versus its peers to evaluate whether it carries a relatively significant risk.
See what markets are pricing in
Live indices, sector moves and market breadth — the backdrop to every story we publish.
Applying Z Score Analysis to Stocks
The Altman Z-score is a widely used metric in stock market and company analysis to gauge a company's financial health and predict the likelihood of bankruptcy. Developed by Edward Altman in 1968, this model analyses five key financial ratios from a company's financial report, incorporating them into a weighted formula to generate a Z-score. The Z-score's effectiveness in predicting bankruptcy is well-documented. Studies show a 72% accuracy rate in predicting bankruptcy two years in advance.
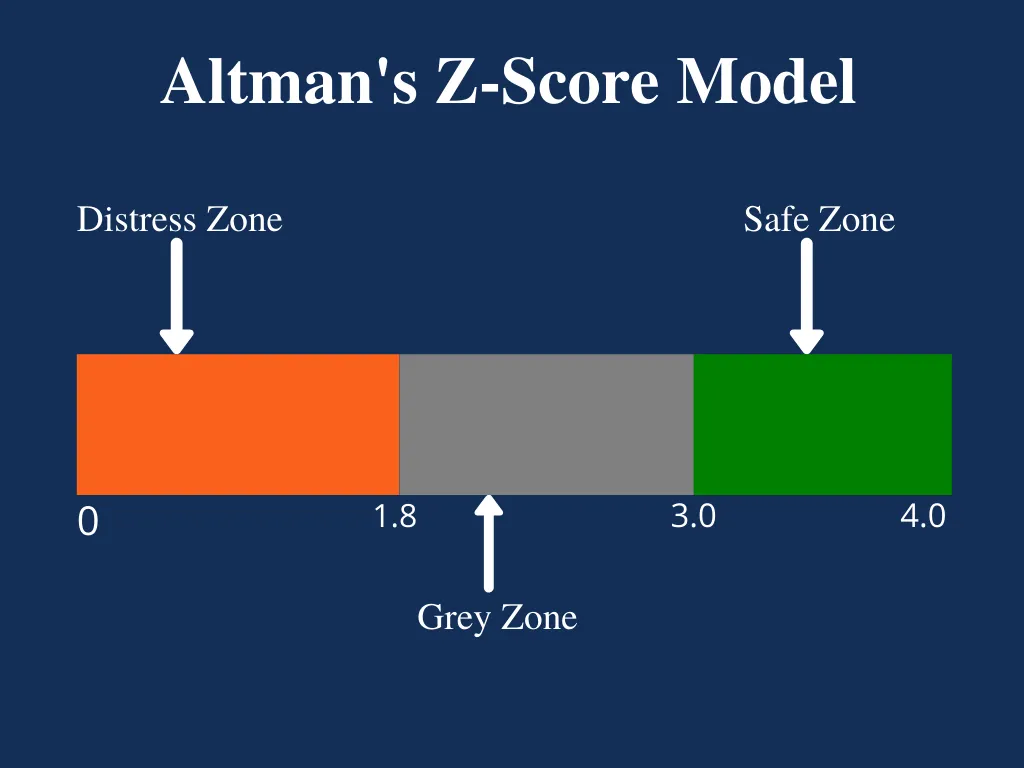
Z-score above 3: Indicates the company is in a safe zone and bankruptcy is unlikely. This makes the company's stock potentially attractive to investors.
Z-score between 1.8 and 3: Represents a grey area with a moderate risk of bankruptcy. Investors should proceed with caution when considering such companies.
Z-score below 1.8: Signals financial distress and a high probability of bankruptcy. This is a red flag for investors, who might consider selling their stock to avoid potential losses.
Five Key Financial Ratios of Z-Score Explained
The Altman Z-score formula incorporates five crucial financial ratios, each providing insights into different aspects of a company's financial stability.
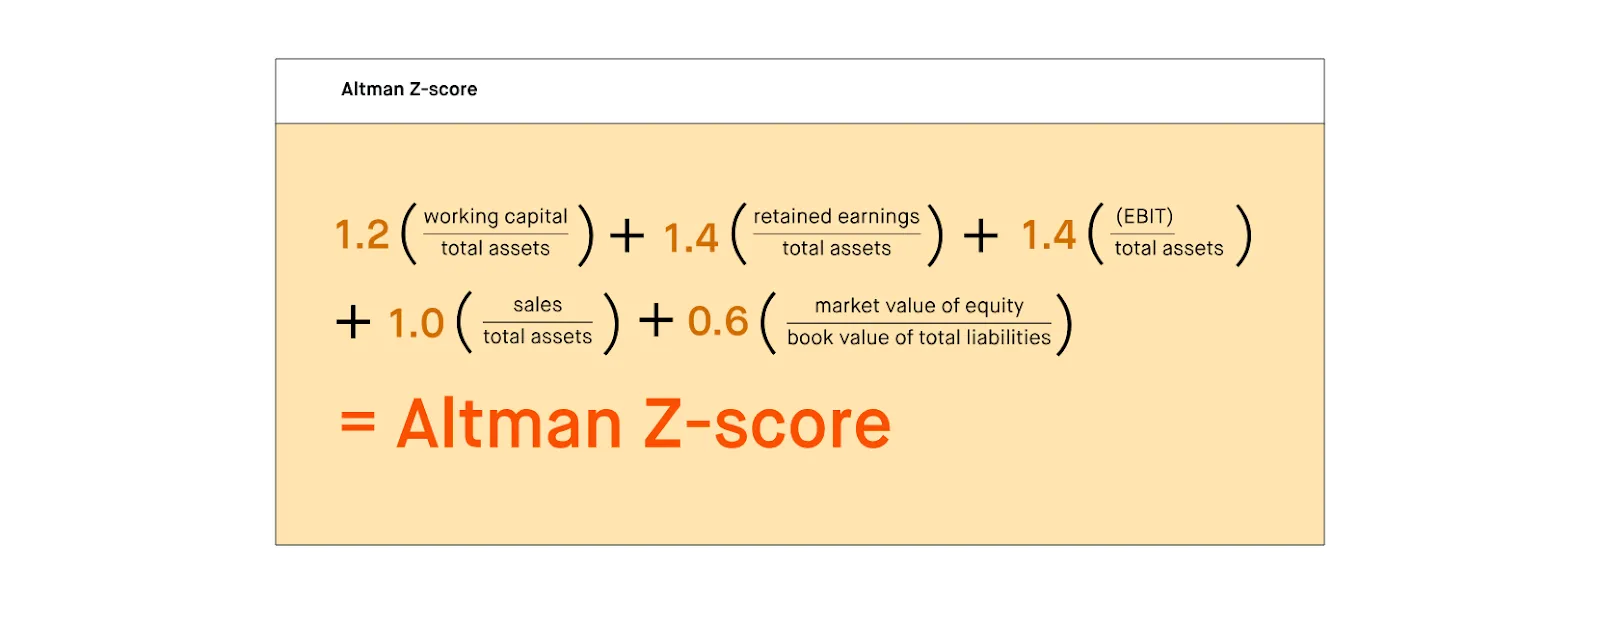
Working Capital/ Total Assets: Measures the company's short-term liquidity. A positive ratio suggests the company can meet its short-term obligations, while a negative ratio indicates potential struggles.
Retained Earnings/ Total Assets: Reflects the company's profitability and internal financing capacity. A high ratio indicates the company is using profits to fund its operations and growth, reducing reliance on external borrowing.
Earnings Before Interest and Tax/ Total Assets (EBIT/ Total Assets): Shows the company's operational profitability and ability to generate enough revenue to cover operating expenses and debt payments.
Market Value of Equity/ Total Liabilities: Represents investor confidence in the company's financial strength. A high ratio suggests investors perceive the company as financially stable and with a low bankruptcy risk.
Sales/ Total Assets: Measures the company's asset management efficiency and ability to generate revenue from its assets. A high ratio indicates efficient asset utilization, contributing to profitability.
Calculating the Z-Score
The Altman Z-score formula is:
ζ = 1.2A + 1.4B + 3.3C + 0.6D + 1.0E
Where:
ζ (Zeta) is the Altman's Z-score.
A is the Working Capital/Total Assets ratio.
B is the Retained Earnings/Total Assets ratio.
C is the Earnings Before Interest and Tax/Total Assets ratio.
D is the Market Value of Equity/Total Liabilities ratio.
E is the Total Sales/Total Assets ratio.
While seemingly complex, the calculation is straightforward once the necessary financial figures are obtained from the company's financial statements. The sources mention online calculators and Excel spreadsheets as tools for easy Z-score calculation.
What are the Benefits of Z-Score Analysis?
Z-score analysis benefits trading and finance market in many ways. Some of these benefits are listed below:
Objective Evaluation: It offers a standardized and objective measure of the financial condition of any company, which can then be objectively compared across different companies and industries. By so doing, any reliance on the individual's interpretations of financial statements is avoided.
Early Warning System: The lowering of the z-score might be regarded as an early warning that financial distress may become viable. This gives investors and creditors time to act to minimize their exposure. It is like a financial radar that detects storms beforehand.
Credit Risk Assessment: This is the z-score analysis carried out by lenders to evaluate creditworthiness. A greater z-score means a reduced amount of credit risk. The tool is very helpful to the loan underwriter for risk management.
Investment Analysis: Using z-score analysis, investors can get undervalued companies that show stronger fundamentals. This helps investors take wiser investment decisions and yield potential higher returns.
Portfolio Management: The inclusion of z-score analysis in the process of portfolio management makes the investor add more diversified assets and lower the overall portfolio risk. Portfolio management becomes much more secured.
Benchmarking: As z-score analysis permits companies to benchmark their performance against various industry averages and identify a place where there is opportunity for improvement, it tends to strengthen financial position through enhancement of competitiveness.
Z-score analysis helps investors, lenders, and companies understand financial health very well and take more sensible decisions in this highly complex world of finance.
Get research like this in your inbox
The week’s research that mattered, in five minutes. Joined by 2L+ investors.
Applications of Z-Score Analysis
This can standardize data to enable meaningful comparison. Z-score analysis is used in a wide variety of fields, including some of the following:
Finance: The z-score analysis is used in finance for determining the credit risk of a company and the probability of its bankruptcy. This is particularly useful for investors, lenders, and credit rating agencies.
Investing: Investors use z-score analysis to find undervalued or overvalued stocks. The higher the z-score of a company compared to the industry peers, the better financially it is, and a low score may be trouble.
Statistics: A z-score in statistics indicates outliers in a dataset. Data points with a very high or low z-score are distinctly different from the mean and probably of interest.
Health: In health, z-scores are used to measure the growth and development of children. By comparing a child's measurements with standard growth charts, health care professionals can identify potential health issues.
Education: On standard tests, z-scores are applied to compare performance levels in different tests and schools so that it becomes easier to judge the abilities of a student fairly.
What are the Limitations of Z-Score Analysis?
While z-score analysis is very powerful, it's not without its limitations:
Lack of Historical Data: The z-score formula is based on past financial data, which can't be used to predict a firm's current or future performance. A sudden event or a change in market conditions can make the z-score less reliable.
Susceptibility to Accounting Manipulation: The accounting statements can be manipulated to inflate z-scores, meaning that with other considerations and due diligence in place, no investment decisions are made.
Limited Scope: The Altman Z-Score model is widely applied but was specifically developed for manufacturing companies only. The accuracy of the model may be limited when applied to companies from other sectors, such as financial institutions or service providers.
Not solely determining: Z-score analysis cannot be the sole determining factor for investments or credit. There are several other factors, including the qualitative aspects of the management of a company, competitive landscape, and industry trends.
Vulnerability to Outliers: Outliers in data could significantly impact the z-score, thereby sometimes proving to be misleading to some extent.
Not a Guarantee: The Z-score is not a foolproof predictor of bankruptcy. External factors like natural disasters and unexpected economic downturns can impact a company's financial health regardless of its Z-score.
Limited Applicability to New Companies: The model might not be suitable for evaluating new companies as their finances tend to be more volatile and might not have established track records.
Despite all these, z-score analysis is useful in the assessment of the financial health of an entity and therefore in making a good decision. By knowing what its limitations are, investors and analysts can have a more holistic view of a company's financial standing by using this with other analytical methods in mind.
The Bottom Line
Z-score analysis is a very powerful tool for assessing financial health and making informed decisions in the finance market. It provides a standardized measure of financial risk, enabling investors, lenders, and companies to gain valuable insights into a company's creditworthiness, potential for financial distress, and overall stability. However, it is important to remember that z-score analysis does not prove to be a foolproof tool. It must be applied with other analytical tools and qualitative estimates. You may understand its applicability, its limitations as well as learn the accurate interpretation of z-score meaning to avail of this useful metric that may help in navigating this maze of the financial world and making decisions.
Is your portfolio built for what’s coming?
Get a free AI-powered review of your holdings — risk, overlap and quality in minutes.
Frequently Asked Questions
How do you work out the Z-Score step by step?
To work out the z-score for a company's financial health, you'll need to collect the required financial data and apply the Altman z-score formula:
Collect data: Get the firm's annual statements and pull out the amount of the five key ratios: Working Capital / Total Assets, Retained Earnings / Total Assets, Earnings Before Interest and Taxes / Total Assets, Market Value of Equity / Total Liabilities,1 and Sales / Total Assets.
Putting it all together: Replace the amounts with the Altman Z-Score formula: Z-Score = 1.2A + 1.4B + 3.3C + 0.6D + 1.0E, Where A, B, C, D, and E are the individual financial ratios.
Explanation of results: Determine if the obtained z-score falls into the following range
Z-score < 1.8 : Highly vulnerable to financial stress
1.8 < Z-score < 3.0: gray zone; that is a bit above, moderate
Z-score > 3.0: safe with little possibility of having a financial distress.
What is Z-Score Formula?
A formula of the basic form for calculating a z-score is in statistics:
Z-Score = Data Point – Mean/ Standard Deviation
This formula determines how many standard deviations away from the mean a data point is. In finance, Altman Z-Score formula is utilized in computing the credit risk of a firm:
Z-Score = 1.2A + 1.4B + 3.3C + 0.6D + 1.0E
A, B, C, D, and E represent some financial ratios that specifically have relation to liquidity, profitability, solvency, and efficiency.
What is a Z-Score of 0?
The z-score of 0, for the general statistics, means the data point equals the mean. For financial health by the Altman Z-Score, a score of 0 is below the threshold of 1.8 and thus at risk of facing financial distress.
What is the Altman Z-Score in finance?
Altman Z-Score is a statistical model predicting the possibility of the bankruptcy of any firm in the near 2 years of future operations. It is an empirical model developed by Edward Altman in 1968. Five key financial ratios determine this z-score, where different ratios have different weight assignments, showing their weight in prediction regarding the possibility of distress in firms' finances. The z-score provides an objective measure of a company's financial health and helps investors, lenders, and credit rating agencies assess the risk.


