The recent downgrade of the US credit rating by Fitch to 'AA+' has had widespread consequences on global markets, with a ripple effect even reaching emerging markets such as India. On August 2nd, the Indian market experienced a sharp drop, mirroring the reactions in other Asian and European markets. The downgrade's immediate impact was a reflection of the underlying concerns about the US's fiscal challenges, including rising debt levels and the projected risk of recession.
However, emerging countries like India are uniquely positioned in this scenario, showcasing resilience and attracting attention as a promising destination for global investments. Several factors contribute to India's appeal despite the downgrade's global implications. The country's economic reforms over the last decade, robust earnings momentum in various sectors, and a favorable inflation trajectory have strengthened its position in the international arena. Moreover, India's strategic alignment with the multipolar world dynamics, coupled with a decline in its correlation with external factors, has significantly diminished its vulnerability to global economic shifts.
The downgrade in the US credit rating , while posing challenges for the US bonds and treasury bills, is also seen as an incentive for global investors to explore diversification. The necessity for investors to consider emerging markets, particularly India, stems from the potential growth opportunities and the prospect of superior returns. Investment strategies that reflect this shift are evidenced by entities like Morgan Stanley upgrading India to 'overweight' and recognizing its promising demographic profile. All of this raises the question, do emerging markets like India present a better opportunity amid global changes?
Emerging market stocks are catching the eyes of investors around the globe, signaling a shift from bonds to stocks as growth bets return. This shift is influenced by a combination of macroeconomic factors, promising growth forecasts, and a burgeoning confidence in emerging economies. Here’s an in-depth look into what is causing this shift and why emerging-market equities such as India, China, Egypt and more are suddenly so appealing. Read this article, to learn more about How the US Credit Rating Downgrade Affects India?
From Bonds to Stocks: A Momentous Shift
Investors in emerging markets have traditionally been drawn to local-currency bonds, which were considered a standout trade. However, since July, equity benchmarks have outperformed local-currency bonds, signifying an essential change in investment patterns.
For instance, the MSCI Emerging Markets Index rallied almost 6% last month, the best performance since January. Conversely, indexes of dollar and local-currency EM debt gained less than 2%. It appears that stocks are not only catching up with bonds but overtaking them.
According to reports, emerging-market equities absorbed $4.1 billion in the week to August 2nd, showing that traders are already starting to chase the rally. While some investors argue that bonds still have potential, the bigger gains are predicted to come from stocks.
Economic Growth in Emerging Economies
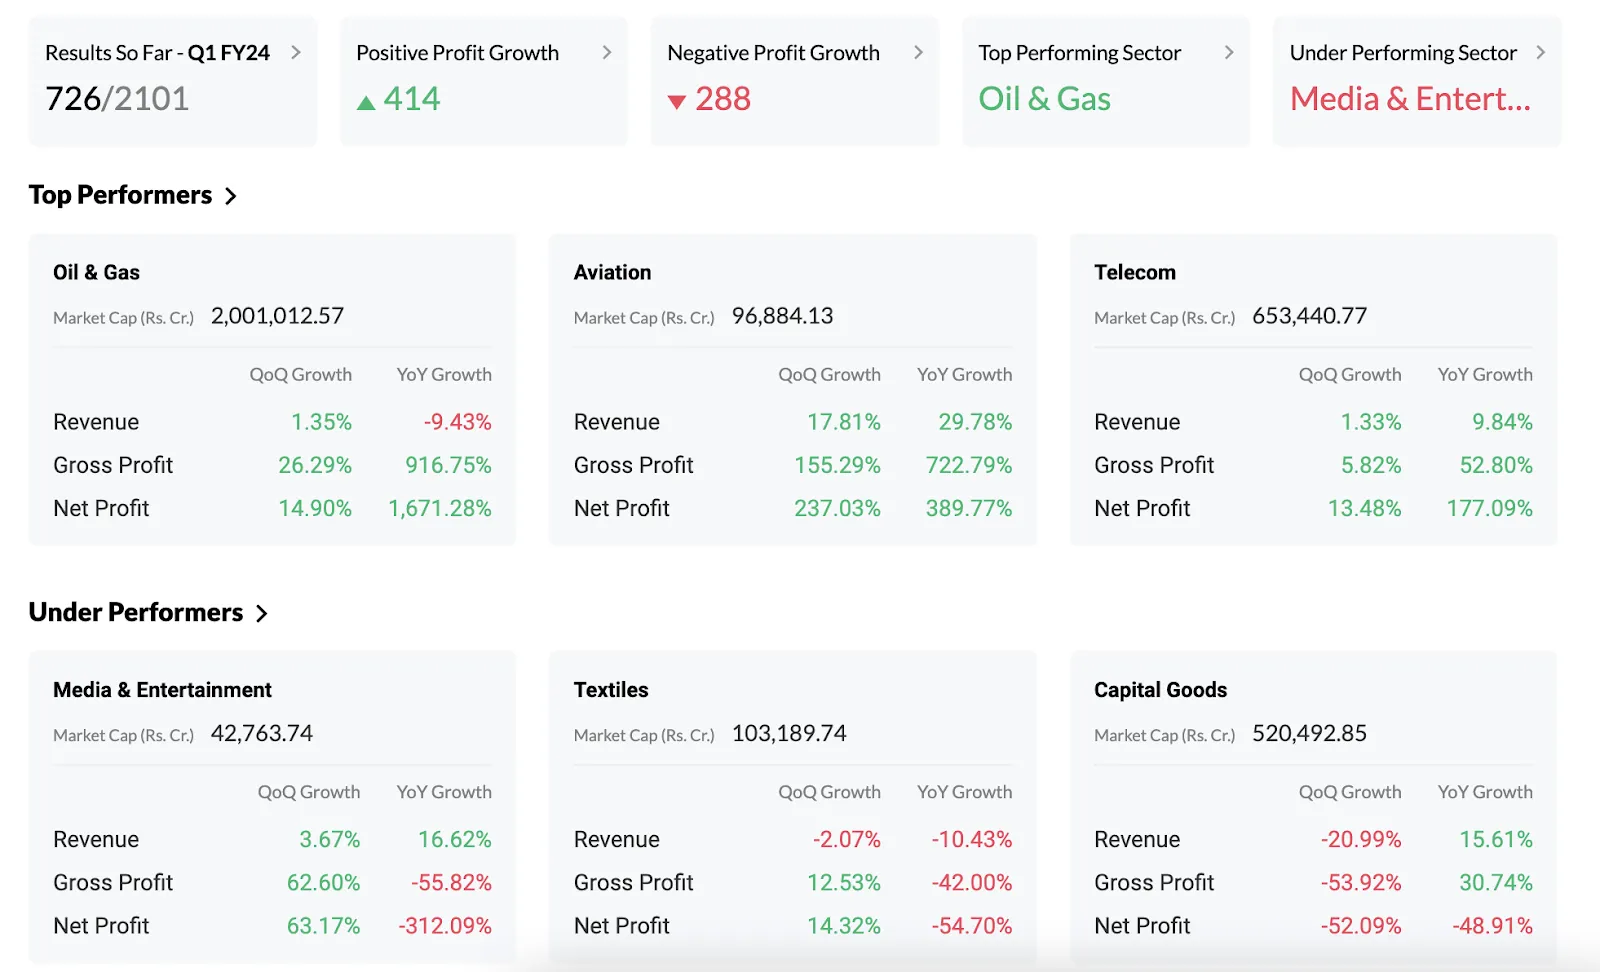
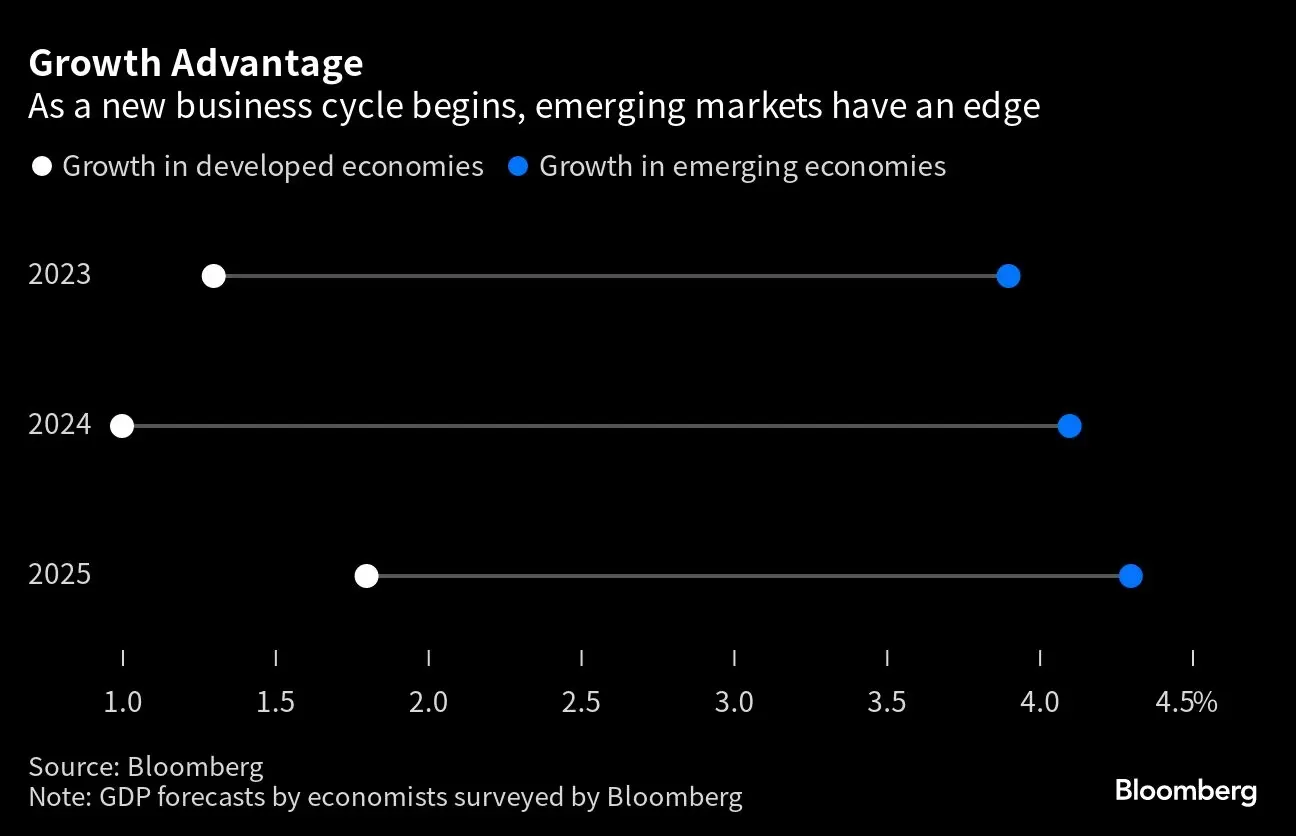
Developing nations are expected to expand almost three percentage points quicker than advanced nations over the next three years. China and India are leading this expansion, although at a slower pace. Even so, analysts have raised their forecasts for earnings in July at the fastest clip in 18 months.
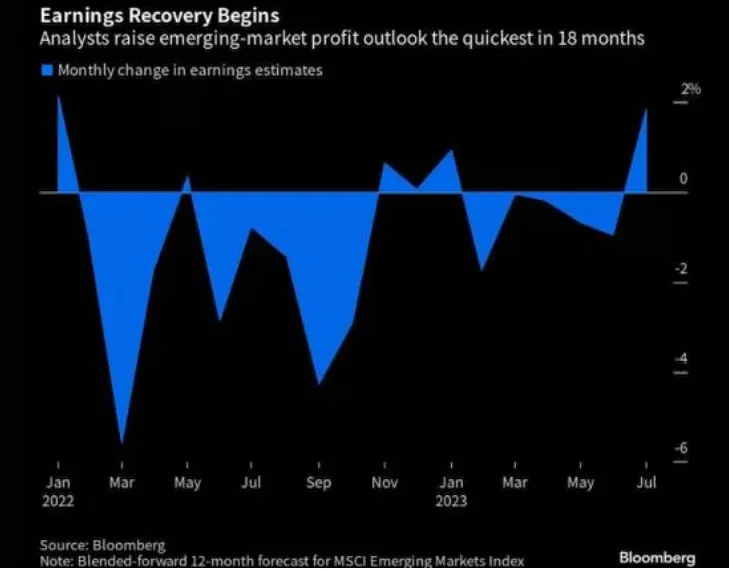
Main drivers for equity performance will be a benign macro environment in countries like India, Brazil etc. along with strong earnings growth - as we have seen for India this quarter. This growth in emerging economies is appealing to investors looking for lucrative opportunities beyond the established markets.
The Appeal of Chinese and Latin American Stocks
Furthermore, a staggering $5.7 trillion selloff last year has left emerging-market equities under-owned by global investors by some $600 billion. With about $2.5 trillion in cash parked by money managers in the US, there is a wave of capital that could flow back into developing-nation equities.
As a result, countries like Egypt, Nigeria, Pakistan, and Turkey may benefit if we have seen a peak in US rates. Larger emerging markets like China, Taiwan, and South Korea may be favored for their dependence on the manufacturing-export sectors.
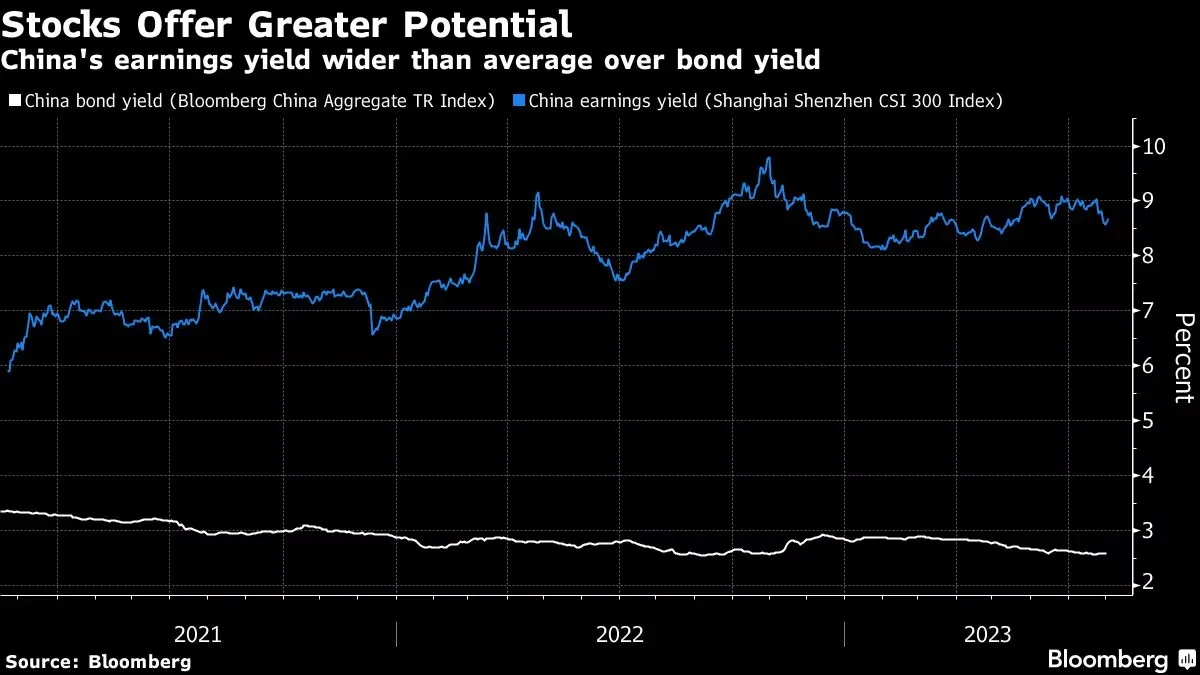
In some emerging markets, stocks offer potential returns far above bonds. For example, China’s CSI 300 Index trades at an earnings yield of 8.6%, doubling the gap with Chinese bonds in the past two years.
Additionally, investors are showing a particular interest in Latin American stocks. Brazil’s benchmark trades at a 25% discount to its average valuation of the past 10 years, and policymakers have delivered a bigger-than-forecast rate cut. These appealing valuations are driving investment in the region. The question I suppose is where to invest between India and China right now?
China Or India? How To Invest In The Coming Asia Boom
The world's eyes are firmly set on the East as India and China emerge as the giants of the investment landscape. Both nations boast impressive growth narratives, but how should investors navigate these promising markets?

India has now edged past China with a population of 1.43 billion, making it the world's most populous country. With a young workforce, India's share of global equity market capitalization is expected to quadruple by 2075, reaching parity with China at 12%. Meanwhile, the US share is projected to halve.
India: The Young Giant
India's growth is propelled by friendly relations with the West and a young, vibrant workforce. Goldman Sachs expects India's economy to grow 6% to 7% annually, outpacing China's, driven by increased consumer spending and emerging middle-class demand beyond essentials. Manufacturing shifts from China are also favoring India, making it one of the best structural growth stories globally.
Efforts by the Indian government to encourage investment are gaining traction, with more global companies like Apple and Tesla looking to India for their manufacturing needs. This trend of increasing foreign inflows is projected to continue.
Recently, Morgan Stanley has upgraded India to 'overweight', which signifies a growing optimism towards the Indian economy. The reasons cited for this upgrade include sustained superior dollar EPS growth against emerging markets and a promising demographic profile that supports equity inflows. According to Morgan Stanley, India's economy is experiencing a surge in foreign direct investment, with the country leveraging multipolar world dynamics to its advantage. India's economic indicators continue to show resilience, with the country on track to achieve a forecasted 6.2% GDP growth.
China: The Seasoned Player
As the world's second-largest economy, China showcases a vast consumer market and cutting-edge manufacturing. Although its aging population could potentially hinder growth, the country's focus on domestic consumption, industrial upgrade, and embracing new technologies could drive future prosperity. China's equity valuations are currently low, making it attractive for the next 12 to 24 months.
Morgan Stanley has downgraded China to 'equal-weight' due to concerns over growth and valuation. This move underlines the comparative advantage that India currently holds in the global market scenario.
Both Markets: Scale, Growth, and Profitability
Investors don't necessarily have to pick one over the other, as both markets follow their dynamics. Demographically, India might be in a better place, but the size of the Chinese market keeps it highly relevant. The two markets provide a combination of scale, growth, and profitability, catering to various investor preferences and risk profiles. While China focuses on domestic consumption and technological advancements, India's booming population and growing affluence are driving its investment landscape. Portfolio managers and investors see opportunities in both markets, with sectors like technology, finance, real estate, and consumer goods expected to reap the benefits of these shifts.

The choice between China and India isn't binary; both have their unique advantages. What's paramount is a well-calibrated, research-driven approach, understanding regional dynamics, economic policies, market trends, and valuations. India or China? It might not be a question of either/or but rather a strategic blend of both, leveraging the best of what these rising Asian giants have to offer. Whether it's internet bets like Tencent and Trip.com or the Indian conglomerate Reliance Industries, there's something for every portfolio in the coming Asia boom.
Looking Forward
Various emerging markets are facing pivotal moments with upcoming data and policy decisions. From China's complex economic indicators to Egypt's inflation battle, India's cautious monetary stances, Mexico's inflation balancing act, and Turkey's return to economic orthodoxy, the global economic landscape is entering a critical phase. These elements will significantly influence both domestic and international financial markets, making them key areas to watch for investors and policymakers. Let’s understand some key upcoming events -
India: Reserve Bank’s Decisions
Interest Rate and Reserve Requirements: The Reserve Bank of India's decisions on interest rates and banks' reserve requirements could signal a change in economic policy and affect lending capacities, impacting overall economic growth.
China: Bracing for Key Economic Data
Deflation, Credit Growth, and Trade Contraction: China's anticipated data on deflation could affect economic stimulus, while a slowdown in credit growth might impede business expansion. Shrinking trade may impact global trade dynamics and commodity-exporting nations.
Egypt: Inflation Figures and Rate Hikes
July Inflation Figures: Egypt's release of inflation statistics, following an unexpected rate increase to combat 36% inflation, may lead to ramifications such as currency devaluation and altered international trade.
Turkey: Data Releases and Economic Orthodoxy
Industrial Output and Policy Changes: Turkey's projected contraction in industrial output could indicate underlying economic weaknesses, while forthcoming policy changes aiming for economic orthodoxy could boost investor confidence but pose transitional challenges.
Mexico: Banxico's Monetary Policy
Benchmark Rate: Mexico's central bank, Banxico, may maintain its benchmark rate, providing stability but possibly raising concerns if inflation continues to persist.
Let’s also take a look at how our portfolios have performed in this time.
Wright Balanced Smallcase Performance
In the challenging market conditions, the Wright Balanced Multifactor Smallcase demonstrates resilience and strategic acumen, consistently outperforming both the Multi Cap and Large Cap Indexes. Over the past month, it achieved a commendable return of 8.8%, in contrast to the 4.7% and 2.9% returns for the Multi Cap and Large Cap Indexes, respectively.

The Wright Balanced Multifactor Smallcase 's triumphant performance continues across a three-month period, with an impressive 25.7% return, easily besting the Multi Cap and Large Cap Indexes' returns of 14.4% and 9.3% respectively.
MTD | 1-mth | 3-mth | 6-mth | |
Balanced | -2.0% | 8.8% | 25.7% | 29.8% |
Multi Cap Index | -1.1% | 4.7% | 14.4% | 17.4% |
Large Cap Index | -1.2% | 2.9% | 9.3% | 11.8% |
Even more notable is the six-month performance, where the Balanced Portfolio soared with a return of 29.8% against the more subdued gains of 17.4% and 11.8% from the Multi Cap and Large Cap Indexes. These results stand as a testament to the sound investment strategies underpinning the Balanced Portfolio's success.
Here's a Complete guide to Factor Investing & Wright Balanced Multifactor Portfolio .
Wright Momentum Smallcase Performance
The Wright Momentum Smallcase continues its legacy of success, with strong performances outpacing both the Multi Cap and Large Cap Indexes. In the past month, the Momentum Portfolio delivered a return of 8.9%, outshining the 4.7% and 2.9% returns by the Multi Cap and Large Cap benchmarks.
MTD | 1-mth | 3-mth | 6-mth | |
Momentum | -1.6% | 8.9% | 24.1% | 27.0% |
Multi Cap Index | -1.1% | 4.7% | 14.4% | 17.4% |
Large Cap Index | -1.2% | 2.9% | 9.3% | 11.8% |
Across three months, the portfolio maintained its prowess, returning 24.1%, eclipsing the 14.4% and 9.3% returns of its benchmarks. Over the six-month span, the portfolio notched up a 27.0% gain, far outperforming the 17.4% and 11.8% returns by the Multi Cap and Large Cap Indexes.

Additionally, a long-term examination of a 10-year period (including backtested data) shows robust annualized returns of 32.3% vs 13.88% for the Multi Cap Index. This showcases the long-term growth potential of the Momentum portfolio.
10 years | Momentum | Multicap |
Annualized Returns | 32.3% | 13.88% |
Annualized Volatility | 18.6% | 16.61% |
Worst Drawdown | -24.6% | -44.75% |
Correlation to NIFTY | 56.0% | - |
Sharpe Ratio | 174.0% | 83.57% |
However, it's important to note that higher returns often come with higher risk. The Wright Momentum Smallcase has an annualized volatility of 18.6%, slightly higher than the Multicap Index's 16.61%. Yet, the Momentum portfolio experienced a worst drawdown of -24.6%, which is considerably less than the Multicap Index's -44.75%. This indicates the Momentum portfolio's better resilience during market downturns. Despite its higher volatility, the Momentum portfolio's risk-adjusted return (as measured by the Sharpe ratio of 174.0%) significantly surpasses that of the Multicap Index (83.57%). This showcases the portfolio's ability to deliver superior returns even when adjusting for the risk taken.
Here's a Complete guide to Momentum Investing & the Wright Momentum Portfolio .
Wright Smallcaps Smallcase Performance
Within the higher-risk spectrum of small-cap stocks, the Wright Smallcaps Smallcase has excelled, leaving its benchmark behind across various time frames. Over the last month, the Smallcaps Portfolio yielded an astounding 16.5% return, dwarfing the Small Cap Index's 4.7%.
MTD | 1-mth | 3-mth | 6-mth | |
Smallcaps | -0.5% | 16.5% | 32.4% | 27.1% |
Small Cap Index | -1.1% | 4.7% | 14.4% | 17.4% |
Looking at the three-month performance, the portfolio continued its robust growth, returning 32.4% against the benchmark's 14.4%. The six-month trend further accentuates the success, with the portfolio returning 27.1% compared to 17.4% by the Small Cap Index.

Analyzing the Wright Smallcaps Smallcase over the same 10-year period (including backetest data), the results are remarkable. The portfolio exhibited an annualized return of 36.8%, far outpacing the Smallcap Index's 12.70%. This performance illustrates the Smallcaps Portfolio's capacity for consistent and substantial long-term growth.
10 years | Smallcaps | Smallcap Index |
Annualized Returns | 36.8% | 12.70% |
Annualized Volatility | 21.2% | 20.66% |
Worst Drawdown | -41.7% | -65.14% |
Correlation to NIFTY | 47.6% | - |
Sharpe Ratio | 173.9% | 61.48% |
In terms of risk, the Wright Smallcaps Smallcase 's annualized volatility stands at 21.2%, only slightly higher than the Smallcap Index's 20.66%. Even more notable is the worst drawdown of -41.7% in the Smallcaps Portfolio, in contrast to a much steeper -65.14% for the Smallcap Index. This fact reflects the portfolio's superior ability to weather adverse market conditions. Additionally, the Smallcaps Portfolio's risk-adjusted return, as represented by the Sharpe ratio of 173.9%, is markedly higher than the Smallcap Index's 61.48%. This data supports the view that the Smallcaps Portfolio not only offers substantial growth prospects but also emphasizes prudent risk management, outclassing the benchmark even when accounting for the risk involved. Here's a Complete guide to Invest in Smallcap Stocks & in Wright Smallcaps Portfolio .
Wright Innovation Smallcase Performance
The Wright Innovation Smallcase , with its focus on cutting-edge technologies and emerging industries such as Fintech, electric mobility, ecommerce, green energy, biotech, EV and more, yielded a 6.8% return over the past month, surpassing the Small Cap Index's return of 4.7%.
MTD | 1-mth | 3-mth | 6-mth | |
Innovation | -0.6% | 6.8% | 26.2% | 24.9% |
Small Cap Index | -1.1% | 4.7% | 14.4% | 17.4% |
Its three-month return of 26.2% and six-month return of 24.9% consistently outpaced the benchmark's respective returns of 14.4% and 17.4%. This portfolio's performance underscores the significant potential within the innovation-focused investment strategy, capitalizing on transformative, disrupptive technologies and forward-thinking companies.
Wright New India Smallcase Performance
Embracing the opportunities within India's burgeoning sectors benefitting from government policy, Make in India and the Atmanirbhar Bharat scheme, the Wright New India Smallcase exhibited strong growth, achieving a 10.5% return over the past month, compared to the 4.7% return of the Small Cap Index.
MTD | 1-mth | 3-mth | 6-mth | |
New India | -1.8% | 10.5% | 26.9% | 30.9% |
Small Cap Index | -1.1% | 4.7% | 14.4% | 17.4% |
The three and six-month returns of 26.9% and 30.9% further demonstrate the portfolio's exceptional performance, overshadowing the benchmark's returns of 14.4% and 17.4% respectively. This data illustrates a strong alignment with the thriving segments of the Indian economy, heralding the Wright New India Smallcase as an excellent investment for capturing the region's growth prospects.
Wright Alpha Prime Smallcase Performance
The Alpha Prime Smallcase , with its limited data over a one-month period, shows promising signs, producing a 14.9% return. This result significantly eclipses both the Small Cap Index's 4.7% return and the Large Cap Index's 2.9% return over the same period.

We will continue to closely monitor the portfolio’s performance and see how it performs over the next few months.
MTD | 1-mth | 3-mth | 6-mth | 1-yr | YTD | Inception (CAGR) | |
Alpha Prime | -2.0% | 14.9% | 22.1% | ||||
Small Cap Index | -1.1% | 4.7% | 14.4% | 17.4% | 21.3% | 28.2% | |
Large Cap Index | -1.2% | 2.9% | 9.3% | 11.8% | 15.1% | -19.7% |
Despite limited data, this initial performance emphasizes Alpha Prime Smallcase 's successful investment approach, achieving remarkable growth in a short time frame. The Alpha Prime Portfolio appears well-positioned to navigate market dynamics, showing potential for future success.
To learn more about our new portfolio read this article Alpha Prime: Unveiling Our New Concentrated Momentum, High-Risk Investment Portfolio
Live AMA - Sonam X Smallcase
We also conducted a Live AMA for our audience - and it was great! We had the largest live audience till date. We answered so many pressing questions that you all had for us. And we are humbled by the love you showed me, Wright Research and Smallcase. Here are some of the key points we discussed:
✅US Credit Rating: Understand the effects of the US credit rating downgrade on Indian small-caps and how to navigate the risks.
✅India Growth Story: Explore the future of India's economy and technology endeavors.
✅Investment Strategies: Lumpsum vs SIP, rebalancing the right way, and more!
✅Special Segments: Exciting questions on our favorite investment themes, personalities, trends, and more!
✅Ask us anything: Rallying markets vs stagnant markets, PMS - Who is it for & how to invest in it , smallcap rally, Alpha Prime success and much more! Watch the full video here -
If any of these resonate with you, please do watch it. Also don’t forget to drop us a message - we love to read them!
Since we also celebrated our anniversary, here’s a special discount code you can use for subscribing to any of our portfolios and smallcases - WRIGHT4Y30 You will get 30% off on subscription fees!
About the author

Our Investment Philosophy
Learn how we choose the right asset mix for your risk profile across all market conditions.
Subscribe to our Newsletter
Get weekly market insights and facts right in your inbox