

Fund rankings changed sharply during 2026. Small-cap schemes led several year-to-date tables, while large-cap funds were more resilient in some falling markets. A five-year leader was not necessarily the best one-year performer. This is why top performing mutual funds in India must be compared by category, plan type, time period and risk.
This guide uses direct-plan growth returns reported around October 2026. Performance, assets under management and expense ratios are dated snapshots that can change. The objective is to build a repeatable evaluation process, not declare one scheme suitable for every investor.
Indian investor and research analyst comparing mutual fund returns, risk, costs and benchmarks
How We Define Top-Performing Mutual Funds
A top-performing fund should first beat an appropriate benchmark and category peer group over a meaningful period. A mid-cap fund should not be ranked against a liquid fund, and a thematic fund should not be compared directly with a diversified large-cap scheme. Their return sources and downside risks differ.
The plan and option must also match. Direct plans exclude distributor commissions and generally have lower expenses than regular plans. Growth and IDCW options distribute cash differently. All comparisons in this article refer to direct growth plans unless stated otherwise.
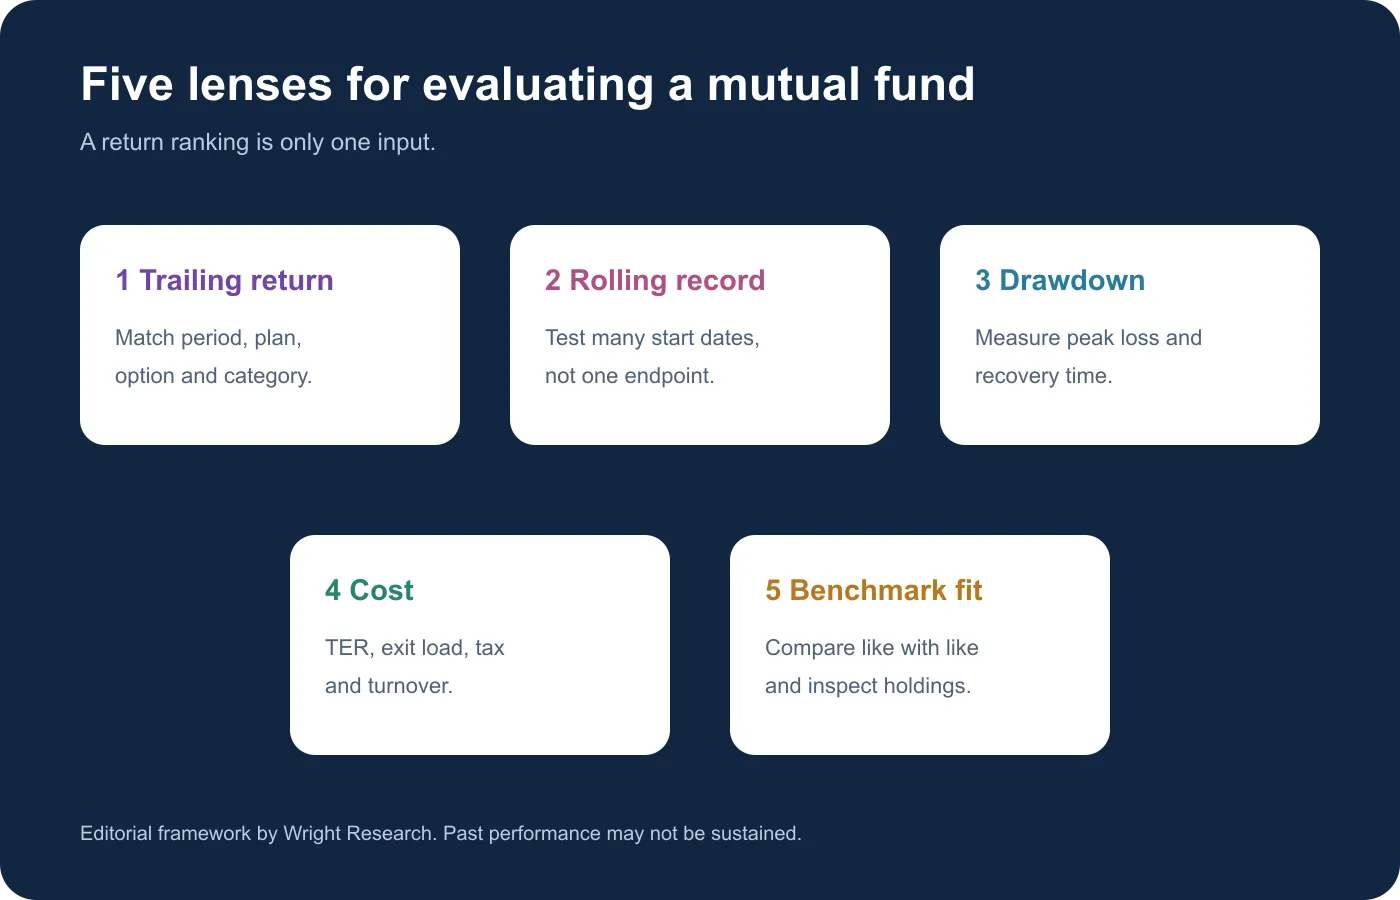
For top performing mutual funds in India, we consider trailing return, rolling return consistency, drawdown, volatility, expense ratio, portfolio concentration and benchmark-relative performance. A high rank on one date is evidence about the past, not a forecast.
Run the numbers on your next investment
Project returns on a lumpsum or SIP with our free calculators.
Top Performing Mutual Funds in India by Category
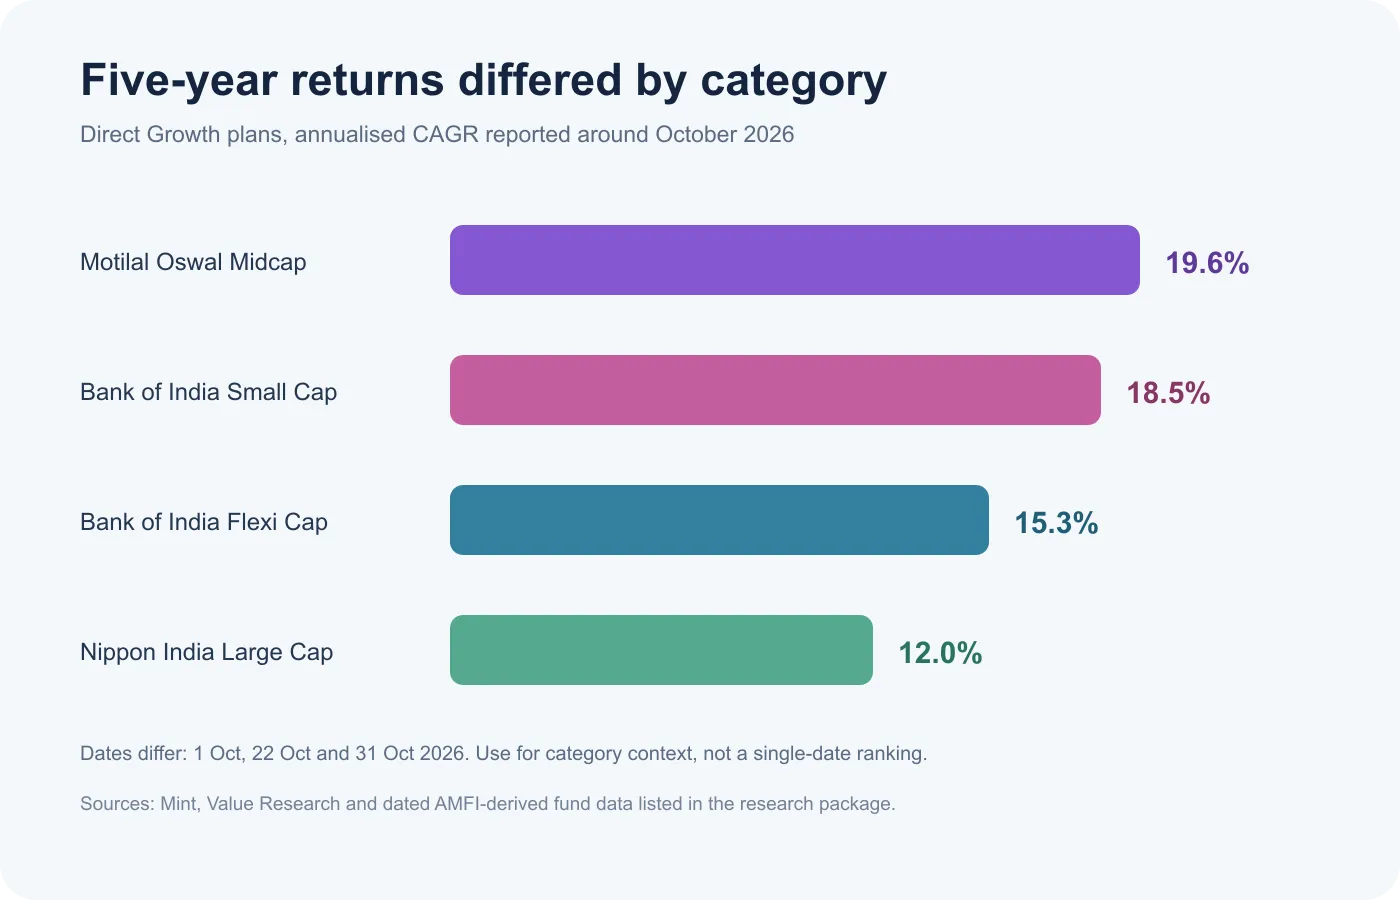
Category leadership as of October 2026 illustrates why investors need separate shortlists. Nippon India Large Cap Fund led large-cap five-year tables in late October. Motilal Oswal Midcap Fund and Invesco India Mid Cap Fund appeared near the top of mid-cap comparisons. Bank of India Small Cap Fund led several small-cap tables, while Bank of India Flexi Cap Fund ranked strongly among flexi-cap schemes.
These names are examples for research. Small-cap and mid-cap funds can experience deeper drawdowns and capacity constraints than large-cap funds. Flexi-cap managers can shift across market capitalisations, so results depend more heavily on allocation and security-selection decisions.
The phrase top performing equity funds fy26 can also be misleading. FY2025-26 is a financial-year window, while year-to-date 2026 and trailing one-year returns use different start dates. Always confirm which period a ranking uses before comparing results.
Comparison Table: Returns, Risk, Expense Ratio and AUM
The table combines direct-plan data from dated public sources. Returns are trailing five-year CAGR near October 2026; AUM and expense ratios use the latest disclosed dates available in the cited source. Figures should be refreshed before investing.
| Scheme, Direct Growth | Category | 5-year CAGR | Direct expense ratio | AUM | Riskometer |
|---|---|---|---|---|---|
| Nippon India Large Cap Fund | Large cap | 12.0% to 31 Oct 2026 | 0.88% to 30 Sep 2026 | ₹51,296 crore | Very High |
| Motilal Oswal Midcap Fund | Mid cap | 19.6% to 1 Oct 2026 | 0.92% to 22 Oct 2026 | ₹40,208 crore to 30 Sep 2026 | Very High |
| Bank of India Small Cap Fund | Small cap | 18.5% to 31 Oct 2026 | 0.81% to 31 Oct 2026 | ₹3,105 crore average, Jul-Sep 2026 | Very High |
| Bank of India Flexi Cap Fund | Flexi cap | 15.3% to 22 Oct 2026 | 0.89% to 31 Oct 2026 | Verify latest factsheet | Very High |
The highest return mutual fund in last 5 years depends on the eligible universe. A PSU thematic fund may outrank diversified funds after a sector rally, but that does not make its concentrated risk comparable. Within diversified categories, the leaders above still experienced weak or negative one-year periods.
Investors can use Wright Research’s mutual-fund platform to build a category-appropriate shortlist. The best mutual funds in India are those that match the investor’s goal, horizon and risk capacity, not merely the first row of a return table.
How to Compare 1-Year, 3-Year and 5-Year Performance
One-year return is sensitive to the starting valuation and recent market regime. It can identify current momentum or stress, but it says little about performance across a cycle. Three-year CAGR includes more environments, while five-year CAGR is more useful for equity funds because it captures a longer compounding period.
The calculation also matters. Returns longer than one year are normally annualised CAGR for lump-sum investments. SIP investors should use XIRR on their dated cash flows. A fund’s published CAGR should not be compared with a personal SIP XIRR as though they measure the same thing.
When evaluating mutual fund returns in last 5 years, check the exact NAV date and whether the scheme existed for the full period. The best performing mutual funds for last 5 years can change after only a few market sessions because both the start and end points roll forward.
The 2026 data shows this effect. Bank of India Small Cap Fund led the five-year diversified equity list on 1 October at about 20.0%, but its figure was closer to 18.5% by 31 October. This does not imply a sudden change in manager skill; the measurement window moved and markets changed.
Get research like this in your inbox
The week’s research that mattered, in five minutes. Joined by 2L+ investors.
Rolling Returns, Drawdowns and Consistency: What to Check
Trailing return uses one start date and one end date. Rolling returns repeat the calculation across many overlapping windows. For example, a five-year rolling analysis can calculate every monthly five-year period over a decade. The result shows the median, best, worst and percentage of periods in which the fund beat its benchmark.
Drawdown measures the fall from a previous peak. A fund with a 20% CAGR and a 35% drawdown creates a different investor experience from one with a 17% CAGR and a 22% drawdown. Investors may abandon the more volatile scheme at the wrong time, turning a strong published return into a poor realised return.
Consistency should be tested in both rising and falling markets. Divide the history into rolling three-year and five-year windows, then calculate how often the scheme exceeded its category benchmark and by how much. A fund that wins in 70% of windows by a modest margin may be easier to hold than one that alternates between first and last quartile. When reviewing mutual fund returns in last 5 years, also check whether the current manager and mandate covered the full period. This makes a ranking of top performing mutual funds in India more meaningful. It also prevents investors from treating high return mutual funds as a homogeneous group when their consistency, concentration and downside capture differ materially.
For debt funds, replace equity-style drawdown analysis with duration, yield-to-maturity, credit quality and stress liquidity. For hybrid funds, separate equity and debt contributions before judging manager skill. Category-specific analysis is essential because the same headline return can arise from very different risks.
For high return mutual funds, compare standard deviation, downside deviation, Sharpe ratio and maximum drawdown with category peers. Also inspect rolling alpha rather than one-period alpha. The best performing mutual funds for last 5 years should demonstrate more than a favourable endpoint.
How to Choose a Fund Beyond Past Returns
Begin with the goal. Equity funds suit long horizons and the ability to tolerate losses. Debt funds require analysis of duration, interest-rate sensitivity and credit quality. Hybrid funds combine asset classes but can still carry substantial equity risk.
Next examine portfolio concentration, turnover, market-cap exposure and fund-manager tenure. A strategy may have earned exceptional returns through a few holdings or a factor that later reverses. For index funds, tracking difference and tracking error are often more relevant than manager alpha.
Costs compound. AMFI notes that direct plans have lower expense ratios because they exclude distribution expenses and commissions. Compare the current disclosed ratio, but also review turnover costs, exit load and applicable taxes. A small annual fee difference becomes meaningful over a long holding period.
Use the Wright Research analysis tools to compare holdings and risk rather than chase high return mutual funds. A structured guide on how to choose mutual funds in India can help connect the scheme to an asset-allocation plan.
The best mutual funds in India should be understandable, sufficiently diversified for their mandate and consistent with the investor’s required return. A fund does not become suitable simply because it appears among top performing mutual funds in India for one period.
Common Mistakes When Selecting High-Return Funds
The first mistake is buying last year’s winner after a sector or style rally. Performance often mean-reverts, and new money can arrive when valuations are most demanding. The second is owning several funds with overlapping holdings, creating the illusion of diversification.
Investors also mix direct and regular returns, compare growth with IDCW, or ignore scheme mergers and mandate changes. A five-year record partly produced under a different manager or strategy needs additional context. New schemes should not be ranked with established funds using incomparable histories.
Another mistake is treating AUM as a quality score. Large AUM may improve scale but can make small-cap deployment harder. Very small AUM can increase operational or closure risk, but it does not automatically predict weak returns.
Finally, do not switch every time rankings change. Exit loads, taxes and time out of the market can damage realised outcomes. The top performing equity funds fy26 are historical leaders; the right response is monitoring, not automatic replacement.
See what markets are pricing in
Live indices, sector moves and market breadth — the backdrop to every story we publish.
FAQ
How often should mutual fund performance be reviewed?
Review the portfolio at least annually and after material changes to goals, risk tolerance, scheme mandate or fund management. Monthly ranking checks often encourage unnecessary switching.
How should investors compare mutual funds with different launch dates?
Use the longest common period, matching plan and option, and compare against the same category benchmark. Do not extrapolate a short record to five years.
Does a larger AUM mean a mutual fund is likely to perform better?
No. AUM shows scale, not future performance. It can support operating efficiency, but capacity can become a constraint in less-liquid small-cap strategies.
Should investors compare direct and regular plan returns separately?
Yes. They hold the same portfolio but have different expense ratios and NAVs. Compare direct with direct or regular with regular over identical dates.
How do exit loads and taxes affect realised mutual fund returns?
Exit loads reduce redemption proceeds when units are sold within the specified period. Taxes depend on fund classification and holding period. Both can make realised returns lower than the published scheme return.
The central lesson is that top performing mutual funds in India are a starting point for analysis. The best mutual funds in India combine an appropriate mandate, reasonable cost, repeatable process and risk that the investor can sustain.
For education only, not investment advice. Returns and scheme data change with NAVs and disclosures. Consult a SEBI-registered adviser where appropriate.