


Two mutual funds can report the same return while taking very different amounts of market risk. Alpha and beta help separate these ideas. Beta estimates sensitivity to a chosen benchmark, while alpha estimates whether performance exceeded or fell short of a benchmark-adjusted expectation.
Understanding alpha and beta in mutual funds requires more than reading two numbers on a factsheet. Both depend on the benchmark, observation period, return frequency and methodology. They describe historical relationships, not guaranteed future behaviour.
What Is Alpha in Mutual Funds?
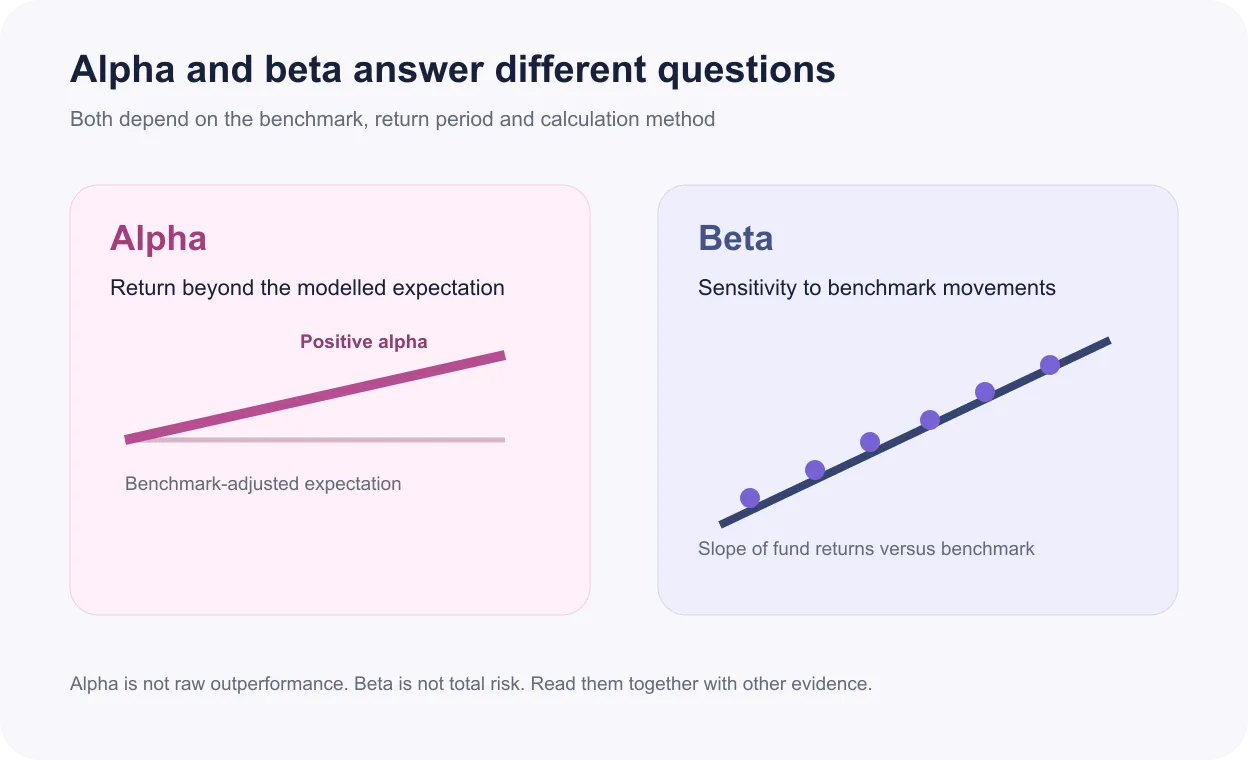
Alpha in mutual funds is a model-based estimate of excess performance. It compares the fund’s actual return with the return expected from a risk model, commonly the Capital Asset Pricing Model, given the fund’s beta, the benchmark return and a risk-free rate.
The mutual fund alpha meaning is therefore different from simple outperformance. If a fund returns 14% while its benchmark returns 11%, the raw gap is 3 percentage points. Alpha may be smaller or larger after adjusting for market sensitivity and the risk-free rate.
Positive alpha indicates performance above the modelled expectation. Zero alpha indicates performance in line with it, while negative alpha indicates a shortfall. Alpha can reflect manager decisions, factor exposures, fees, cash holdings, timing and statistical noise, so it should not automatically be labelled skill.
See what markets are pricing in
Live indices, sector moves and market breadth — the backdrop to every story we publish.
What Is Beta in Mutual Funds?
Beta in mutual funds measures how fund returns have varied with benchmark returns. The standard regression-based formula is covariance of fund and benchmark returns divided by the variance of benchmark returns.
The mutual fund beta meaning centres on sensitivity rather than total volatility. A beta of 1 suggests that the fund historically moved with roughly the same magnitude as its benchmark. A beta of 1.2 indicates higher sensitivity, while 0.8 indicates lower sensitivity.
Beta does not mean a fund will rise or fall by an exact multiple on every day. It summarises a historical relationship over many observations. A beta near zero can still accompany substantial volatility if returns are weakly related to the chosen benchmark.
Alpha vs Beta: What's the Difference?
The key difference is the question being answered. Alpha asks, “Did the fund deliver more or less than the model expected?” Beta asks, “How strongly did the fund move with the benchmark?” This distinction makes alpha and beta in mutual funds useful alongside broader factor analysis.
| Feature | Alpha | Beta |
|---|---|---|
| Main purpose | Estimate return above or below a modelled expectation | Estimate sensitivity to benchmark movements |
| Typical reference point | Zero | One |
| Positive or high reading | Return exceeded expected return | Greater benchmark sensitivity |
| Negative or low reading | Return fell short of expected return | Lower or inverse benchmark sensitivity, depending on value |
| Main limitation | Depends on model and benchmark | Captures systematic relationship, not all risk |
Alpha and beta in mutual funds must use a relevant benchmark. Comparing a small-cap fund with a large-cap index can produce a misleading interpretation because style and segment differences are folded into the residual result.
How to Calculate Alpha in a Mutual Fund
A common answer to how to calculate alpha in mutual funds uses Jensen’s alpha under CAPM: Alpha = Fund return − [Risk-free rate + Beta × (Benchmark return − Risk-free rate)]. All inputs should cover the same period and use compatible return conventions.
Suppose the fund returns 14%, the benchmark returns 11%, the risk-free rate is 6% and beta is 1.2. The expected return is 6% + 1.2 × (11% − 6%) = 12%. Alpha is 14% − 12% = +2 percentage points.
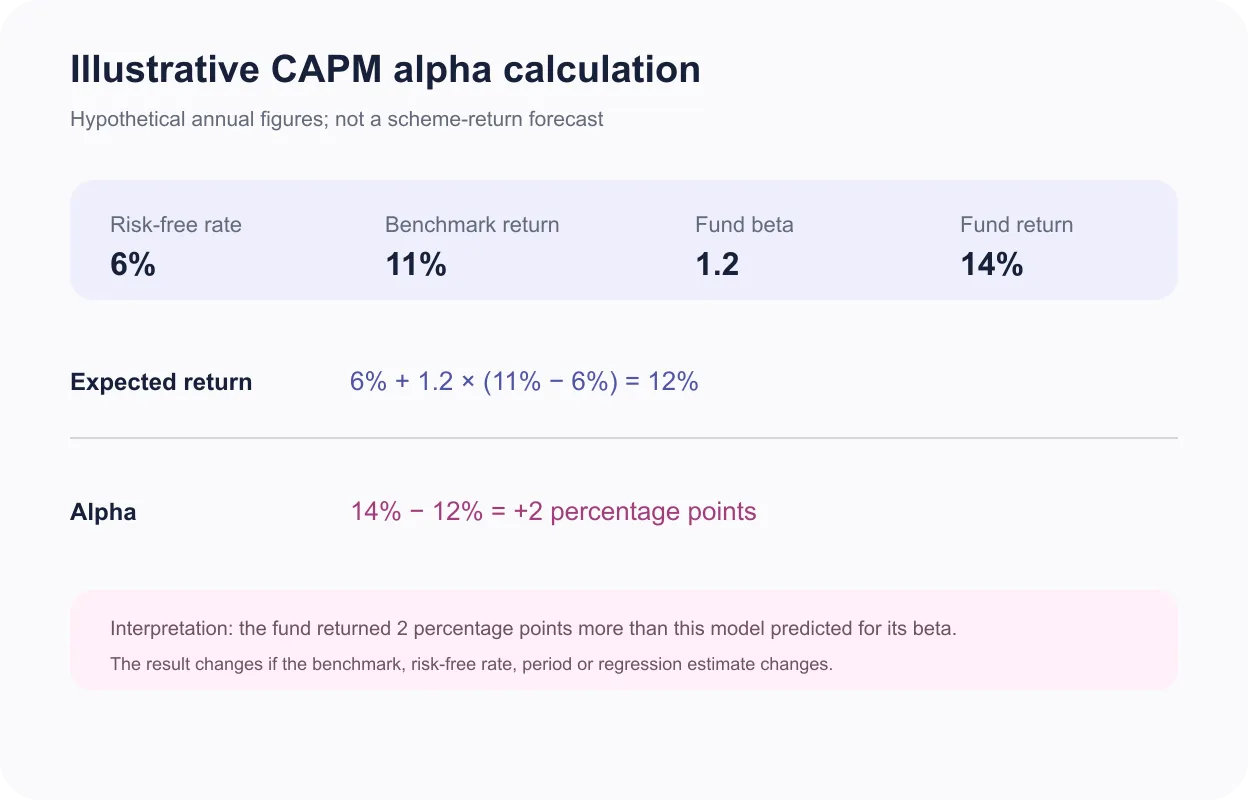
When checking how to calculate alpha in mutual funds, document the risk-free proxy, benchmark, return frequency and date range. Changing any of these can change the result. Fund platforms may also use different lookback windows or annualisation rules.
Get research like this in your inbox
The week’s research that mattered, in five minutes. Joined by 2L+ investors.
How to Calculate Beta in a Mutual Fund
Beta is calculated as Covariance(Fund returns, Benchmark returns) ÷ Variance(Benchmark returns). In practice, analysts align periodic fund and benchmark returns, estimate their covariance and divide by benchmark variance. The same result is the slope coefficient in a simple linear regression of fund returns on benchmark returns.
If the beta estimate is 1.2, a 10% benchmark move corresponds to a modelled 12% fund move from the systematic component, before alpha and residual variation. The relationship is approximate, not a promise.
For beta in mutual funds, daily, weekly or monthly data and different lookback periods can produce different estimates. A short period may be noisy, while a long period can include an outdated portfolio regime.
What a High or Low Alpha and Beta Mean
High positive alpha can indicate strong benchmark-adjusted performance, but persistence matters. A single period may reflect style tailwinds or chance. Negative alpha warrants investigation, not an automatic exit, especially when the benchmark or risk model is poorly matched.
High beta means greater historical sensitivity to the benchmark, not automatically higher quality or return. Low beta can dampen market moves but does not eliminate credit, concentration, liquidity, duration or manager risk.
The mutual fund alpha meaning and mutual fund beta meaning also change with category. A defensive equity fund may intentionally carry beta below 1, while an aggressive strategy may accept beta above 1. Judge the readings against the scheme mandate and investor goal.
How Investors Use Alpha and Beta to Evaluate Mutual Funds
Start with a category-appropriate benchmark and a consistent period. Then review alpha and beta in mutual funds alongside standard deviation, drawdown, information ratio, expenses and portfolio concentration. SEBI now requires daily Information Ratio disclosure for equity-oriented schemes, reinforcing the need to evaluate return relative to risk rather than in isolation.
Investors comparing alpha in mutual funds should check whether positive alpha persists across market phases and survives fees. They should interpret beta in mutual funds beside the fund’s riskometer, holdings and stated strategy.
Used together, alpha and beta in mutual funds can reveal whether a high return largely reflects greater market exposure or whether the fund added value beyond the modelled expectation. They are diagnostic tools, not a complete selection rule.
A sound review also checks whether the portfolio, mandate or fund manager changed during the measurement window, because a historical estimate may describe exposures that the current scheme no longer carries.
Before comparing alpha and beta in mutual funds across providers, record the benchmark, calculation date, observation frequency and lookback period shown by each source. Compare the same plan and option, because expenses and cash distributions can alter returns. Review multiple market phases rather than choosing the fund with the highest recent statistic. A repeatable process is more useful than a single ranking: confirm category fit, examine risk-adjusted performance, inspect portfolio concentration and decide whether the behaviour suits the investor’s horizon and capacity for loss.
Track the factors behind this research
Momentum, value, quality and low-vol — updated factor performance for Indian markets.
FAQ
What is alpha and beta in mutual funds?
Alpha estimates the return above or below a benchmark-adjusted expectation, while beta estimates how sensitively a fund has moved with its benchmark. Both are historical, benchmark-dependent statistics.
How do you calculate alpha in a mutual fund?
A common CAPM approach subtracts the expected return from the fund return: fund return minus [risk-free rate plus beta multiplied by benchmark return minus risk-free rate]. Use the same period for every input.
What does a negative alpha mean?
Negative alpha means the fund returned less than the selected model expected for its measured beta over the period. It does not by itself prove poor management because the result can be affected by benchmark choice, fees, style and estimation noise.
What does a high or low beta mean for a mutual fund?
A beta above 1 indicates greater historical sensitivity to benchmark movements, while a beta below 1 indicates lower sensitivity. Beta does not predict an exact future gain or loss and does not capture every type of risk.
Is high alpha always good?
Positive alpha is preferable to negative alpha when the calculation is comparable, but one observation may not persist. Investors should examine the time window, benchmark, expenses, consistency, drawdowns and portfolio strategy.
How are alpha and beta used together?
Beta provides context for market sensitivity, while alpha asks whether return exceeded or fell short of a modelled expectation for that sensitivity. Together they are more informative than either statistic alone, but still need other risk and portfolio measures.


