


An index turns the prices of many securities into one number. It gives investors a quick view of a defined market segment, but it is not the whole market and it does not show how every constituent performed.
For a beginner, the stock market index meaning is best understood as a rules-based measuring basket. The rules decide which shares qualify, how much influence each receives and when the basket is reviewed. Those choices explain why two benchmarks can move differently on the same day.
A benchmark is a measuring tool; an investor still needs to understand what sits inside it.
What Is a Stock Market Index?
A stock market index measures the combined movement of a selected group of shares. The level is expressed in points, not rupees. If it rises 1%, the weighted basket has gained roughly 1% under the provider’s methodology.
The second part of the stock market index meaning is scope. A headline benchmark may emphasise large companies, while another may cover mid-sized businesses, one sector or a theme. It is therefore important to read the name, factsheet and methodology before interpreting a move.
See what markets are pricing in
Live indices, sector moves and market breadth — the backdrop to every story we publish.
Why Stock Market Indices Exist
Indices compress a large amount of price information into a comparable time series. Investors use them as market barometers, performance benchmarks and starting points for asset allocation. A fund manager can compare a portfolio with an appropriate index rather than an arbitrary return target.
They also support products. Futures and options can reference a benchmark, while index funds and exchange-traded funds can try to replicate it. Academic research uses indices to study markets over time. None of these uses means the basket is risk-free or automatically suitable for everyone.
How an Index Is Constructed and Calculated
The provider first defines an eligible universe, then applies rules for size, liquidity, trading history, free float or other characteristics. It selects constituents, assigns weights and publishes a review schedule. Transparent rules make the series repeatable even when members change.
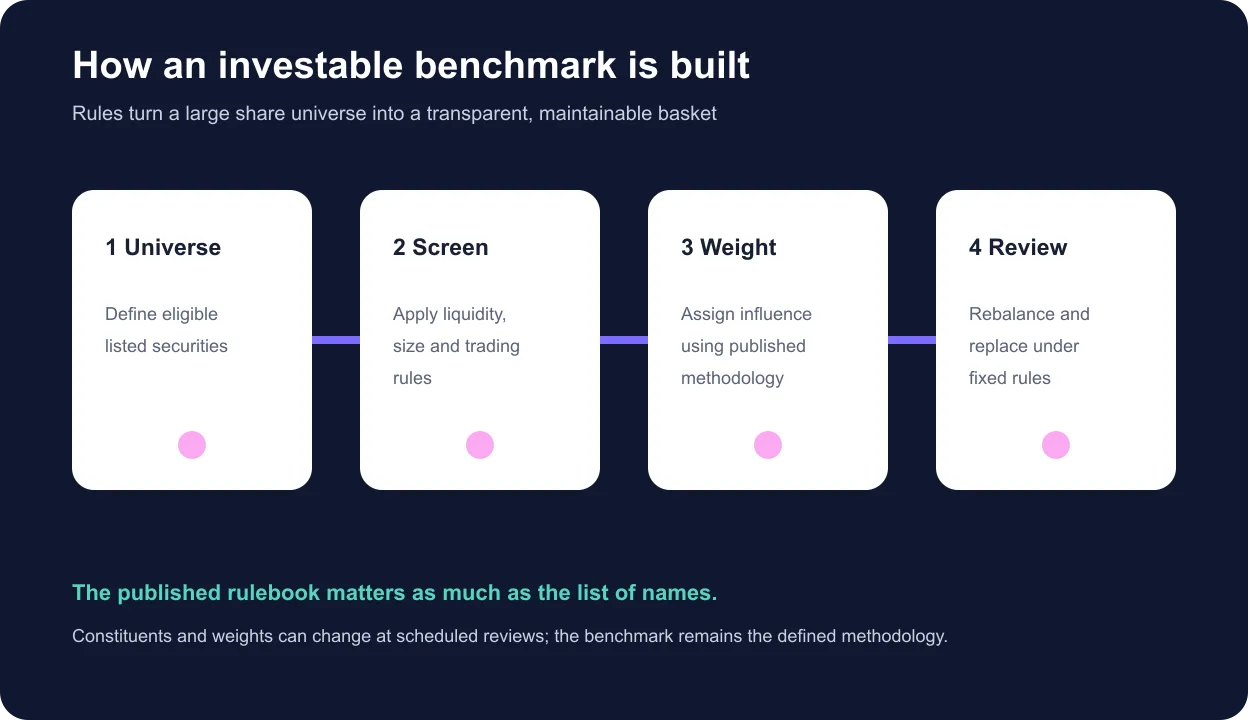
For a free-float market-cap benchmark, a company’s investable value is broadly its price multiplied by shares considered available for public trading. The index calculation aggregates constituent values and divides by an adjusted divisor. The divisor preserves continuity after stock splits, rights issues, replacements and other corporate events.
A simplified index calculation is: aggregate current free-float market value divided by the divisor. The base date and base value provide the historical reference. This is why an index at 25,000 points is not “more expensive” than one at 80,000; their bases and methodologies differ.
Nifty 50 vs Sensex: What Beginners Should Know
The Nifty 50 index represents 50 large and liquid companies from important sectors on NSE. Its official April 2026 factsheet says it uses free-float market capitalisation, has a 1,000 base value dated 3 November 1995 and is rebalanced semi-annually.
The Sensex index is BSE’s 30-company bellwether. BSE describes its members as large, liquid and financially sound companies across key sectors. The series was launched in 1986. Like its NSE counterpart, it is a selective benchmark, not every listed share.
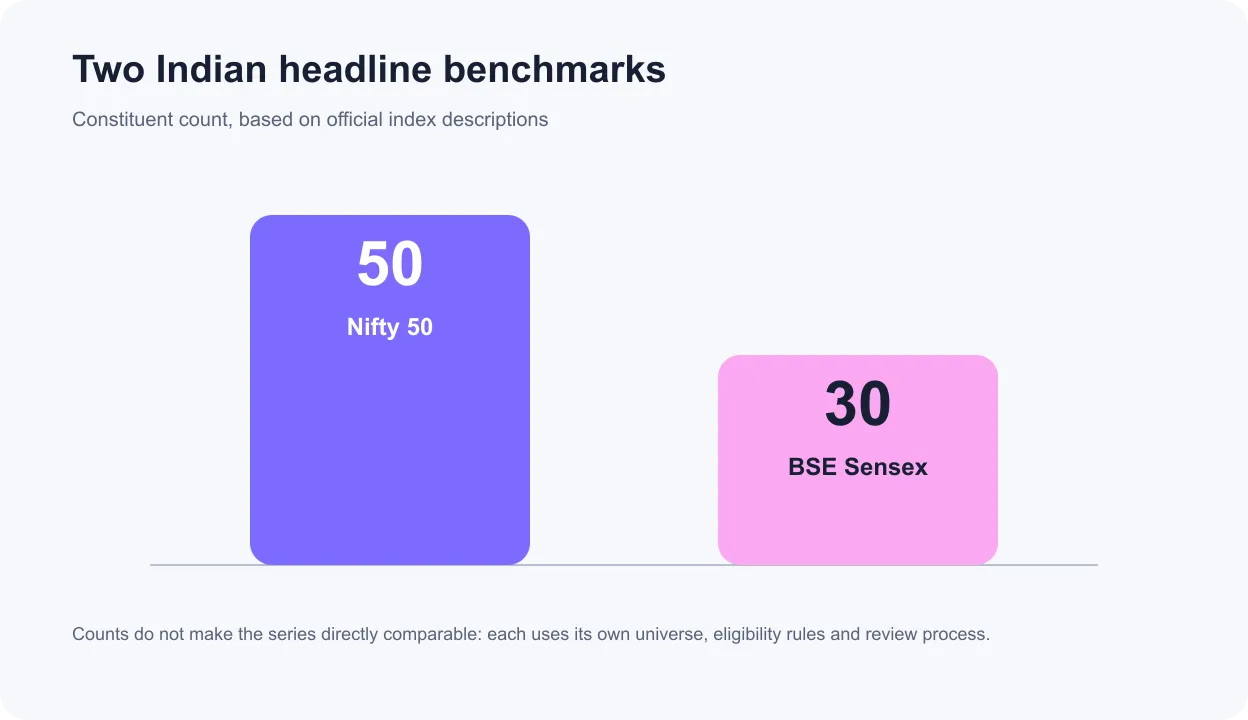
The Nifty 50 index and Sensex index often show similar broad direction because both focus on major Indian companies, but their exchange universes, membership and weights differ. Compare percentage returns over the same dates rather than their point levels.
Types of Stock Market Indices
| Type | What it measures | Use |
|---|---|---|
| Broad market | A wide cross-section of listed shares | Overall market context |
| Size segment | Large-, mid- or small-cap companies | Style and allocation comparison |
| Sector | Companies in one industry | Track banking, IT, pharma and others |
| Thematic | A business trend across sectors | Targeted exposure and research |
| Factor or strategy | Rules such as value, quality or momentum | Systematic portfolio construction |
Also distinguish a price-return index from a total-return index. The first captures price movements. A total-return version assumes constituent distributions such as dividends are reinvested, making it the more complete comparison for many portfolios and funds.
Get research like this in your inbox
The week’s research that mattered, in five minutes. Joined by 2L+ investors.
Market-Cap Weighting and Other Weighting Methods
In free-float market-cap weighting, larger investable companies have greater influence. NSE Indices explains that investible weight factors reduce the impact of promoter and strategic holdings that are generally unavailable for trading. The Nifty 50 index uses this approach.
An equal-weight index assigns the same starting weight to each member, increasing the influence of smaller constituents and requiring rebalancing. A price weighted index gives a higher-priced share more influence regardless of company size. The Dow Jones Industrial Average is a familiar international example.
Some strategy indices weight by fundamentals, volatility or factors. No method is neutral: each creates exposures, concentration and turnover. When comparing a price weighted index with a market-cap series, ask what causes one company to matter more than another.
How to Read an Index's Performance
Start with percentage change over a stated period. Point changes alone lack context: 500 points means something different at 10,000 than at 50,000. Use consistent start and end dates, and know whether the chart shows price return or total return.
Then look under the headline. Sector weights, the largest constituents, market breadth and concentration can explain a move. A rising benchmark can coexist with many falling shares if a few heavily weighted members gain. Long-term charts should be read with drawdowns and volatility, not return alone.
The final index calculation is mechanical, but interpretation is not. Currency, taxes, fund expenses and tracking difference affect an investor’s realised outcome. Historical returns do not promise future returns.
Returns should also be annualised carefully. A one-year percentage is already an annual return; a multi-year cumulative gain can be converted into a compound annual growth rate for comparison. Short windows may be dominated by the chosen start date, so examine several horizons. If a factsheet reports volatility, remember that it describes the variability of past returns, while maximum drawdown records a historical peak-to-trough decline. Neither statistic predicts the next loss.
Beginners can create a simple reading routine. First, confirm the index name and provider. Second, note whether the displayed series includes dividends. Third, check the measurement dates and percentage change. Fourth, inspect the largest weights and sectors. Fifth, compare the move with a broader or more suitable benchmark. Finally, ask whether a news headline reflects the whole basket or only a few influential companies. This approach makes a stock market index more informative without treating it as a forecast.
Keep benchmark selection aligned with the decision. A diversified equity portfolio may need a broad-market comparator, while a banking portfolio needs a sector benchmark. Comparing a mid-cap fund with a large-cap series can make skill or risk look misleading. Also check whether the portfolio and benchmark use the same currency, return type and valuation date. An appropriate benchmark should be specified before results are known, remain measurable and represent the investable opportunity set reasonably well over time.
Index vs Individual Stock: What Is the Difference?
The index vs stock distinction begins with ownership. A share is an interest in one company; an index is a numerical measure of a defined basket. You can buy a share directly, but exposure to an index normally comes through a fund, ETF or derivative.
In an index vs stock comparison, diversification is the major structural difference. A basket reduces company-specific dependence, but it still carries market, sector, valuation and concentration risk. An index can also be dominated by its largest weights. Holding an index product does not remove the need to match risk with goals and horizon.
How Index Funds and ETFs Track an Index
An index mutual fund usually holds all or a representative sample of benchmark securities in similar proportions. SEBI’s investor material says the aim is to replicate performance, with returns generally aligned to the benchmark minus costs and operational effects.
An ETF also tracks a basket but trades on an exchange during market hours. Its market price can differ from net asset value, and investors may incur brokerage and demat charges. Review expense ratio, tracking difference, liquidity and the underlying benchmark rather than choosing only by recent return.
The Sensex index and other benchmarks cannot be purchased as standalone securities. A tracking product introduces a layer between the methodology and the investor’s return. Read the scheme information document and consider regulated advice where appropriate.
Is your portfolio built for what’s coming?
Get a free AI-powered review of your holdings — risk, overlap and quality in minutes.
FAQ
What is a stock market index?
It is a rules-based measure of the performance of a selected basket of securities. Its movement summarises how that defined segment has changed, subject to its constituent weights.
How is a stock market index calculated?
The provider selects eligible securities, assigns weights under a published methodology and converts the basket’s changing aggregate value into index points relative to a base. Corporate actions require divisor adjustments.
What is the difference between Nifty and Sensex?
Nifty 50 represents 50 large and liquid NSE-listed companies, while the BSE Sensex represents 30 large, liquid and financially sound BSE-listed companies. Each follows its own methodology.
Why do investors track stock market indices?
They use indices to read market direction, compare portfolio or fund returns, study segments and select benchmarks for passive products.
What are the main types of stock market indices?
Common categories include broad-market, large-cap, mid-cap, small-cap, sector, thematic, factor and strategy indices, plus price-return and total-return versions.
Can beginners invest directly in an index?
An index is a calculation, not a security. Investors generally seek exposure through an index mutual fund or ETF, after reviewing costs, tracking difference, liquidity and suitability.


