

India's NSE Nifty 50 index is set for its 5th consecutive monthly decline, marking its longest losing streak since 1996. This downturn has positioned India as the worst-performing major global market, with indications that the bearish trend could persist in the coming months. The last time the Nifty 50 experienced a 5 month losing streak was between July and November 1996. Only twice in its history has it recorded such prolonged declines, with the longest streak being eight consecutive months of losses from September 1994 to April 1995.
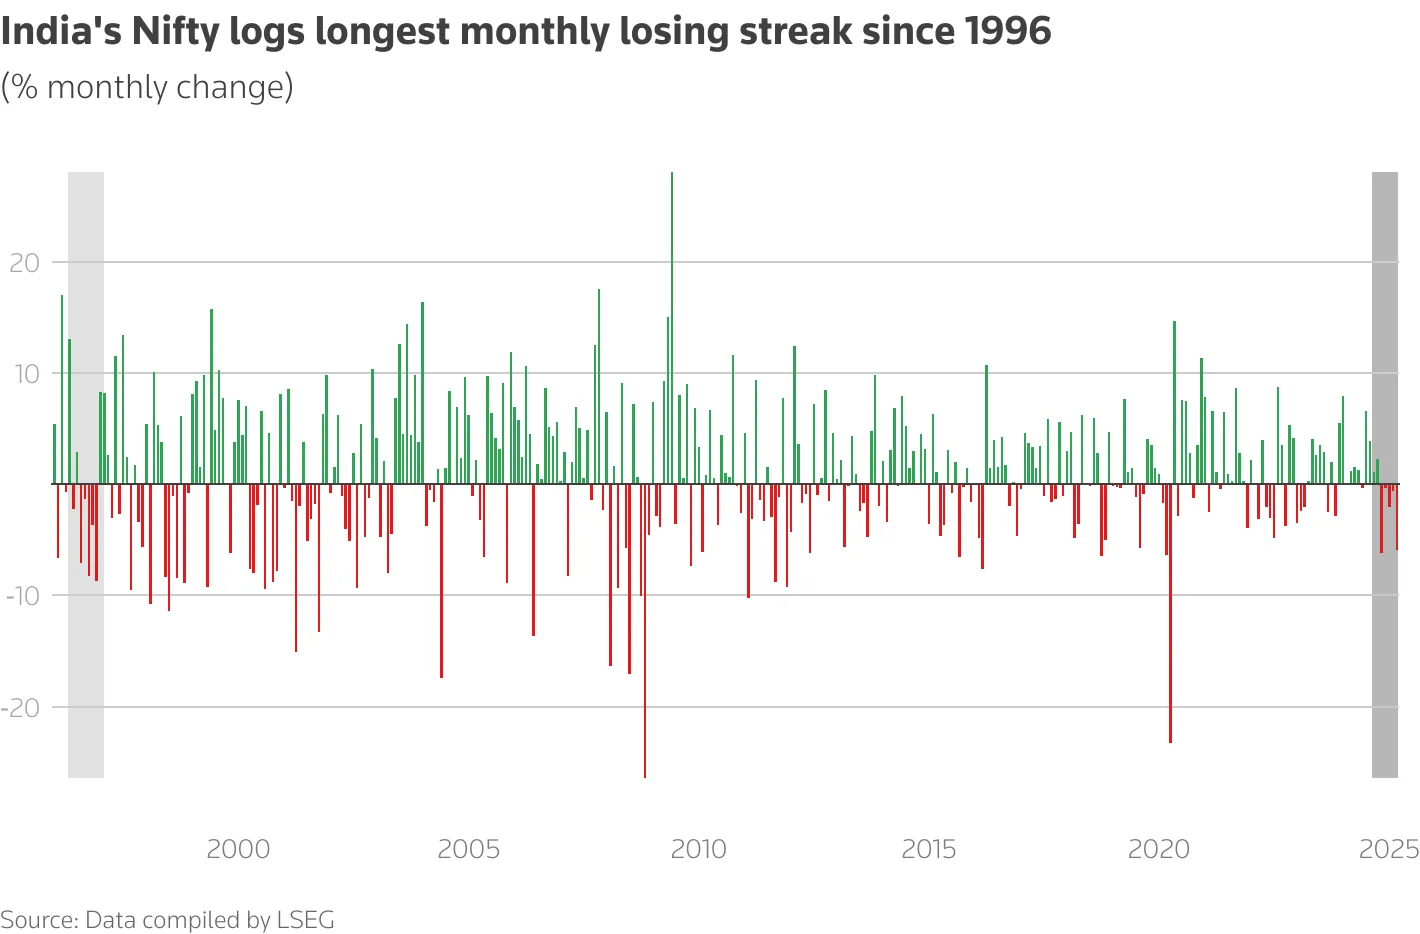
The Nifty 50 has plunged nearly 15% from its September peak, wiping out nearly 85 trillion rupees (approximately $1 trillion) in investor wealth. A combination of weak corporate earnings, continuous foreign outflows, and uncertainty surrounding US tariffs has led to a significant erosion in investor confidence. Ongoing US tariff war concerns are adding to India's market struggles. While some technical rebounds may occur due to oversold conditions, will India remain a "sell-on-rise" market for the foreseeable future?
Foreign and Domestic Investment Trends
Since the end of September, foreign investors have pulled out approximately $25 billion from Indian equities, with $4.1 billion of that exiting in February alone. Despite strong retail participation, local institutional investors are experiencing a slowdown in equity inflows.
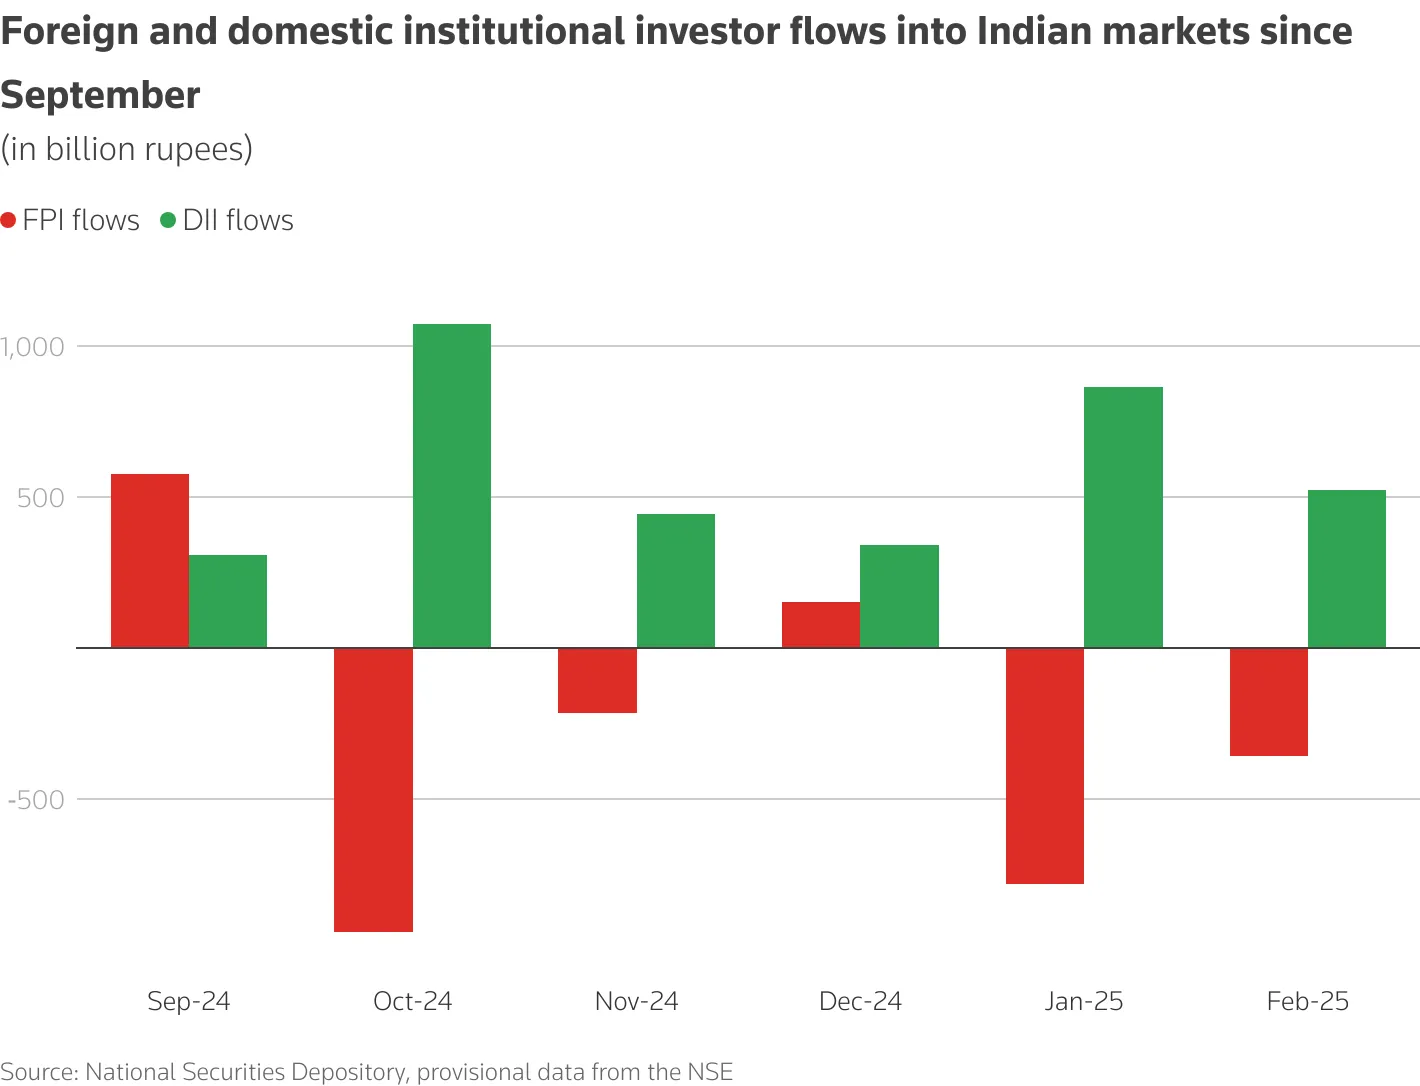
While overall net inflows remain positive, most domestic mutual funds, insurance companies, and portfolio management services are seeing reduced equity investments.
Small and Mid Cap Stocks Under Pressure
The downturn has been particularly severe for small cap and mid cap stocks which have fallen in 2025 . In February, the Nifty Small-Cap 100 index dropped 13.2%, while the Nifty Mid-Cap 100 index fell 11.3%, bringing them 26% and 22% below their respective record highs from last year.
With investor sentiment increasingly cautious, many are shifting their focus toward safer large-cap equities or balanced debt-equity funds. Analysts predict that selling pressure will persist in the small and mid cap segments, with strong buying support unlikely to return in the next couple of months.
Global Market Influence
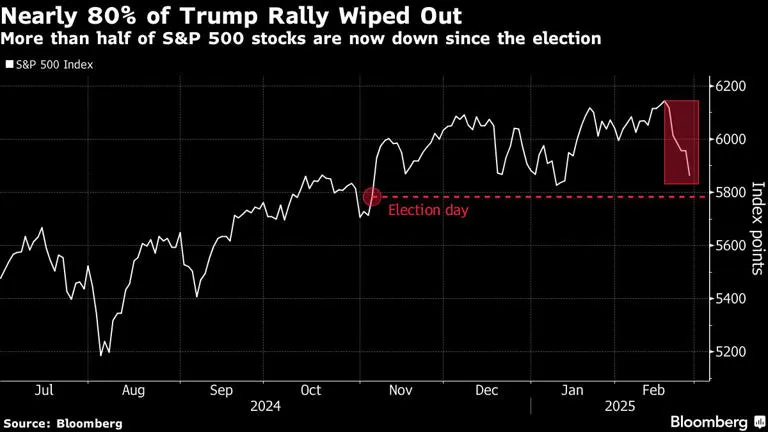
The downturn in Indian markets coincides with turbulence in global markets. US indices recently suffered their worst trading session of the year following weaker-than-expected economic data and rising long-term inflation expectations. A potential reversal of the S&P 500’s post-election rally could prompt expectations of intervention from President Donald Trump, according to Bank of America strategists. The index has slipped nearly 3% this month, driven by concerns over Trump’s proposed tariffs and their impact on global trade. With the S&P 500 nearing its Nov. 5 election-day level, investors may look for supportive policy signals, including possible Federal Reserve rate cuts, a Saudi oil deal, or accelerated tax cuts. While a trade deal with China could be the most bullish scenario, further tariffs remain an unlikely but possible response.
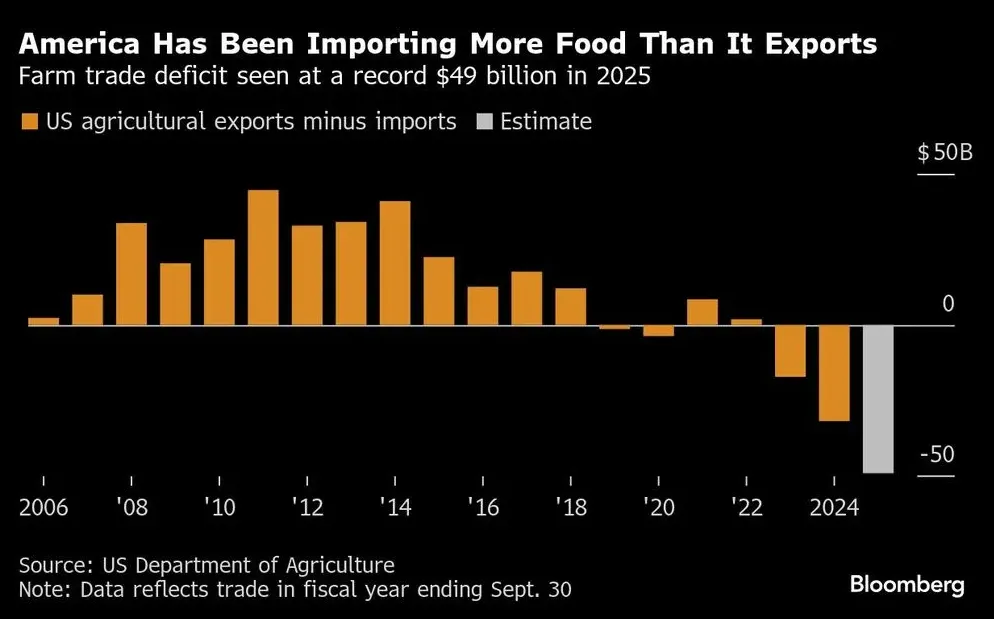
With consumer inflation expectations in the US reaching their highest levels since 1995, investors are increasingly skeptical about the likelihood of an early Federal Reserve rate cut. While prices for non-food items have eased in the US, food costs continue to strain household budgets, driven by rising wages, input costs, and inflation.
Global growth remains subdued, with the IMF projecting a growth rate of 3.3% for both 2025 and 2026. While developed economies may see marginal improvement in 2025, the growth momentum in Asian developing countries is expected to slow.
Stronger growth in the US should bolster export demand, particularly for IT services. Meanwhile, commodity prices, including Brent crude, are likely to remain subdued due to weak demand from China and increased US petroleum production under the new administration.
Check the macro backdrop
GDP, inflation, rates and more — India’s key economic indicators in one dashboard.
Market Correction Hits Trading Volumes
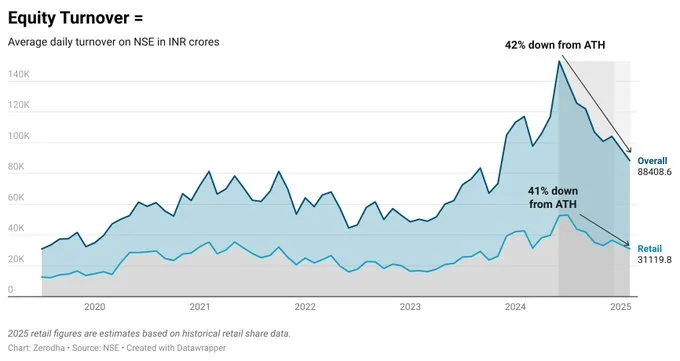
Zerodha’s Nithin Kamath shared that significant market correction has led to trading volumes plummeting over 30% across brokers. This marks the first business degrowth in 15 years for the broking industry, highlighting the market's reliance on a relatively small pool of 1-2 crore active traders. The decline, coupled with the impact of regulatory measures, could drastically reduce the government’s Securities Transaction Tax (STT) revenue, potentially falling 50% short of the projected ₹80,000 crore for FY 25/26. This downturn underscores the shallowness of India’s equity markets and the cyclical nature of market participation.
Derivatives Market Signals Further Weakness & Corrections
The derivative market is flashing warning signals, indicating potential downside risks for equity markets. Recent trends in positioning suggest that HNIs and retail investors have significantly reduced their long positions, reflecting waning confidence in sustained upward momentum. Meanwhile, foreign institutional investors have taken a more cautious approach—although they have increased their long positions in stock futures, they have simultaneously hedged these bets with index shorts.
One of the key indicators of sentiment in the derivatives market, open interest (OI), has been on a downward trajectory across both the Nifty 50 index and the broader market. This decline in outstanding futures contracts underscores a lack of conviction among traders as they navigate the market heading into March. Reduced OI typically suggests that market participants are either liquidating positions or unwilling to take fresh bets amid uncertainty.
Get research like this in your inbox
The week’s research that mattered, in five minutes. Joined by 1.6L+ investors.
Indian GDP Growth Improves in Q3
India's GDP growth for the third quarter stood at 6.2%, reflecting a significant improvement compared to the 5.6% growth recorded in Q2 FY25. The growth for the second quarter was also revised upwards by 20 bps. The rebound in growth momentum in Q3 was largely anticipated, as indicated by several high-frequency macroeconomic indicators, including improved GST collections, public spending, electricity generation, and export performance. For the full-year FY25, the second advance estimate puts the GDP growth at 6.5%, marginally higher than the 6.4% growth estimated earlier. However, 6.5% growth for FY25 looks ambitious, as that would imply a growth of 7.6% in Q4 FY25.
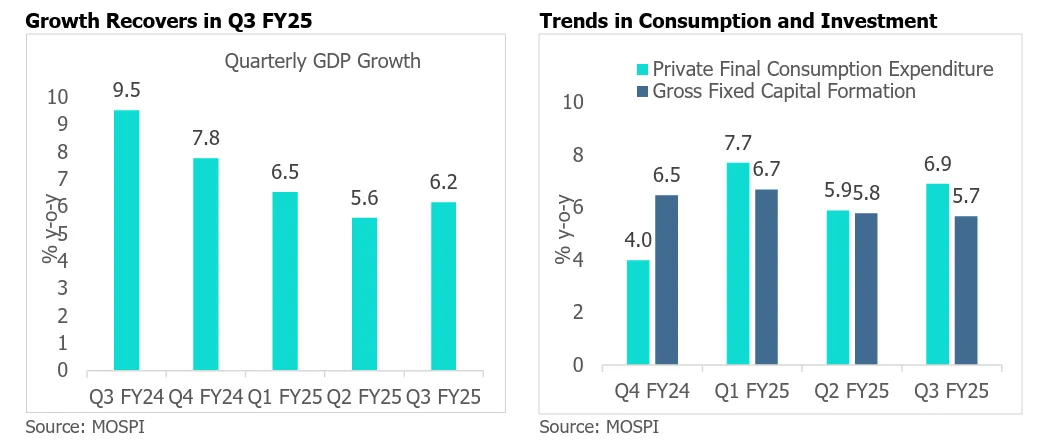
On the expenditure side, recovery in growth of private consumption, government expenditure, and export looks encouraging. The growth in private consumption expenditure came in at 6.9% in Q3, higher than 5.9% growth in the previous quarter. Due to better agricultural activities and falling inflation, rural consumption demand seems to have performed well. However, high-frequency indicators continue to present a mixed picture for urban demand.
After elections impacted government consumption expenditure in H1, the growth rebounded sharply in Q3 to 8.3% from 3.8% in Q2. Exports grew by 10.4% in Q3, higher than 2.5% in Q2, largely on the account of robust services exports. However, investment growth continues to remain muted, which is a cause of concern. Despite an uptick in government capex in Q3, investment growth has continued to slow in the past three quarters.
Non-Financial Corporate Earnings Recover In Q3 FY25
The sales growth in Q3 FY25 aligned well with expectations, reflecting the continued recovery of economic momentum. This growth was driven by favorable trends in high-frequency indicators, such as rising government capital expenditure, growth in industrial production, increasing GST collections, and strong agricultural performance.
Agriculture growth continued to recover, growing at 5.6% YoY in Q3, higher than the 4.1% growth witnessed last quarter. Agricultural activities were aided by robust Kharif output growth and healthy Rabi sowing growth.
Services sector maintained its broad momentum, growing at 7.4% YoY in Q3, higher than Q2 growth of 7.2%. The improvement in the growth of the services sector was on the back of higher growth of trade, hotels, transport, communication & broadcasting services, which jumped from 6.1% in Q2 to 6.7% in Q3.
Financial, real estate, professional services, and public administration & defense maintained healthy growth rates similar to last quarter.
Industrial activities rebounded in Q3 but continue to remain muted, which is a cause of apprehension. Industrial growth was impacted by slowing growth of construction activities, which fell to 7% in Q3, down from 8.7% in the previous quarter.
Growth in the manufacturing sector showed improvement but remained below potential, with a growth of 3.5% in Q3.
Mining activity remained muted, with just 1.4% growth despite no major weather-related disruptions in the third quarter.
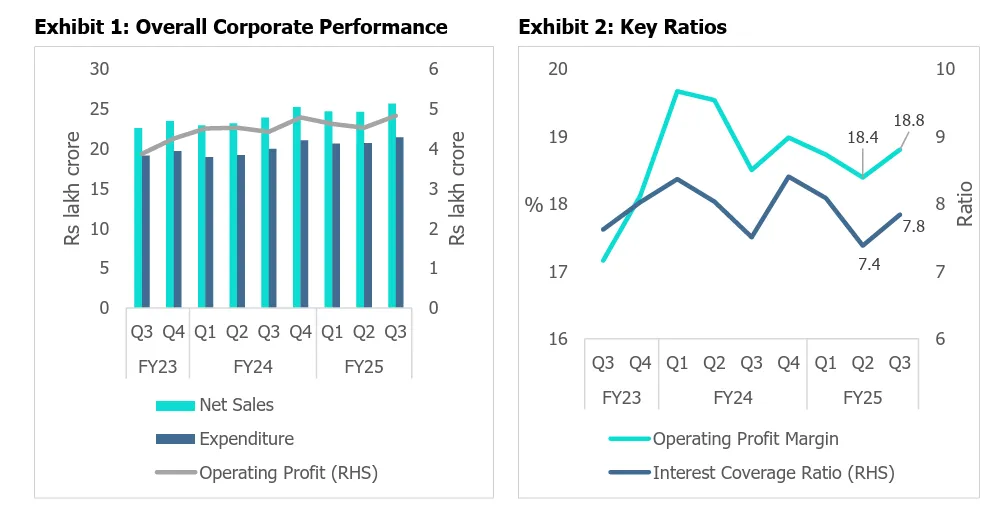
An in-depth analysis of 20 selected sectors in Q3 FY25 revealed mixed performances across industries. Eight sectors reported double-digit growth in both net sales and operating profit.
Key Performers:
Capital Goods: The sector experienced strong growth due to a rise in domestic order inflows following the election period and a decline in commodity prices.
Telecom: Benefited from an upward revision of tariffs by key service providers.
White Goods: Air conditioners and refrigerators witnessed increased demand, driven by recovering rural consumption and seasonal weather shifts.
Pharmaceuticals: The sector showed strong growth due to increased demand in both acute and chronic segments, a 4% to 5% price revision under the National Pharmaceutical Pricing Authority (NPPA), easing input pricing pressures, revived biotech funding, specialty product launches, and deeper penetration into the generic market.
Muted Performance:
Iron and Steel: Lower international steel prices and increased imports from China, driven by oversupply in their domestic market, negatively impacted profitability.
Crude Oil and Media/Entertainment: These sectors reported subdued performance, with limited growth in both sales and operating profit.
Automobile Industry: The sector faced challenges due to a slowdown in urban demand and elevated inventory levels.
Cement: After two consecutive quarters of contraction, the cement sector rebounded in both sales and operating profit growth in Q3, aided by a recovery in public capital expenditure. Central capital expenditure increased by 47.7% Y-o-Y in Q3 FY25, surpassing the 10.3% growth recorded in Q2, while major state capital expenditure grew by 5.9% in Q3 after contractions in the previous quarters.
See what markets are pricing in
Live indices, sector moves and market breadth — the backdrop to every story we publish.
Way Forward: Economic and Corporate Outlook for India
We expect the growth momentum to rebound further in the coming quarters. Factors such as recovering rural demand, lower tax burden, policy rate cuts, falling food inflation, and recovery in public capital expenditure should support improvement in economic activity. RBI reduced the repo rate by 25 basis points in the February policy meeting and introduced measures to improve liquidity conditions. We anticipate further rate cuts of 25-50 bps in FY26, subject to growth-inflation dynamics. A lower borrowing rate should further support an uptick in private capex and demand conditions. However, rising global policy uncertainty, especially on the trade front, geopolitical tensions, and weather events, remains a key monitorable. Risk from reciprocal tariffs from the US and global trade war could dampen business sentiments even though the overall direct impact is likely to be limited. Overall, we expect GDP growth of around 7% in Q4 FY25 and 6.7% for FY26.
Despite these positive developments, a substantial pickup in private capital expenditure is yet to materialize. A sustained recovery in consumption will be essential to drive corporate capex growth. Festivities amidst ‘Maha-Kumbh’ celebrations in Q4 should also support consumption demand and sectors such as trade, hotel, and transport. While private consumption demand has shown an uneven recovery—lagging in urban areas—we expect overall consumption to improve as inflationary pressures ease and tax reductions take effect in the next financial year.
Trade Policy Risks and Geopolitical Uncertainty
Rising global policy uncertainty, especially concerning trade relations and geopolitical tensions, remains a key risk. The possibility of reciprocal tariffs from the US could impact industries with significant export exposure to the American market, including electronics, gems, jewelry, chemicals, and pharmaceuticals. The US is India’s largest export destination, with annual exports totaling USD 77.5 billion—approximately 18% of India’s total exports.
Currently, the weighted average tariff on Indian exports to the US is around 3.5%, while the corresponding tariff on US exports to India stands at 11.5%. Uncertainty remains about whether the US will impose a uniform additional tariff of ~8% (calculated as 11.5% minus 3.5%) across all goods or differentiate tariffs by product category.
The adverse impact of such tariffs could be partially offset by a depreciating rupee, which would make Indian exports more competitive. Assuming a price elasticity of 1, we estimate the direct impact of an 8% uniform tariff to be limited to approximately USD 3.2 billion (0.1% of GDP). A depreciating rupee amid strong foreign portfolio investor outflows could contribute to imported inflation, thereby affecting input costs. However, this risk appears limited, as overall commodity prices are expected to remain muted in the face of weak global growth.
Outlook for March: Cautious Trading Ahead
Amid the ongoing downturn, Citigroup has upgraded Indian equities to "Overweight" from "Neutral," citing less-demanding valuations and the potential for upside. If global tariff risks re-emerge, India could relatively outperform other emerging markets.
With sentiment skewed towards risk aversion, market participants are likely to tread carefully in the coming weeks. The interplay between index resistance levels, reduced open interest, and cautious institutional positioning suggests that traders may need to adopt a defensive strategy until clearer trends emerge. If downside levels come into play, market volatility could further intensify, making risk management a key priority for investors.
As the market heads into March (the season for tax-loss harvesting is upon us), all eyes will be on derivative positioning, index levels, institutional activity, tariff wars, geopolitical tension & other macro economic indicators to gauge the next move. Whether bulls can reclaim control remains to be seen, but for now, caution appears to be the prevailing sentiment in the space.