
A Resurgence of Trade Tensions
The U.S.–China trade tensions have resurfaced in 2025, echoing the economic confrontations of 2018–2020. The global economy is once again grappling with heightened tariff policies, supply chain disruptions, and shifts in trade partnerships. The 2018–2020 trade war, which saw tariffs imposed on over $450 billion in cross-border trade flows, offers critical insights into the current situation.
Check the macro backdrop
GDP, inflation, rates and more — India’s key economic indicators in one dashboard.
The 2018–2020 Trade War: A Recap
The U.S.–China trade war began in February 2018 with U.S. tariffs on solar panels and washing machines, followed by levies on steel and aluminum in March. These initial measures affected multiple countries, but China was the primary target. Over the next 18 months, the U.S. imposed five waves of tariffs: July 2018, August 2018, September 2018, June 2019, and September 2019. By January 2020, both nations had imposed tariffs covering nearly 15% of global trade.
India was also impacted. In March 2018, the U.S. levied 25% tariffs on $761 million of Indian steel exports and 10% on $382 million of aluminum exports—about 2.3% of India’s 2017 U.S. exports. India challenged these tariffs at the WTO and threatened $1.4 billion in retaliatory tariffs. In June 2019, the U.S. removed India from the Generalized System of Preferences (GSP), subjecting $6 billion in Indian exports to higher tariffs, impacting pharmaceuticals, textiles, and auto parts.
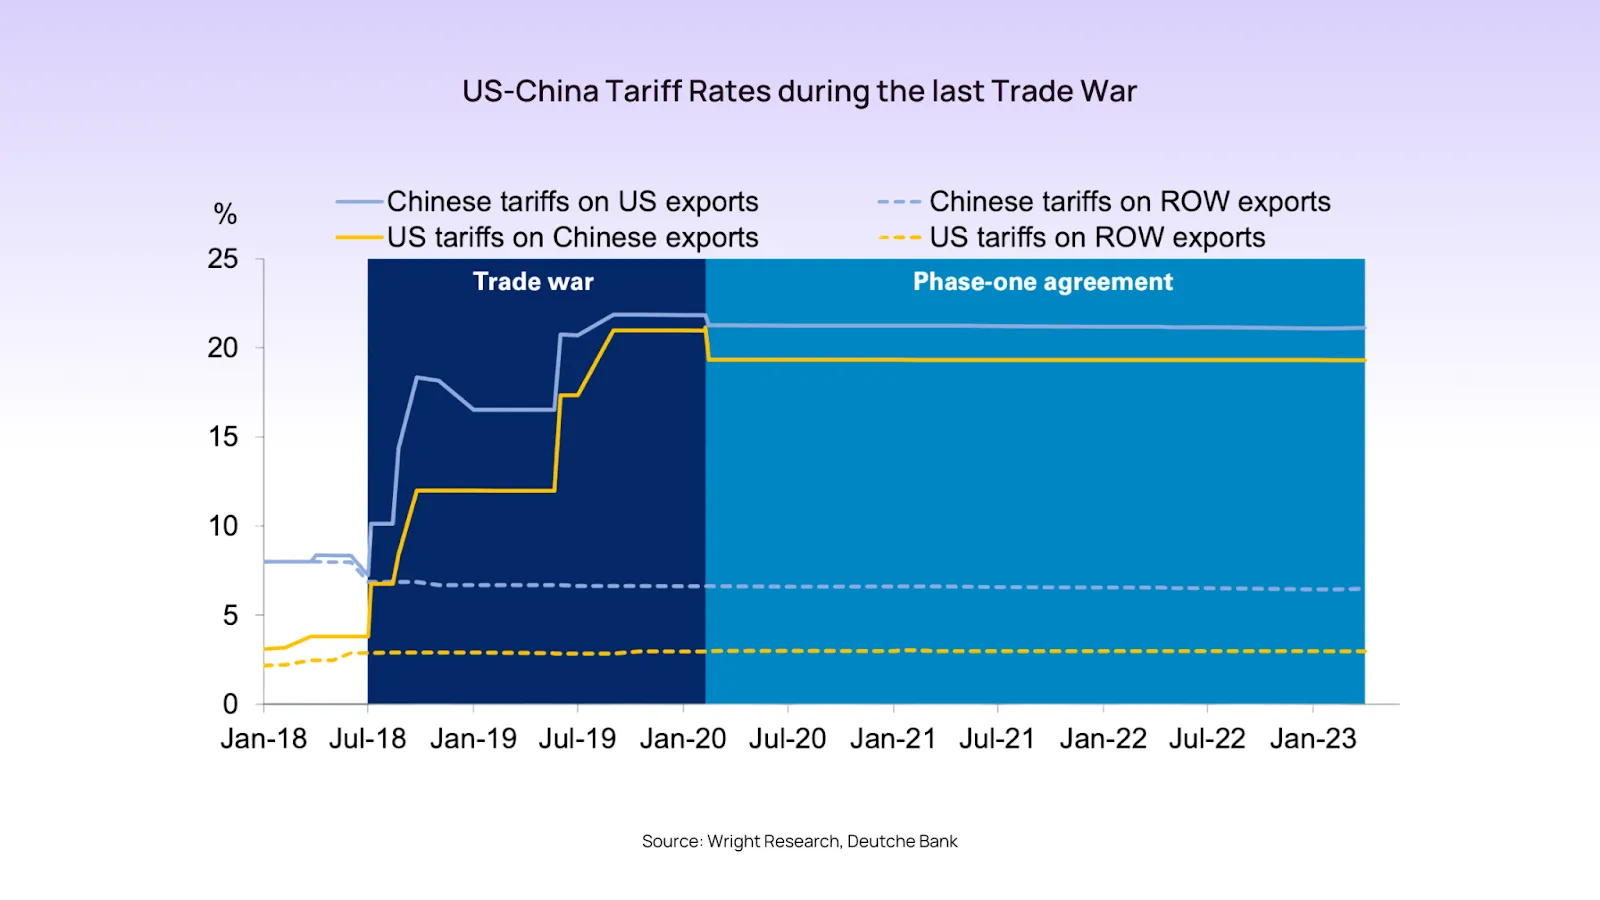
By 2020, the U.S.–China trade war had altered global trade flows. Bilateral tariffs covered 98.5% of India’s exports, shifting market conditions for nearly all of its 5,104 exported products and illustrating the broader consequences of protectionist policies.
The 2025 Trade Escalation
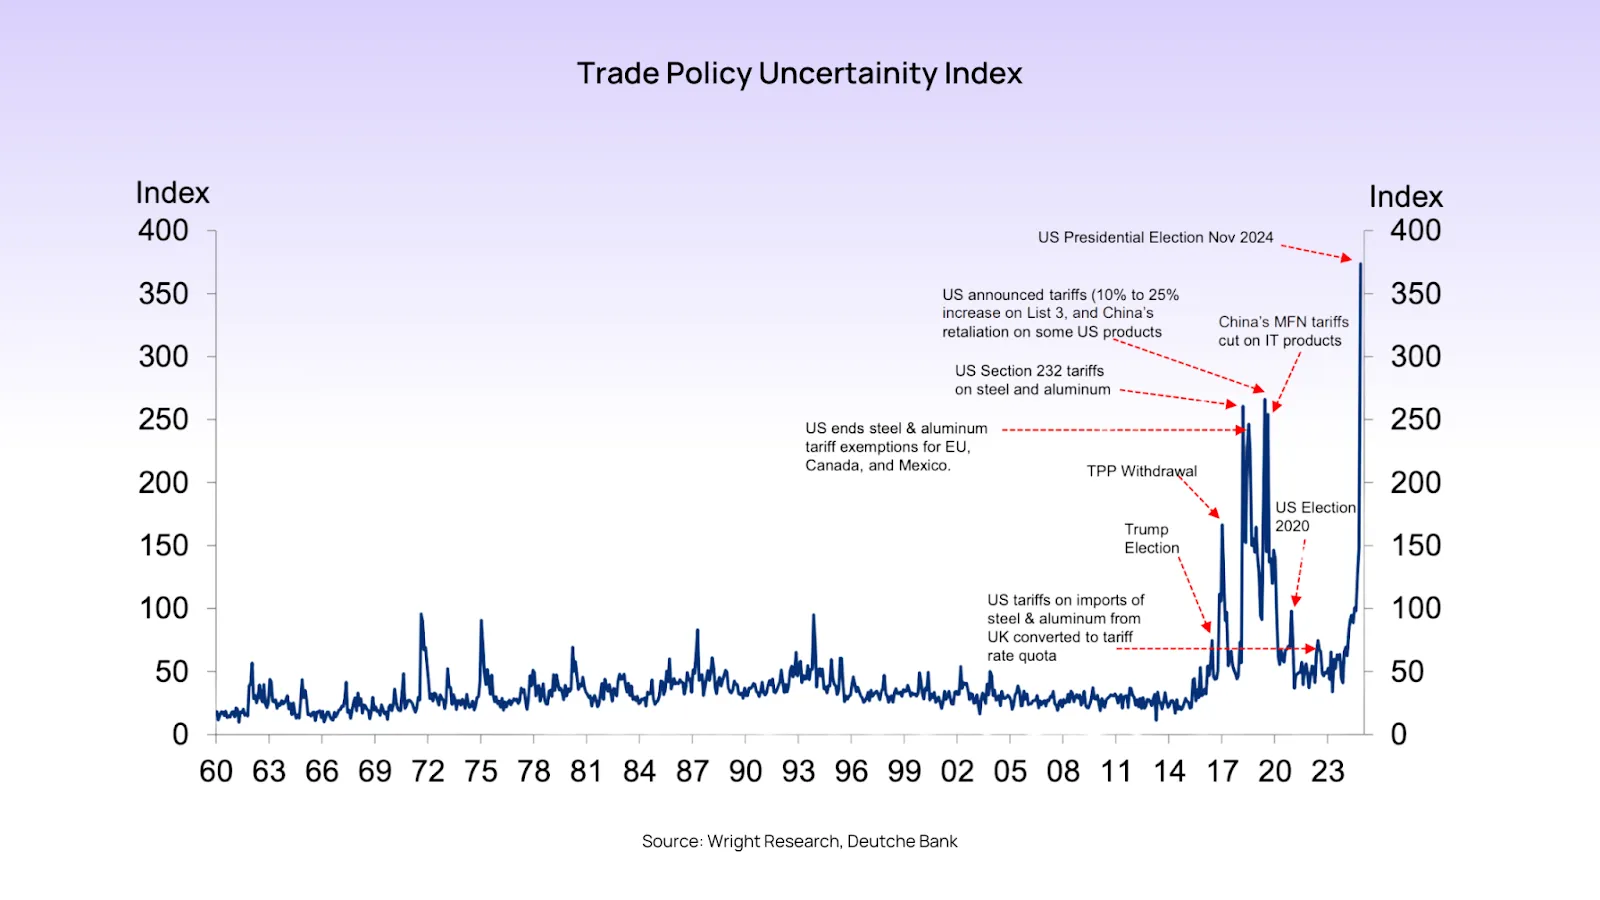
The latest developments in the trade war have already impacted global markets. In just 2 days, fears over escalating U.S. tariffs have wiped out $180 billion from Indian stocks, highlighting investor concerns over trade disruptions and global economic uncertainty. In early February 2025, President Donald Trump announced a 10% tariff on all Chinese imports, aiming to address ongoing trade imbalances and concerns over China's trade practices. In response, China imposed retaliatory tariffs ranging from 10% to 15% on U.S. goods, including coal, liquefied natural gas, crude oil, agricultural machinery, and large-engine vehicles. India, once again, finds itself caught in the crosshairs, facing new uncertainties in trade partnerships and supply chain realignments.
Comparing Trade War Then and Now
Tariff Magnitude and Scope: The initial tariffs in 2018 targeted specific categories, such as steel and aluminum, with rates up to 25%. In contrast, the 2025 tariffs are broader, encompassing all Chinese imports at a uniform rate of 10%. The Indian metal sector has also been a serious victim of the 2025 trade war, with the Nifty Metal Index plunging 5.6% in just three trading sessions.
Retaliatory Measures: China’s retaliatory tariffs in 2018 were more targeted, focusing on agricultural products and automobiles. In 2025, the retaliation includes a wider array of goods, reflecting an escalation in trade tensions.
Global Economic Impact: The 2018–2020 trade war led to a slowdown in global trade growth and increased uncertainty in financial markets. The current tariffs risk similar outcomes, with potential disruptions in global supply chains and increased costs for consumers and businesses.
Get research like this in your inbox
The week’s research that mattered, in five minutes. Joined by 2L+ investors.
Impact of the Trade War on Global Markets
The 2018–2020 trade war had widespread consequences on global markets. Stock markets experienced volatility, with the MSCI World Index declining by over 10% during the peak of the trade war. Investor sentiment weakened, leading to capital flight from emerging markets, including India, which saw $33 billion in FII outflows in 2018 alone. The Chinese yuan depreciated by nearly 12% against the U.S. dollar, while commodities like crude oil and industrial metals faced sharp price fluctuations due to uncertainty in global supply chains.
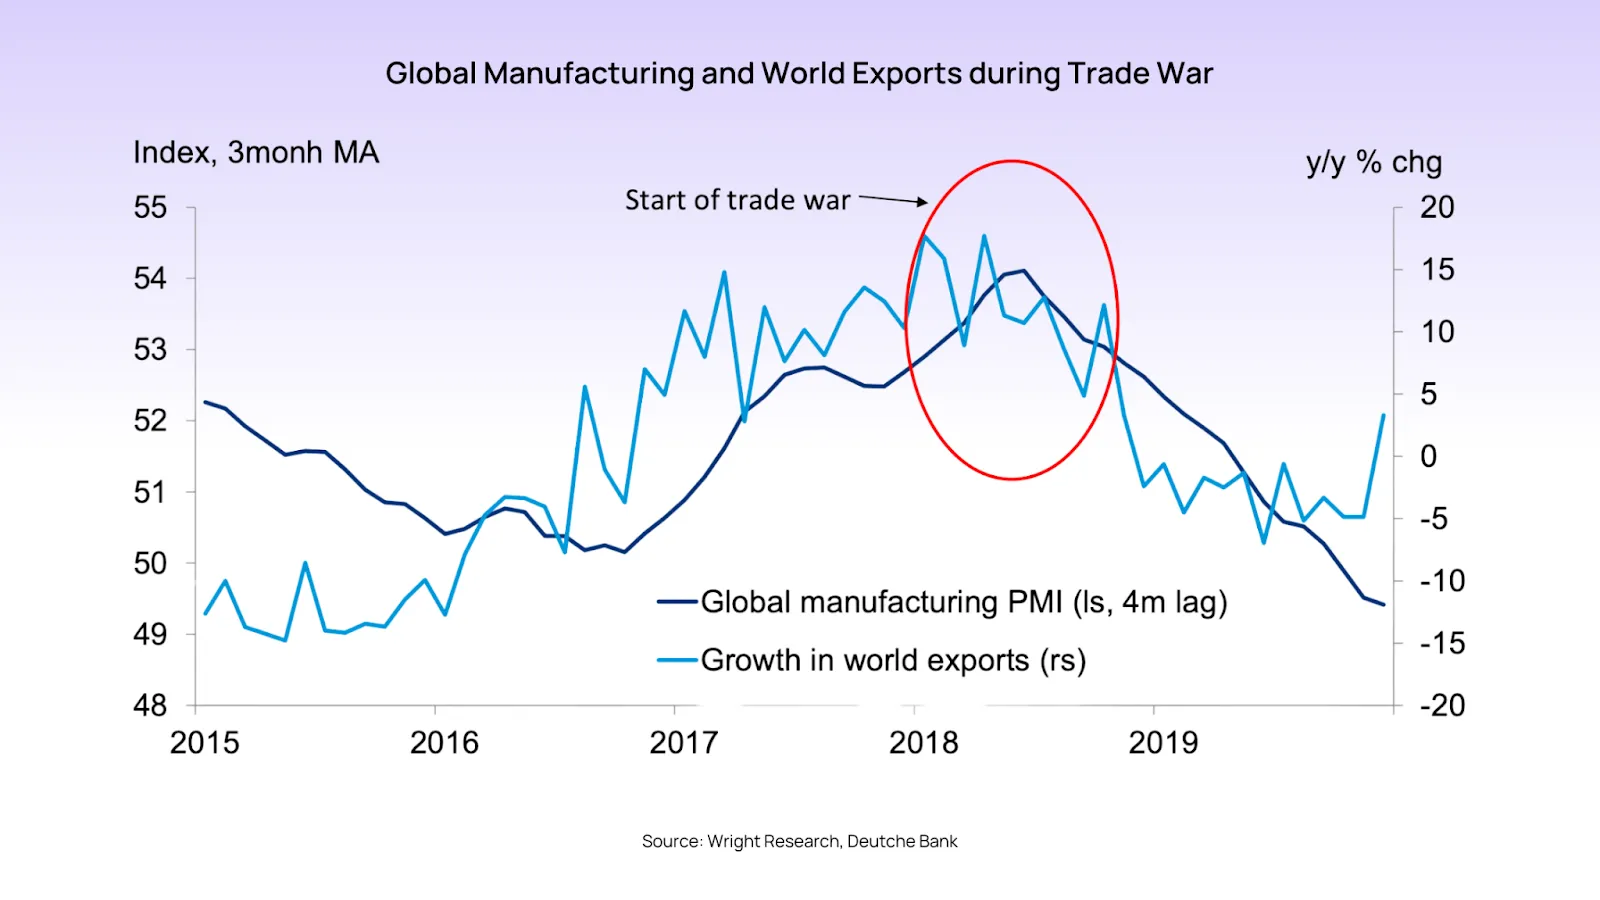 Manufacturing sentiment declined globally, with the Global Manufacturing PMI falling below 50 during the peak of the trade war. The uncertainty surrounding tariffs also impacted business investment, leading to delays in capital expenditure decisions across industries. These market trends provide a relevant backdrop for the 2025 trade escalation.
Implications of Supply Chain Disruptions:
Electronics and Technology: A significant portion of India's imports from China consists of electronics and hardware components. The US-China trade war and subsequent sanctions on Chinese tech companies have created supply chain disruptions, affecting industries in India that depend on these imports, such as consumer electronics and telecommunications.
Pharmaceutical Ingredients (APIs): India imports around 70% of the raw materials for its pharmaceutical industry from China. Any disruption in supply, whether due to trade wars or pandemic-related shutdowns, could lead to shortages in the production of generic medicines, impacting both domestic health services and export markets.
Automobile Industry: India's automobile sector also depends on Chinese components. Disruptions in trade can delay production and increase costs for Indian manufacturers, potentially affecting the competitiveness of Indian exports in this sector.
Overview of the Indian Stock Market During 2018-2020
The Indian stock market experienced significant volatility during the US-China trade war, as global uncertainties affected investor sentiment, foreign capital flows, and sectoral performance. The trade war led to fluctuations in global markets, and as a result, Indian indices Sensex and Nifty 50 were impacted by global risk aversion and shifting investment trends.
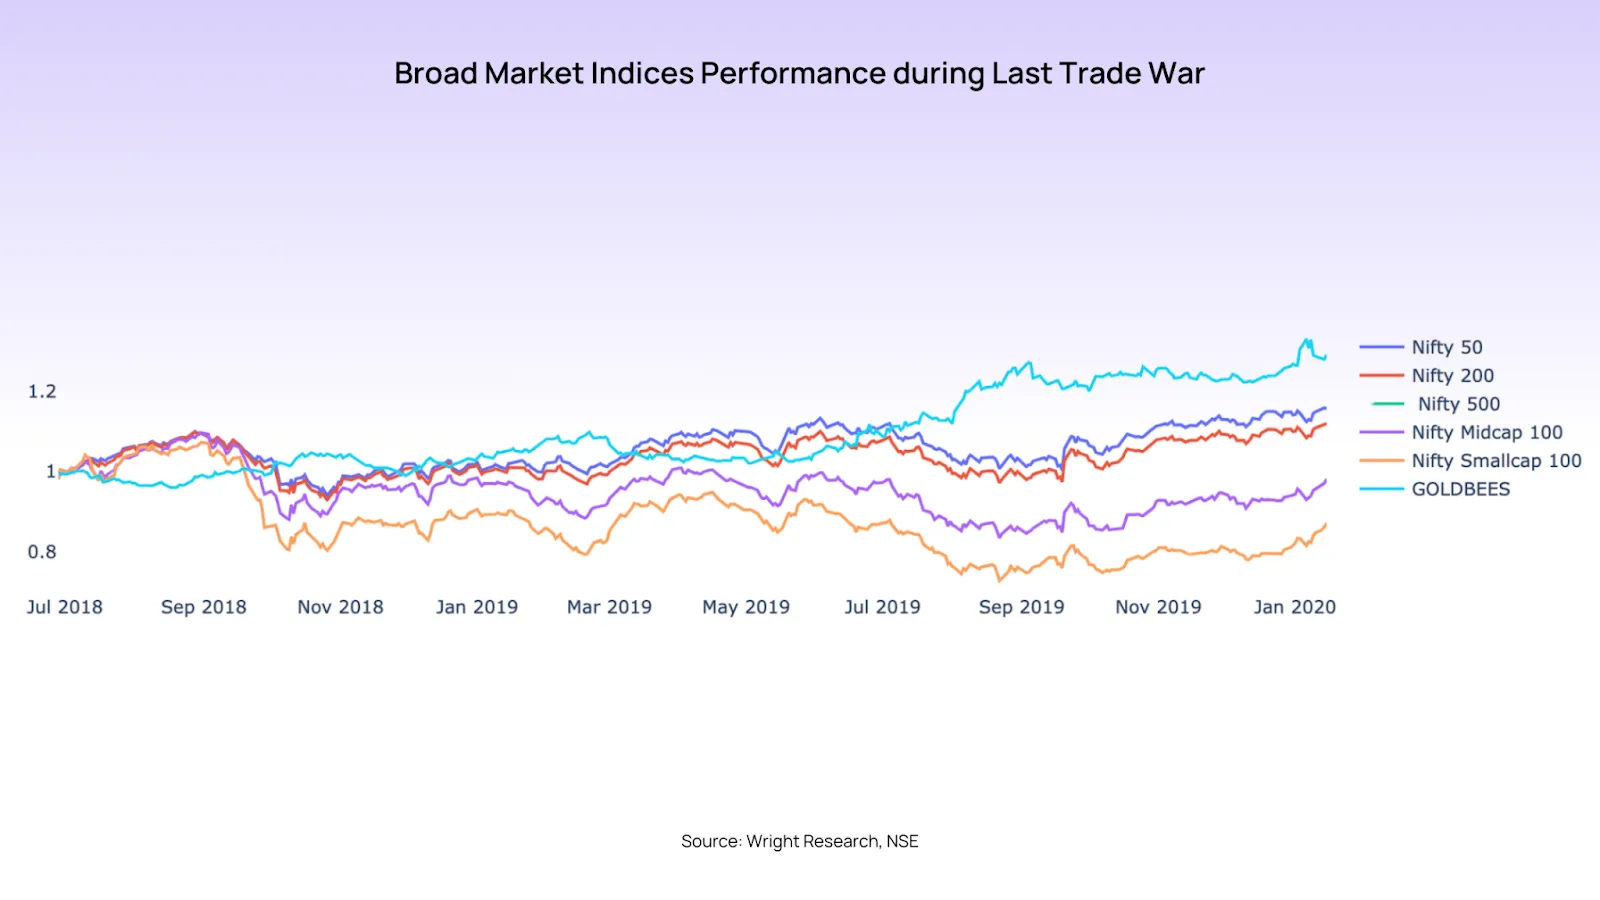
The US-China trade war influenced foreign portfolio investment (FPI/FII) in India
Year | FII Net Inflow/Outflow |
2018 | -33,014 (Outflows due to uncertainty) |
2019 | +1,01,122 (Return of investment confidence) |
2020 | +1,70,000 (Massive FII inflows post-COVID dip) |
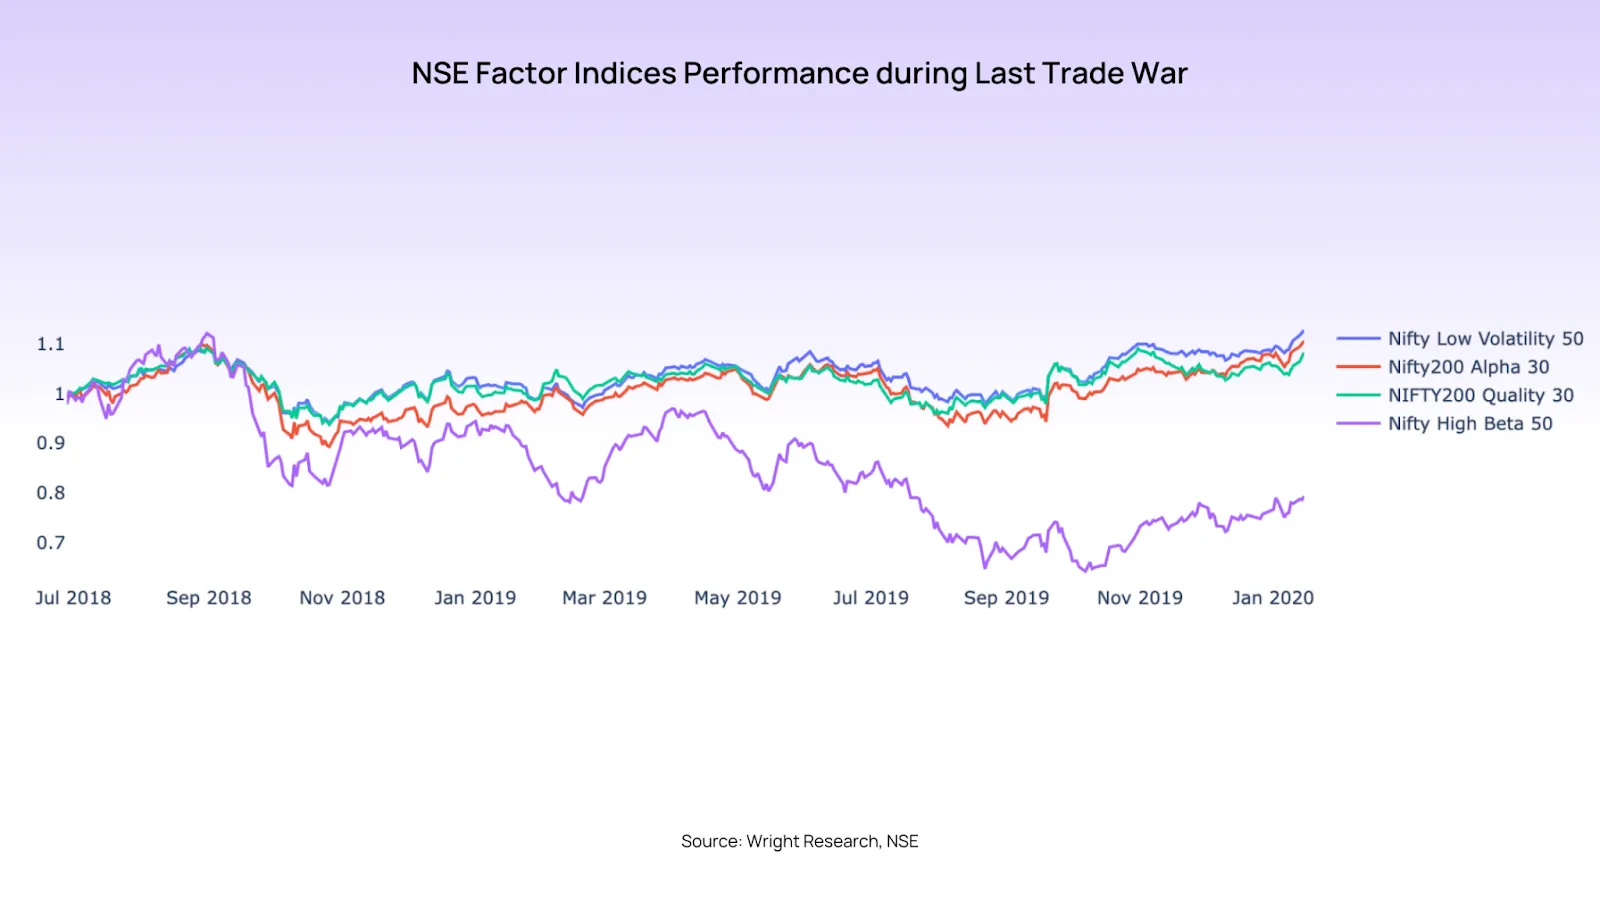
During the last trade war, high-beta stocks underperformed significantly, experiencing a sharp decline during periods of heightened global uncertainty. Meanwhile, low-volatility and quality-based indices exhibited greater resilience, maintaining relative stability and recovering faster as market conditions improved. There was a preference towards defensive and quality stocks during uncertain times, as global risk factors drove capital towards safer assets.
 Performance comparison with other emerging markets
India vs. China: While China’s stock market struggled due to tariffs, India saw increased FII inflows as a potential alternative investment destination.
India vs. Southeast Asia: Countries like Vietnam and Indonesia also benefited from supply chain shifts, but India had a larger stock market to absorb capital.
India vs. Brazil: Brazil saw capital inflows, but its economy faced internal challenges, making India a more stable bet.
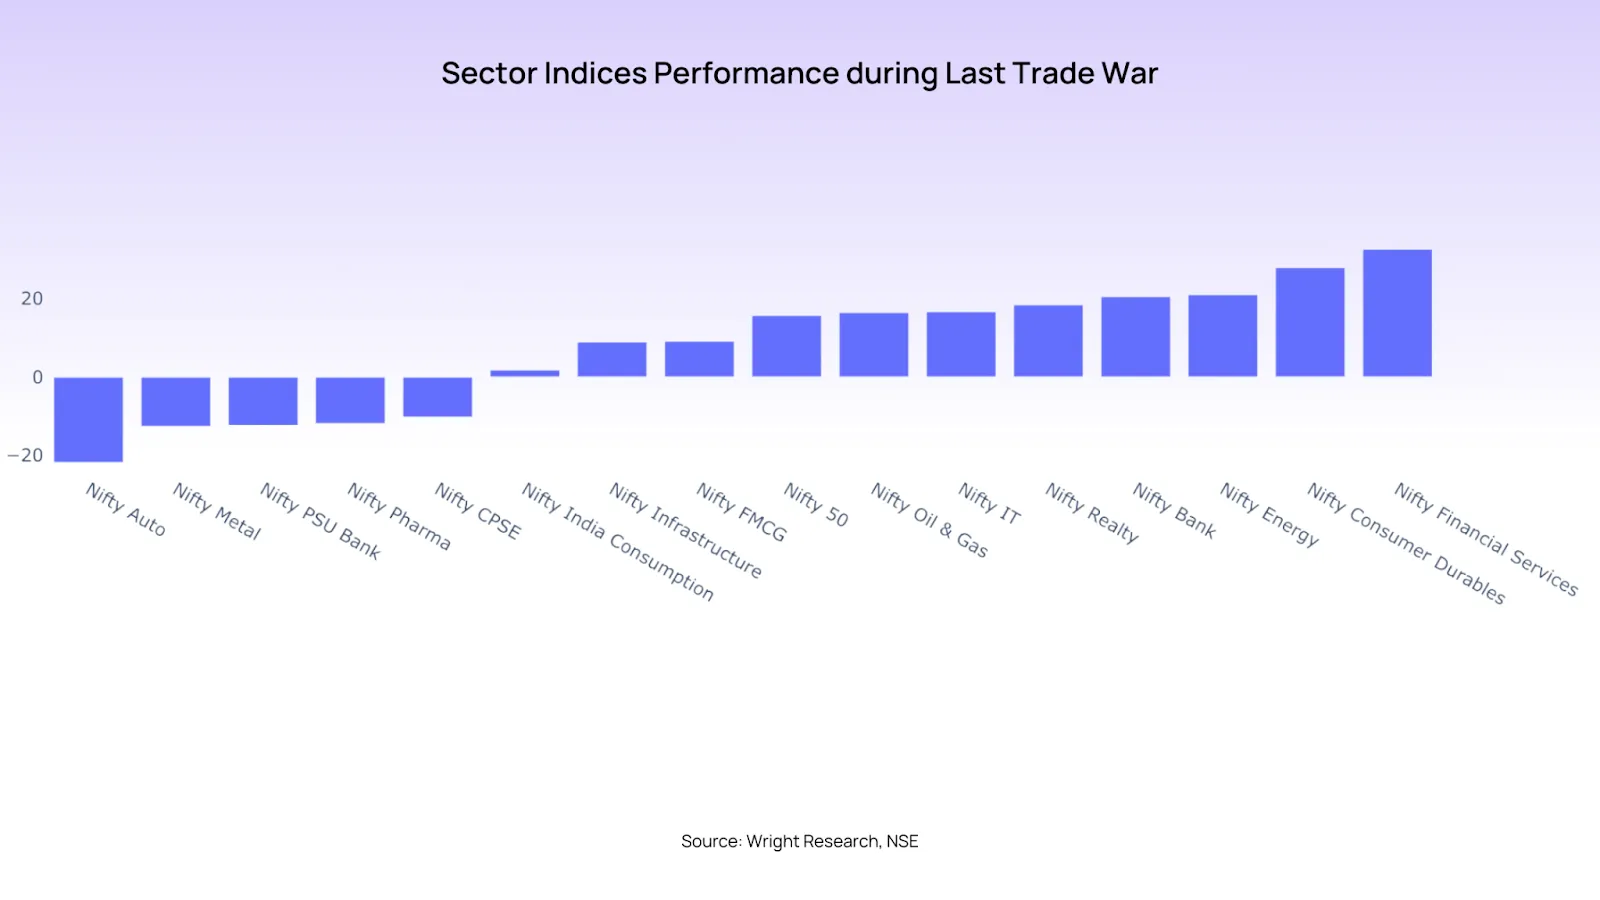
Sectoral Impact During the Last Trade War
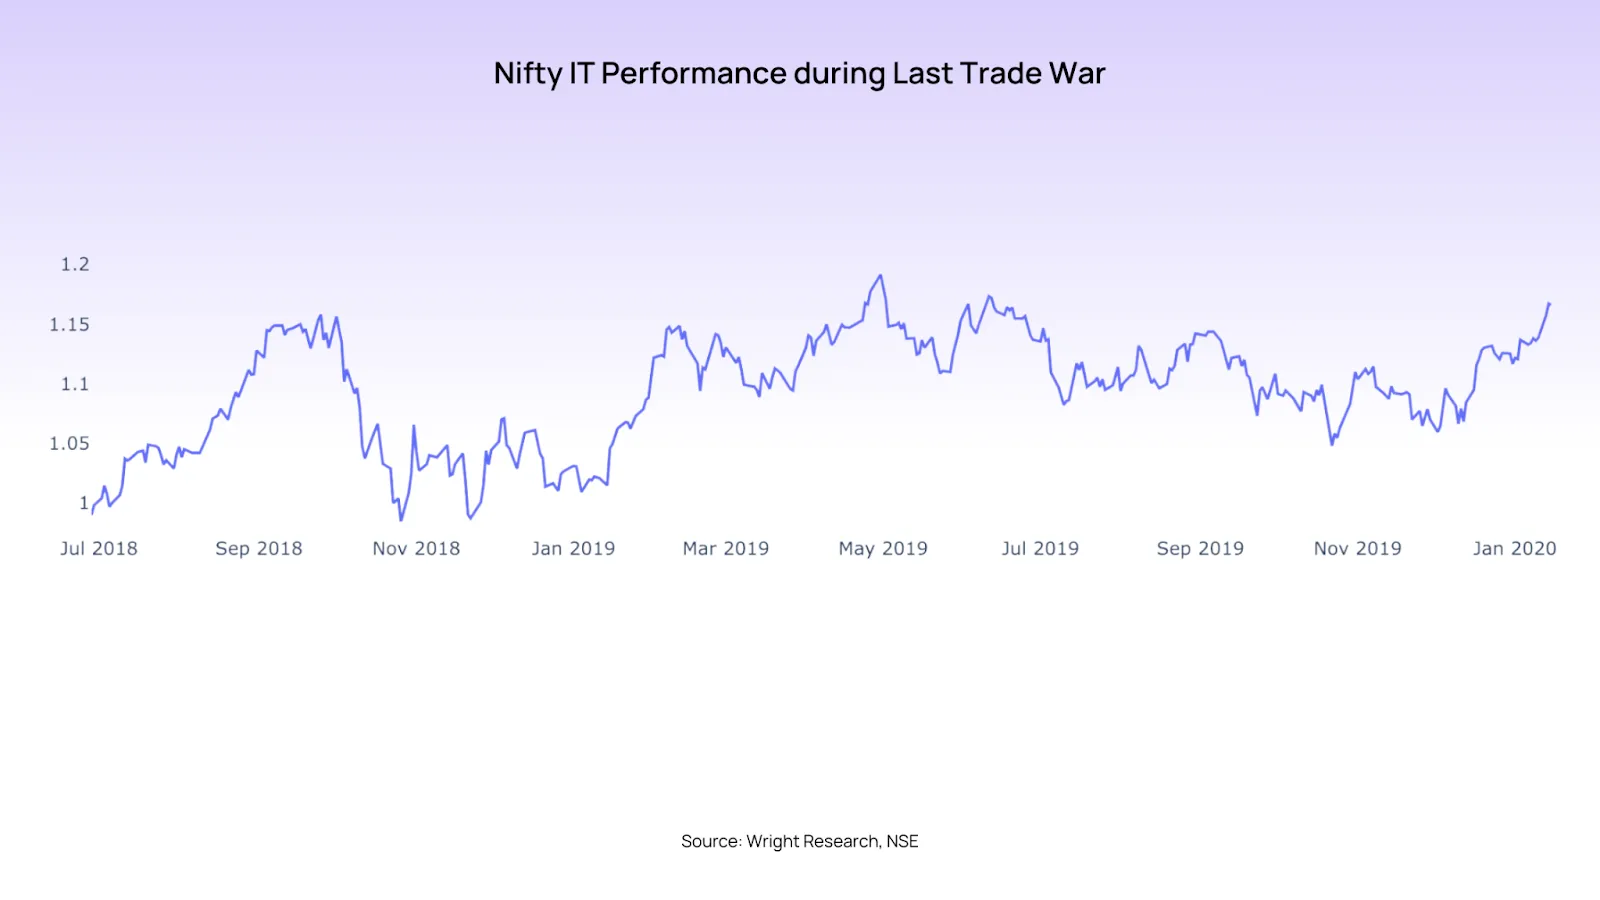
Information Technology
The previous trade war led to increased demand for Indian IT services as U.S. firms sought alternatives to Chinese tech solutions. In 2025, a similar shift is expected as geopolitical concerns continue to influence global outsourcing decisions.
Pharmaceutical
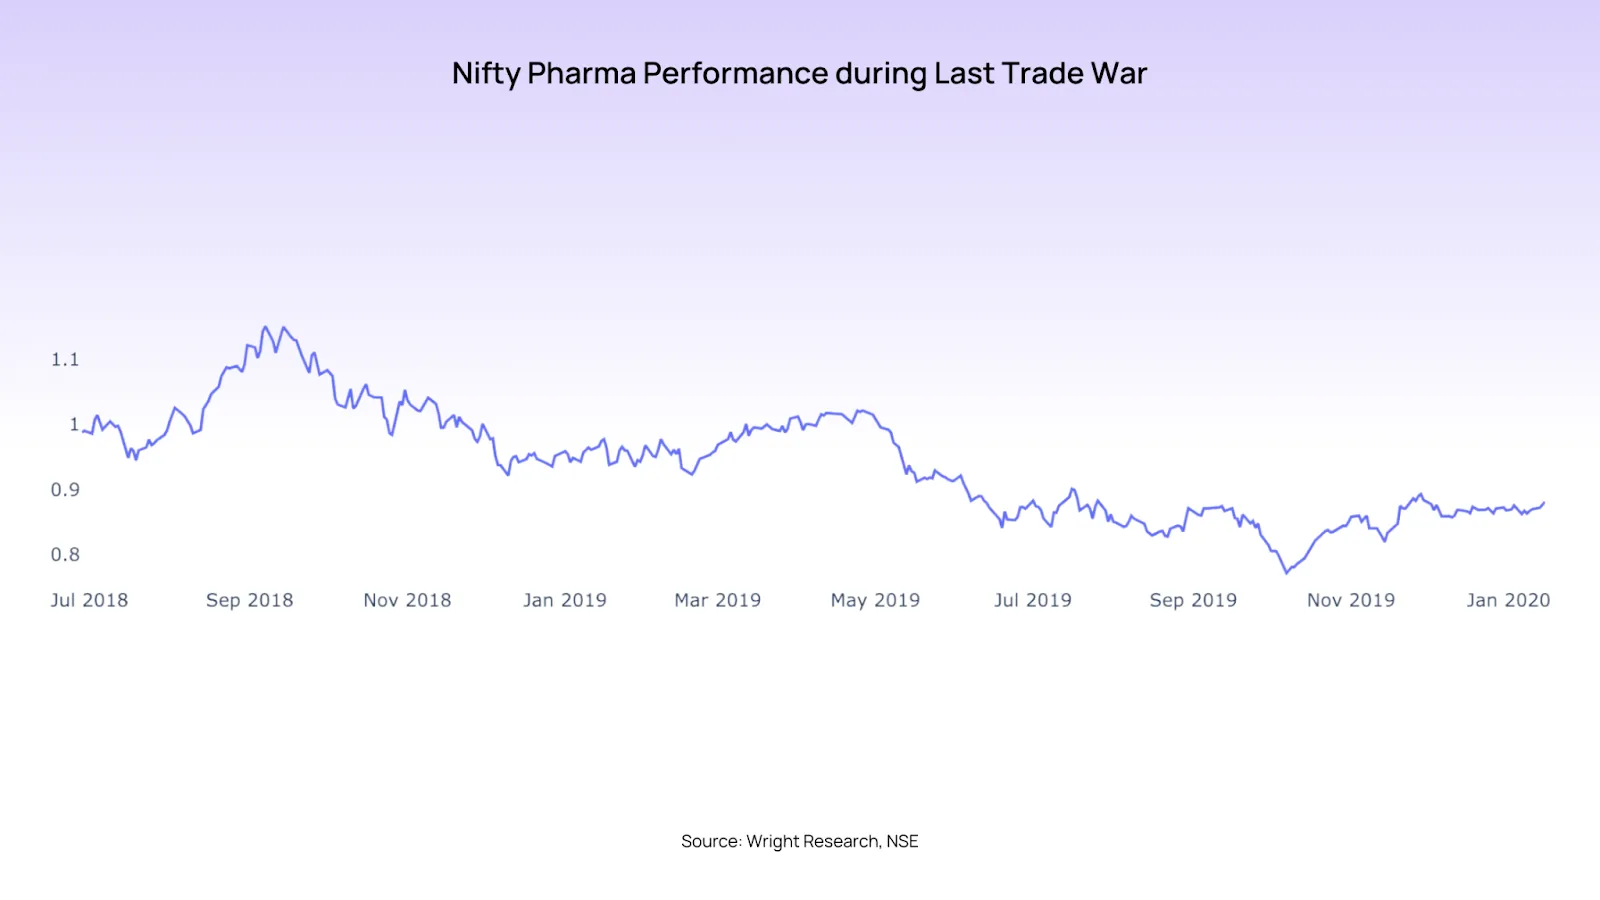
U.S. previously reduced reliance on Chinese Active Pharmaceutical Ingredients (APIs), boosting Indian pharmaceutical exports. Continued concerns over supply chain resilience may further strengthen India's role in this sector.
Metals & Commodities
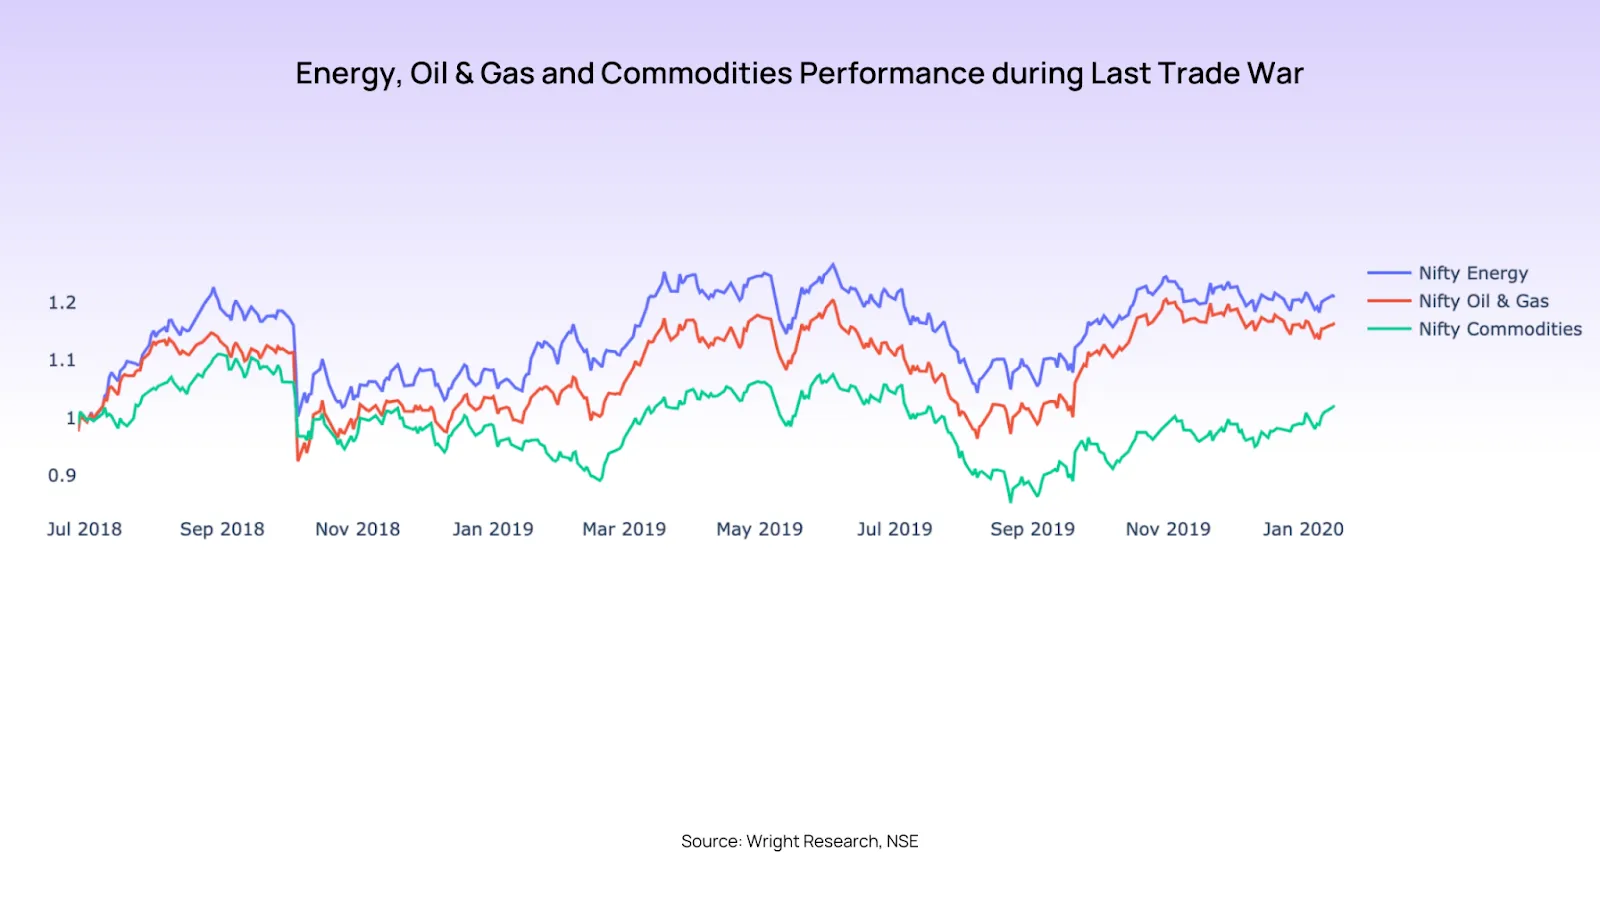
India’s steel and aluminum exports faced U.S. tariffs in 2018, impacting revenue. With ongoing trade tensions, global metal prices may remain volatile, influencing Indian producers and exporters.
Manufacturing & Electronics
Higher tariffs on Chinese goods encouraged supply chain diversification in 2018–2020, benefitting India’s electronics and manufacturing sectors. With renewed tariffs in 2025, India is well-positioned to absorb additional investments in key manufacturing industries.
Auto Sector
The earlier trade war disrupted supply chains for auto manufacturers, affecting production costs. In 2025, new tariffs on Chinese automotive parts may create opportunities for Indian exporters but could also increase input costs for domestic manufacturers.
Agriculture
The previous tariffs on U.S. agricultural exports to China created opportunities for Indian farmers, particularly in soybeans and other crops. In 2025, similar shifts in trade flows could benefit Indian agricultural exports.
Banking & Financial Services
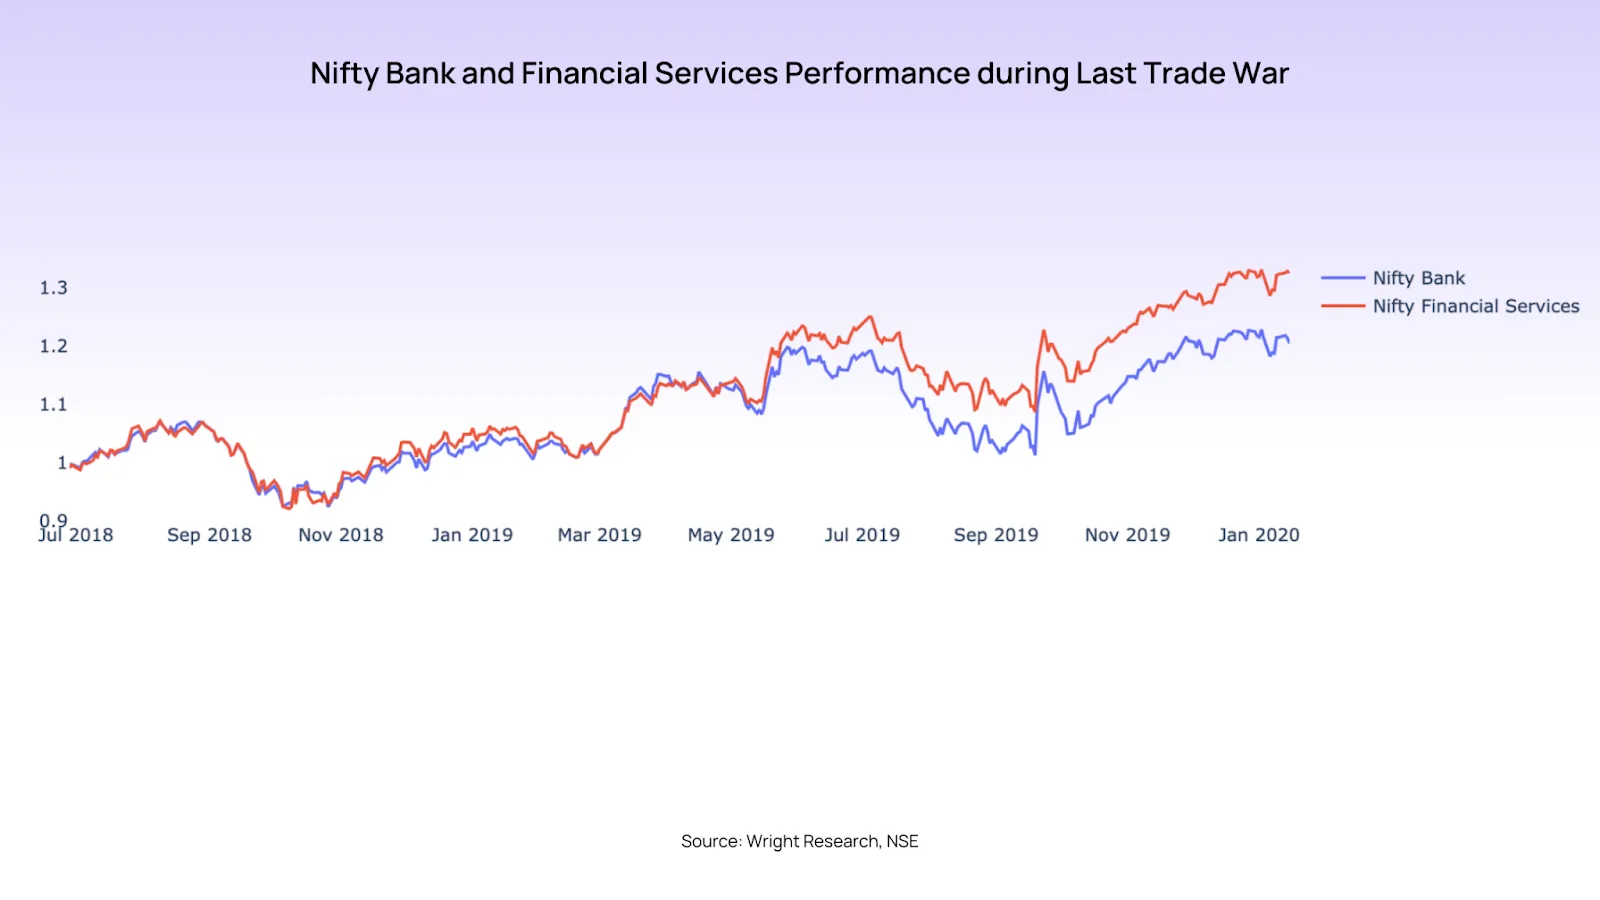
As investors looked for alternatives to China, India became a preferred destination for FDI and FPI, boosting liquidity in the banking sector. India’s financial and banking sector gained in terms of increased investments and credit growth, but also faced currency pressure and market volatility due to the global uncertainty caused by these trade wars.
Macroeconomic Effects of the Trade War
The trade tensions led to shifts in supply chains, volatility in financial markets, and changes in investment patterns. While some sectors of the Indian economy benefited from increased exports to the US, others suffered due to weak global demand, inflationary pressures, and financial instability. The trade war's impact on India's GDP growth, trade balance, foreign exchange rate, inflation, FDI, and employment was a mix of positive and negative outcomes.
GDP Growth Rate
The most significant macroeconomic effect of the trade war was the slowdown in India's GDP growth. In 2017-18, India's GDP grew at 8.3%, but as the global trade flows weakened during the trade war, the demand for Indian exports slowed down. This slowdown, combined with domestic challenges such as the NBFC liquidity crisis, resulted in India's GDP growth declining to 4.2% in 2019-20.
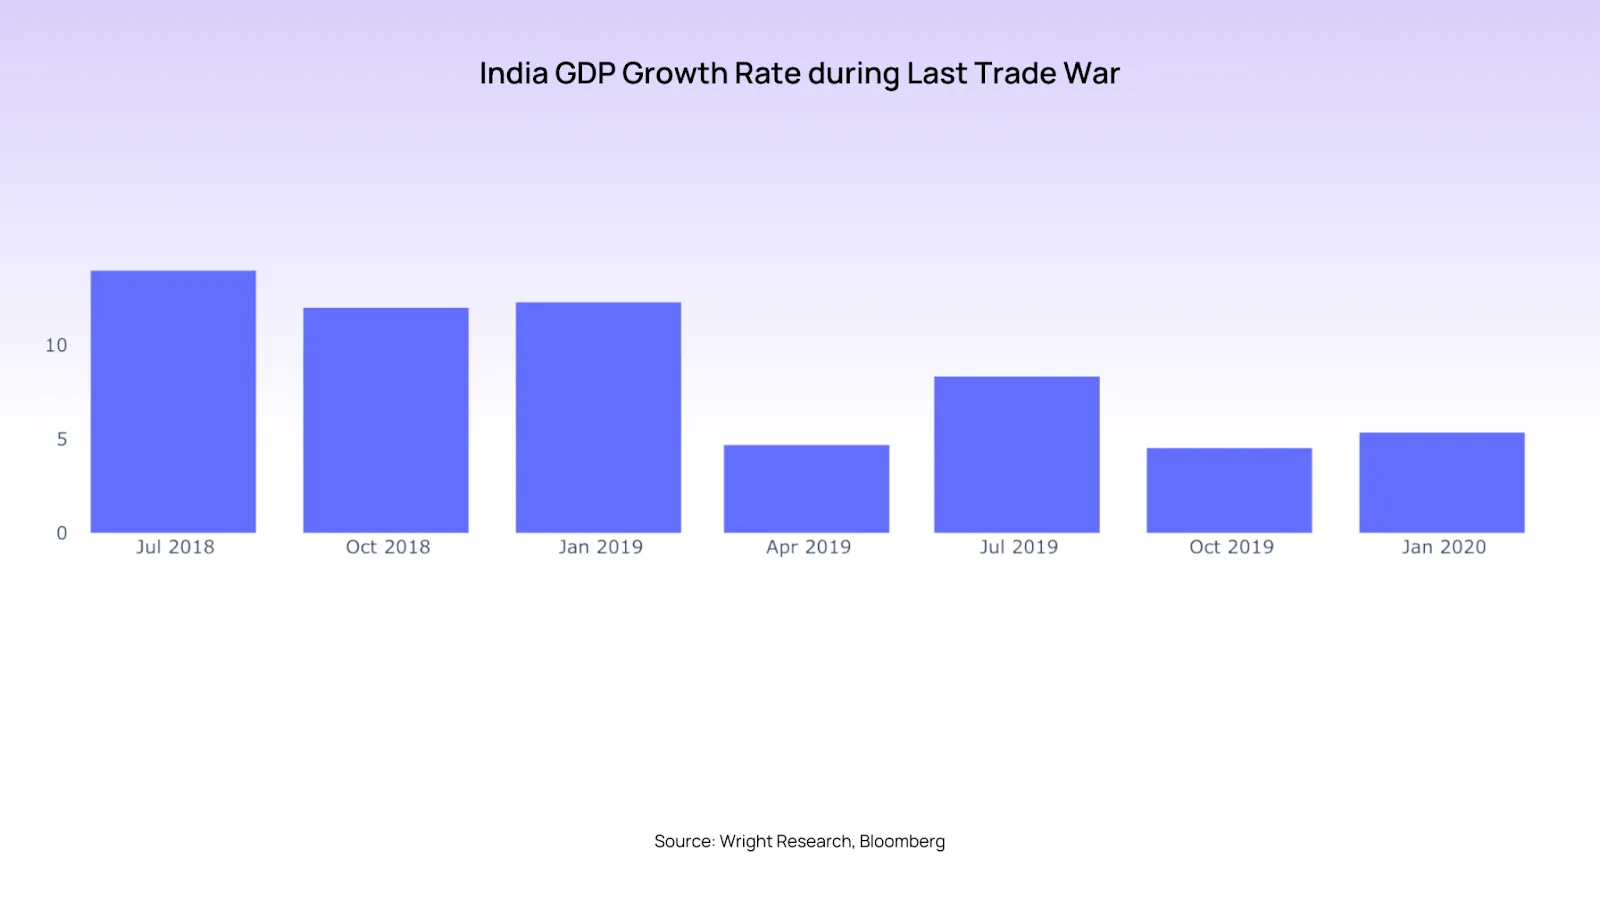
The uncertainty in global markets reduced private investment, while weak consumer demand in India further dampened economic growth. The manufacturing sector, particularly the auto and metals industries, suffered from low industrial activity and declining consumer confidence. Despite government efforts to revive growth through tax cuts and liquidity support, the lingering effects of the trade war continued to slow economic momentum.
Trade Balance and Export Growth
The US-China trade war created opportunities for Indian exporters, especially in IT services, pharmaceuticals, chemicals, and textiles. The US, in its attempt to reduce dependence on Chinese imports, increased purchases from India. As a result, India’s exports to the US grew by 15.6% in 2019, particularly in chemicals and engineering goods. The textile sector also saw a moderate rise in exports as US buyers looked for alternative suppliers to replace Chinese manufacturers.
Year | Export ($ Billion) | Growth (%) | Import ($ Billion) | Growth (%) | Trade Deficit($ Billion) |
2017-18 | 303.5 | +10% | 465.6 | +10.4% | -162.1 |
2018-19 | 330.1 | +8.8% | 514.1 | +10.4% | -184 |
2019-20 | 324.6 | -1.8% | 467.2 | -9.1% | -142.6 |
However, India's total export growth declined by 1.8% in FY 2019-20 due to weaker global demand. At the same time, imports fell by 9.1%, driven by lower crude oil prices and reduced domestic demand for industrial raw materials..
Exchange Rate and Rupee Depreciation
The global uncertainty caused by the trade war also affected the Indian rupee, which depreciated by 9.5% from ₹63.5 per US dollar in early 2018 to ₹69.6 by January 2020. The sharp depreciation was driven by a combination of capital outflows, a strong US dollar, and global risk aversion.
While a weaker rupee made Indian exports more competitive, it also raised import costs, particularly for crude oil and industrial raw materials. This put pressure on domestic businesses, as they had to pay higher prices for imported goods. Despite the RBI’s interventions in the currency markets, the rupee remained volatile throughout the trade war period.
Inflation and Commodity Prices
The disruptions in global supply chains due to the trade war increased inflationary pressures in India. By the end of 2019, Consumer Price Index (CPI) inflation had surged to 7.6%, compared to 3.6% in 2018. This sharp rise in inflation was driven by:
Higher food prices, especially vegetables and pulses, which saw a 20% price increase in 2019 due to supply shortages.
Increased costs for imported goods, as the rupee depreciation made imports more expensive.
Oil price volatility, with Brent crude fluctuating between $50 and $75 per barrel, impacting fuel prices in India.
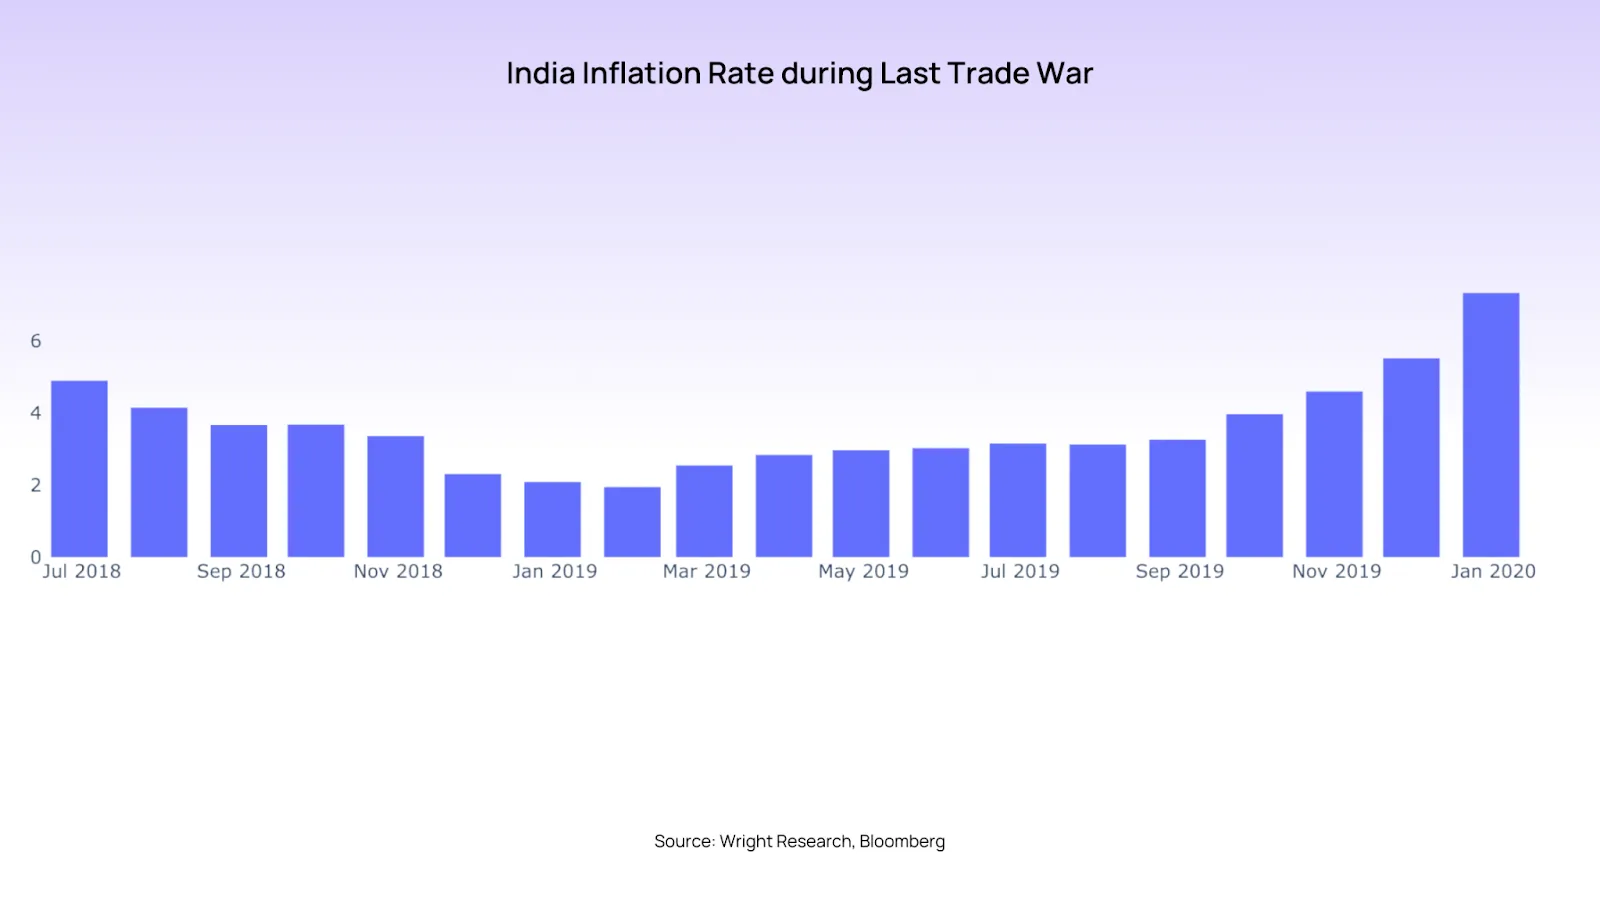
The rise in inflation reduced consumer purchasing power, adding to the slowdown in economic growth. The RBI had to cut interest rates multiple times in 2019 to support demand, but inflation remained a challenge throughout the period.
See what markets are pricing in
Live indices, sector moves and market breadth — the backdrop to every story we publish.
Conclusion
The last trade war had a profound and multifaceted impact on India, influencing its trade dynamics, sectoral performance, and macroeconomic stability. While India benefited in certain areas—such as increased exports to the US, growth in specialty chemicals and pharmaceuticals, and rising foreign investment—the overall economic impact was largely negative due to the broader global slowdown and domestic economic challenges. Despite some short-term opportunities, India’s inability to fully replace China in global supply chains limited its long-term gains.
While this time the dynamics might be different, looking at the previous situation can in fact give us a lot of context and help us form our expectations for the future. Investors need to take account of the implication of the trade war for their portfolios and India needs to adopt strategic policy measures such as enhancing manufacturing competitiveness, diversifying exports, improving ease of doing business, and strengthening domestic consumption to mitigate future global trade disruptions and position itself as a stronger player in global supply chains.


