Stock prices are always sensitive to new information. And elections are probably one of the biggest events that a country, its people, economy & society go through. It is a recurring event that will occur on a fixed time schedule and as such there is very little sudden event or announcements that can fundamentally shape how stock markets should behave when election cycles start. Stock markets also become a measure of political sentiment and economic stability, during these election periods. Investors closely monitor the elections as the outcomes can considerably affect market dynamics, and some investors may even be tempted to time the market in such cases.
Political uncertainty based on which party will come in power, who will lead in which states and many other facets of the political landscape are some of the key challenges investors need to think about when looking at how elections impact Indian stock markets. Let’s look at this a little deeper.
How have elections impacted US stock markets?
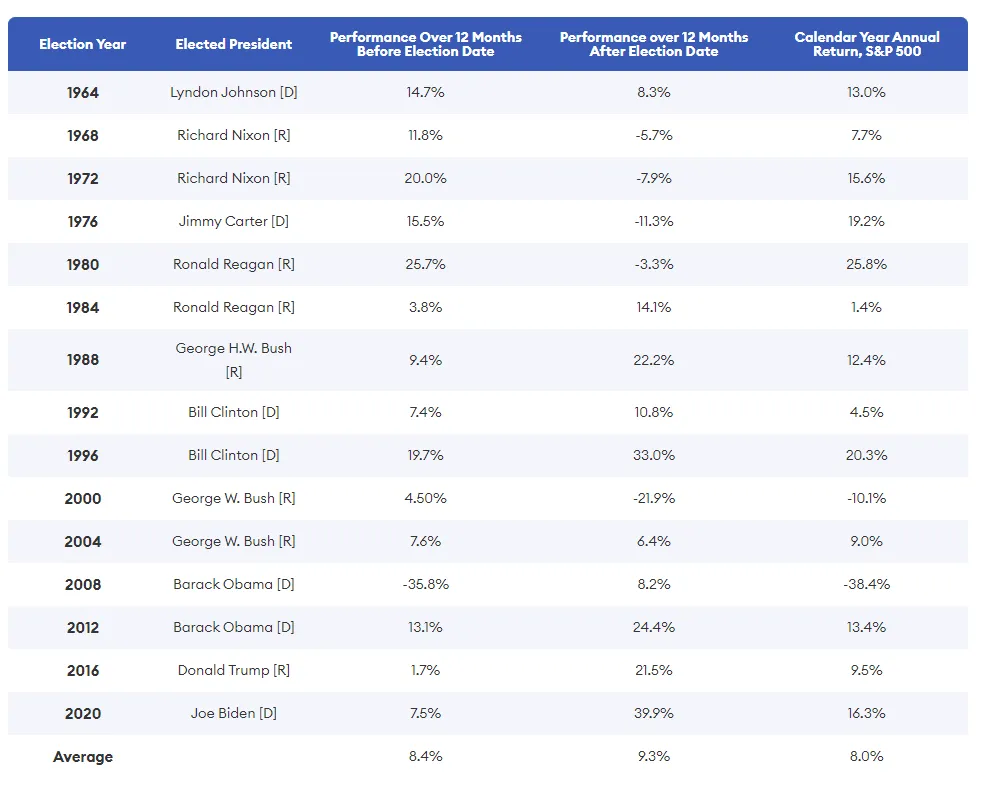
Presidential elections in the US are held every 4 years. A U.S. Bank analysis revealed discernible patterns during election cycles, pinpointing a subdued market performance in the 12 months preceding a presidential election.
Analysts reviewing market data for the S&P 500 since the 1930s have observed similar patterns indicating a more subdued performance of both equity and bond markets in the year preceding a presidential election. On average, equities tend to yield gains of about 8.5% in a standard 12-month period, but this figure diminishes to below 6% in the lead-up to a presidential election. Similarly, bond markets typically yield returns of 7.5%, which drop to around 6.5% in the year preceding a presidential election.
When a new party assumes presidency, the stock market gains average around 5%. Conversely, the retention of the presidency by the same party yields slightly enhanced returns, averaging 6.5%. There are obvious shifts in power where the returns have been higher such as the Bush Senior era, Clinton’s re-election, Obama’s first election, Trump’s first election & Joe Biden’s first election have shown strong performance during the 12 months post election date.
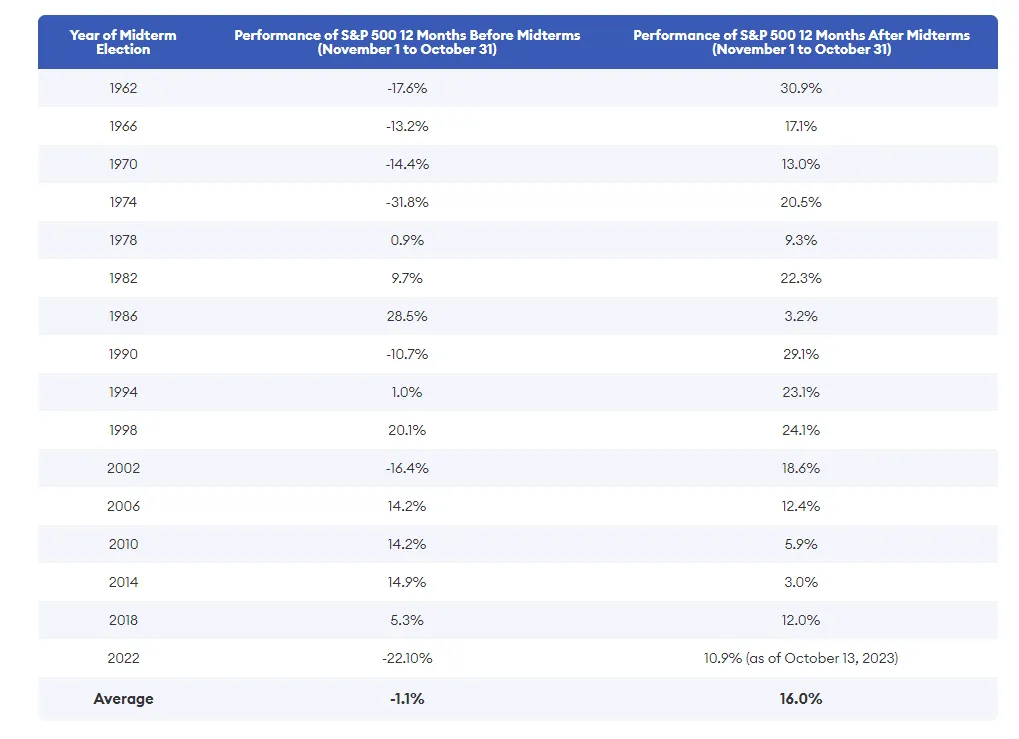
Midterm elections which determine the composition of Congress and lead to changes in legislative control and agendas. Historical analysis over 60 years reveals that the S&P 500 typically underperforms in the 12 months leading up to midterms, averaging a return of -1.1%, a decrement from the overall 8.1% average. However, following the midterm elections, a reversal occurs, with the market exhibiting bolstered performance, marked by above-average returns. As of October 13, 2023, the post-midterm 12-month average return stood at an impressive 16.0%. This indicates a significant market recuperation and robust performance subsequent to the uncertainties settled by the midterm elections.
Research conducted in developed economies such as the United States largely concludes that stock markets perform better under Democratic presidencies and see enhanced performances in the second half of presidential cycles, specifically with Republican incumbents.
How have elections impacted Indian stock markets?
Changes in governments or political parties and ideologies, can cause changes in government policies, economic priorities, and regulations, affecting various sectors and companies. While elections create short-term volatility, the long-term effects are mostly shaped by the economic reforms and policies implemented by the ruling party. However, there has been limited research and insight into how Indian stock markets have been affected by elections. So, let’s dig a little deeper and see what’s happening.
Here’s the quick & short summary - Examining the Sensex returns during the tenures of different Prime Ministers reveals that election politics do not profoundly sway equity returns. The overall trajectory of wealth creation remains consistently positive, maintaining a long-term upward trend irrespective of the political leadership or party in power. But…there are variations, and specific points in time when this hasn’t always been the case.
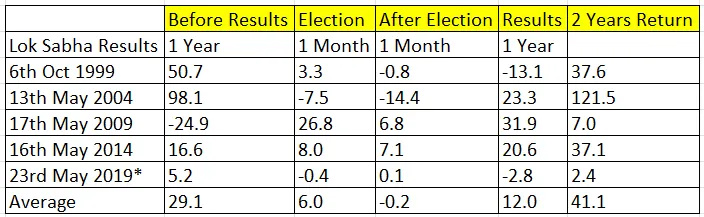
In the periods leading up to general elections, stock markets typically exhibit increased volatility due to uncertainties regarding election outcomes and potential policy shifts. Analyzing past market performance, the average return one year before the elections is 29.1%, and in the one month before elections, the average return is 6%. These statistics indicate strong market performance in pre-election periods. Notable exceptions include 2009, where a pre-year market fall of 24.9% occurred, but was offset by a significant 26.8% market surge in the post-election month. Therefore, despite uncertainties and a tendency for a "wait-and-see" approach amongst investors pre-election, historical data suggests the market has generally performed well during these times.
Looking at Indian elections from 1989 till 2019 & their impact on Indian stock markets
1989: Coalition Era
Political turmoil marked this period, leading to market volatility due to a united opposition forming the National Front coalition. The subsequent reform and anti-corruption measures could not immediately stabilize the economy, reflecting the disruptive impact of elections.
1991: Congress Era
Market instability intensified post-1991 following PM Rajiv Gandhi’s assassination. However, under PM PV Narasimha Rao, economic liberalization policies were introduced, bolstering market confidence and initiating economic recovery and growth.
1996-1998: Unstable Coalition Government
The period between 1996 and 1998 saw political unrest and external economic pressures affecting the market. Frequent changes in leadership and the Asian Financial Crisis led to reduced market confidence and economic downturn.
1999: NDA in Power
Election results were as expected for stock markets. Sensex increased 7% and rose for the next 3 months. NDA’s victory largely brought market stability, witnessing a rally in Sensex and an enhanced GDP growth rate of nearly 6-7%. The government largely focused on sectoral reforms, structural changes, liberalization policies attracting FDIs and boosting the economy. Inflation was within reason and market performance was strong initially. However, global events such as the 9/11 attack on USA and even domestic factors led to a significant market downturn with stock markets falling around 50%. Annual CAGR was around 3% and absolute performance was around 14%.
2004: UPA Era
Following the 2004 elections, the market faced a sharp decline, losing 15% in 2-3 trading sessions due to an unexpected UPA victory. However, this phase was followed by a robust bull market that lasted until 2007, with the GDP growth rate hovering around 8% and FDI reaching a record $34 billion. The global financial crisis of 2008 hampered the bull stock market, but recovery was seen by 2009 before the next election cycle started.
2009: UPA’s Second Term
UPA’s return in 2009 initiated a 17% market gain on a single day. Despite this, the market fluctuated due to prevalent scams during UPA’s second term. Investor confidence waned, affecting both domestic and foreign investments and resulting in reduced capital inflows. Policy uncertainties, along with the government’s struggle to manage fiscal deficits and inflation, characterized this period, even though the Sensex saw a 15.5% increase in the first three years.
2014: NDA’s Return (Modi Wave)
The NDA’s 2014 victory, led by the BJP, brought a resurgence in market optimism, reducing volatility to 9.1% from 17.96%. Expectations of economic reforms underpinned this sentiment. While the market experienced a substantial rally, reaching new highs, a growth rate of around 40% over four years was seen by some as subdued, influenced by factors such as global oil prices and a weakened Indian rupee.
2019: BJP Continues in Power
The 2019 elections underscored the market’s sensitivity to political events. The BJP's continued governance led to a market upswing, driven by expectations of sustained economic reforms and policy stability. Initiatives like "Make in India" and strategic tax reforms characterized this period. However, growth was constrained by global trade tensions and structural issues within pivotal economic sectors.
Broad Market Insights for Indian Stock Markets During Elections


10 yr Benchmark G-Sec's Surge:
The 10 yr Benchmark G-Sec, which is a government security, showed a significant rise one month after the event, recording a growth of 7.50%. This suggests a potential flight to safety or increased demand for government bonds, possibly due to market uncertainty or changes in monetary policy.
Top 50's Consistent Growth:
The 50 index showed consistent growth leading up to the event, especially notable 6 months before with a 17.81% increase. However, it faced a slight decline of -0.26% a year after the event, indicating possible market corrections or changing investor sentiment.
Midcap 100's Strong Post-Event Performance:
The Midcap 100 index exhibited a robust performance post-event, especially one month after, with a notable 28.39% rise. This suggests that mid-sized companies were favored by investors or outperformed during this period.
Smallcap 100's Remarkable Turnaround:
The Smallcap 100 index showed a striking recovery. Despite a decline of -13.29% a year before the event, it surged by 31.88% one month after. This can indicate a renewed interest in smaller companies or the perceived undervaluation of these stocks leading up to the event.
Sectoral Analysis of Indian Stock Markets During Elections
The data provides a glimpse into the performance of various sectors both prior to and after the election. The performance is quantified in terms of percentage changes across specific time intervals: 1 year before, 6 months before, 1 month before, 1 month after, 6 months after, and 1 year after the election.


Post-Election Stars:
The Pharma sector witnessed a significant uptick one month after the election, registering a 30.54% increase, making it the highest-performing sector during this period.
Auto sector also showed a robust performance post-election, especially 6 months after with an increase of 19.30%.
Consistent Performers:
Private Bank and CPSE sectors showed steady growth across most time frames after the election, indicating resilience and possibly investor confidence in these sectors.
Underperformers:
The IT sector seems to have faced challenges post-election. From being one of the top sectors a year before the election, it saw a decline of 19.61% a year after the election.
The Metal sector also remained in negative territory for most periods, with the biggest drop of 7.70% one month after the election.
Realty, despite a sharp decline of 23.75% a year before the election, managed to recover somewhat post-election, showing a positive growth of 10.89% a year after.
Mixed Bag:
Financial Services showed a positive trend post-election, especially one month after with a growth of 14.39%.
Bank and PSU Bank, after having strong performances before the election, witnessed a decline in the subsequent periods, with the Bank sector even going negative with -1.77% a year after the election.
Stable Sectors:
FMCG and Infrastructure sectors showed relatively stable performances with minor fluctuations, indicating possible investor trust in their long-term prospects.
Analysis of Investing Factors in Indian Stock Markets During Elections


Alpha's Strong Comeback:
Alpha , which represents the excess return of an investment relative to the return of a benchmark index, showed a significant recovery. Alpha factor had a decline of 13.80% a year before the event but witnessed a whopping 43.47% surge one month after, suggesting strong investor confidence or possible outperformance relative to the benchmark during this period.
Consistent Dividends:
Dividend, which often represents stocks that yield dividends, showed consistent positive growth throughout the periods, especially post-event. This might indicate a preference for dividend-yielding stocks during uncertain times or their inherent stability.
Volatility's Mixed Bag:
The Volatility factor, which often represents stocks with significant price swings, saw a strong performance, especially one month after the event with a rise of 28.42%. This could be indicative of a more volatile market phase or the profitability of trading volatile stocks during that period.
Quality's Steady Growth:
Quality factor, typically associated with stocks of high-quality companies (those with strong fundamentals), showed modest but steady positive growth, especially post-event. This can be indicative of investors seeking safe havens in companies with strong fundamentals during uncertain times.
Momentum's Standstill:
Interestingly, the Momentum factor , which represents stocks that have shown a recent trend of upward price movement, remained unchanged throughout all the periods. This could be a data anomaly or suggest that momentum strategies were neither profitable nor unprofitable during these times.
Value's Slight Recovery:
The Value factor, associated with stocks perceived to be undervalued, showed minor fluctuations. It went negative one month after the event but managed to recover slightly in the subsequent periods, suggesting a mixed sentiment towards value stocks.
Indian economy & Indian stock market performance is not dependent on elections
India has largely pursued market-driven policies since 1980, characterized by deregulation, liberalization, and privatization. Various governments have emphasized different aspects of economic reform, from infrastructure and FDI to populist measures, but the broader direction has consistently been pro-growth.Investors need certainty, which is derived from political stability. In India, governments since 1999 have completed full terms which means there is a stable economic and political environment. As investors, you should be wary (if not hate) uncertainty that comes with unexpected events. Known uncertainty is manageable, unknown uncertainty is the fundamental issue.
Different administrations brought diverse approaches to reforms. While the BJP-led NDA emphasized infrastructure, FDI, and digital transformation, despite missteps like demonetization, the Congress-led UPA focused on private investment in infrastructure and rights-based reforms but faced challenges like corruption and macroeconomic stability management.
.
Long-term market performance seems to be resilient to government changes. Even when unexpected election outcomes led to significant market corrections, such as in 2004, consistent economic reforms and a sturdy private sector have allowed the market to bounce back and maintain an overall positive trajectory. The Indian growth story remains strong . So how will 2024 elections impact Indian stock markets? What will happen to the new India economy?
Who will win 2024 Indian stock market elections?
A Morgan Stanley report on the 2024 elections predicts varied market responses based on election outcomes. A clear majority win by the current government could lead to a market gain of 0% to 5% in the subsequent 3 months. Jefferies finds a 10% probability of a BJP defeat in 2024 and expects markets to correct by 10%. However, a win without a clear majority resulting in a coalition government might cause the market to fall between 5% and 25%. The most negative scenario, where the current government loses and a weak coalition is formed with the leading party having fewer than 200 seats, could result in a drastic market crash of up to 40%.
How will 2024 elections affect Indian stock markets?
The upcoming 2024 general elections in India, scheduled for April and May, are influencing the Indian stock markets and the broader economic landscape. Investors are closely watching election developments due to their potential significant impact on market dynamics. The stock market functions as a reflection of political sentiment and economic stability during election periods, affecting various sectors and participants, from Dalal Street to common labourers.
Year | Party in Power | Consequence (After Six Months) |
2004 | UPA (United Progressive Alliance) | Sensex increased by 13% due to perception of Dr Manmohan Singh and P Chidambaram as advocates for reform. |
2009 | UPA (United Progressive Alliance) | Sensex remained stable with no notable policy shifts compared to the previous UPA term. |
2014 | NDA (National Democratic Alliance) | Early policy reforms, such as fiscal consolidation and inflation control, led to a 9% rise in the Sensex. |
2019 | NDA (National Democratic Alliance) | The GDP growth rate dropped, and market performance was modest due to global economic conditions and domestic consumption issues. |
Stock markets often react swiftly and dramatically to election outcomes. A government elected with a clear mandate usually reassures investors, resulting in positive market reactions. In contrast, uncertain or fragmented election results tend to cause market turbulence. Historically, average returns have been -0.2% one month after elections and 12% one year after elections.
Political transitions that occur due to elections can initiate changes in government policies, economic priorities, and regulations. Such changes can further influence various sectors and companies, bringing short-term volatility and long-term effects determined primarily by economic reforms and policies implemented by the ruling party. It's vital to explore historical data to understand the relationship between the stock market, economy, and elections, highlighting the significance of policy continuity, economic reforms, and stability for sustained growth.
Investors, particularly those focusing on the long term, should base their portfolio allocation decisions on their risk profile and financial objectives, not solely on possible election outcomes or event-driven return scenarios. It’s also necessary to recognize that elections are a continuous aspect of India’s democracy, occurring every 5 years, leading to various political results, such as coalitions and majority governments. The underlying sentiment is that, in the long term, the market tends to recover and perform positively, maintaining a general pro-growth direction regardless of government changes.
What is the outlook for the Indian economy going forward?
Between 1980 and 2023, India’s government changed 11 times, with eight being coalitions. Since 2014, the BJP has maintained a clear majority. Since 1980, the average real GDP growth has been 6.2%, and the Sensex has shown compound annual growth of 9.5% in dollar terms and 15.5% in rupee terms up to August 2023. Speculations about the 2024 general elections affecting the market exist due to a unified strategy from the opposition against the BJP.
Coalition governance in India allows for consensus-driven decisions, enabling significant reforms. However, it limits the economy’s potential pace of growth compared to countries like China. India's long-term real GDP growth potential is projected to be 6.0%-6.5%, implying an 11%-12% nominal GDP growth. This, along with corporate productivity, strong earnings , AI’s impact & continued influences equity markets. Expect double-digit nominal returns to continue for the next two decades. The essential advice for long-term investors is to invest in India.
However, long-term investors shouldn’t be overly concerned as the broader economic direction of India has generally been pro-growth, regardless of the governing party. Governments have been continuing the reform process, encouraging private enterprise, and linking the economy closely to global markets. This, along with a focus on either hard aspects, like infrastructure, or softer reforms aimed at improving productivity, suggests a continuity in policies aimed at a market-driven economy, making it resilient against political shifts.
Visit Alpha Prime Smallcase , Momentum Smallcase , and New India Smallcase !
Also Read:
- Top 5 Stocks to Consider Before 2024 General Election Results
- Navigating the Future of Indian Equities Post-2024 Elections: Opportunities and Challenges
- Lok Sabha Election 2024 - 5 Smart Investment Strategies
- Elections 2024 and Their Impact on the Stock Markets
Wright Research Telegram and Youtube Channel
Join our Telegram Channel to get daily morning market updates. Subscribe to our Youtube Channel to learn about all things investing, understand sector performance, get key insights into new topics like concentrated portfolio, quantitative investing and more!
Read our article to understand Buying Stocks in October, November & December? Evidence of Seasonal Patterns in Global & India
Our Investment Philosophy
Learn how we choose the right asset mix for your risk profile across all market conditions.
Subscribe to our Newsletter
Get weekly market insights and facts right in your inbox