

Low financial leverage can make a company more resilient when interest rates rise or demand weakens. Yet “debt free” is often used too loosely. A screener may show no bank borrowings while the annual report still contains lease liabilities, supplier financing, guarantees, preference shares or debt inside a subsidiary.
This guide explains how to research debt free stocks in India using FY2025-26 financial statements. It treats a stock as a screening candidate, not an automatic recommendation. Investors still need to assess valuation, profitability, cash conversion, governance and the opportunity cost of maintaining an underused balance sheet.
Indian equity analyst checking annual reports, cash resources, borrowings and lease obligations
What Qualifies as a Debt-Free or Near-Zero-Debt Stock?
A strict definition means the consolidated balance sheet reports no interest-bearing borrowings at the selected date. Near-zero debt can describe a small borrowing balance relative to cash, equity or operating profit, but the threshold must be stated. Net cash means cash and qualifying investments exceed borrowings; it does not mean gross borrowings are zero.
The definition should also decide whether lease liabilities count. Accounting standards recognise many leases on the balance sheet, and these obligations create fixed payments even when a database’s debt field excludes them. For this article, zero debt stocks are candidates with no conventional borrowings identified in the latest consolidated statements, followed by a separate review of leases and other fixed claims.
Financial companies require different treatment. Deposits and market borrowings are operating raw material for banks and NBFCs, so comparing them with debt-free manufacturers or software companies is misleading.
See what markets are pricing in
Live indices, sector moves and market breadth — the backdrop to every story we publish.
Best Debt Free Stocks in India 2026: Screening Table
The following table is a research shortlist, not a buy list. It highlights profitable, liquid businesses commonly found in screens for debt free companies in India. Investors must recheck the latest consolidated filing because a quarterly acquisition, lease, working-capital facility or subsidiary borrowing can change the result.
| Company | Segment | Why it enters the screen | Mandatory verification |
|---|---|---|---|
| TCS | IT services | Large liquid investment balances and no conventional borrowings line in the FY2025-26 consolidated balance sheet | Lease liabilities, preference shares and acquisition-related obligations |
| Infosys | IT services | ₹43,075 crore consolidated cash and investments reported for FY2025-26 | Lease liabilities, buyback effects and overseas subsidiaries |
| Hindustan Unilever | Consumer staples | Asset-light brands and strong operating cash generation | Lease liabilities, supplier financing and post-demerger balances |
| ITC | Consumer and hotels | Diversified cash-generating operations and historically strong liquidity | Hotel demerger effects, leases and contingent liabilities |
| IRCTC | Rail services and tourism | Advance-funded business characteristics and historically low conventional leverage | Government policy, customer advances and lease commitments |
| CDSL | Market infrastructure | Capital-light platform economics and substantial liquid resources | Regulatory capital, investments and subsidiary liabilities |
These examples illustrate a method rather than declare the best debt free stocks in India for every investor. A stocks research screen can identify candidates, but the latest audited notes determine whether the label is still accurate.
Debt-Free Companies Across Large-, Mid- and Small-Cap Segments
Large-cap candidates often have established franchises, high operating cash flow and easier access to capital if needed. TCS, Infosys and mature consumer companies can hold net cash while funding normal operations internally. Their main risk may be valuation or slowing growth rather than solvency.
Mid-cap debt free companies in India can offer faster growth, but their cash flows may be more concentrated by client, product or regulation. Market-infrastructure companies, specialised manufacturers and niche consumer businesses frequently appear in screens. Investors should test whether recent growth came from a temporary cycle or durable competitive advantage.
Small-cap zero debt companies in India need the most scrutiny. A zero borrowing figure can coexist with weak liquidity, receivable stress, customer concentration or poor governance. Thin trading volumes also make entry and exit difficult. Market capitalisation changes with price, so segment labels need a stated date and source.
The comparison should be made within industries. Software exporters can scale without factories, while manufacturers may need debt for plants and inventory. A retailer with supplier credit and store leases may look unleveraged in a simple database even though fixed payments are meaningful. When comparing debt free companies in India, normalise for business model, capital intensity and accounting classification. Also examine whether cash is held in unrestricted bank accounts or trapped in subsidiaries. The strongest debt free companies in India typically combine accessible liquidity with recurring operating cash flow, rather than relying on a one-time asset sale or unusually low working capital at year-end.
Screening Method: Borrowings, Leases and Reporting Period
Start with the consolidated balance sheet, not a website label. Search the notes for current and non-current borrowings, debt securities, commercial paper, inter-corporate deposits and bank facilities. Then review lease liabilities, other financial liabilities, guarantees, letters of credit and commitments.
Reporting period matters. Annual statements are audited but can be months old; quarterly results are newer but less detailed. A reliable debt free companies list should record the statement date and refresh after every result. It should also adjust for mergers, demergers and subsidiaries acquired after year-end.
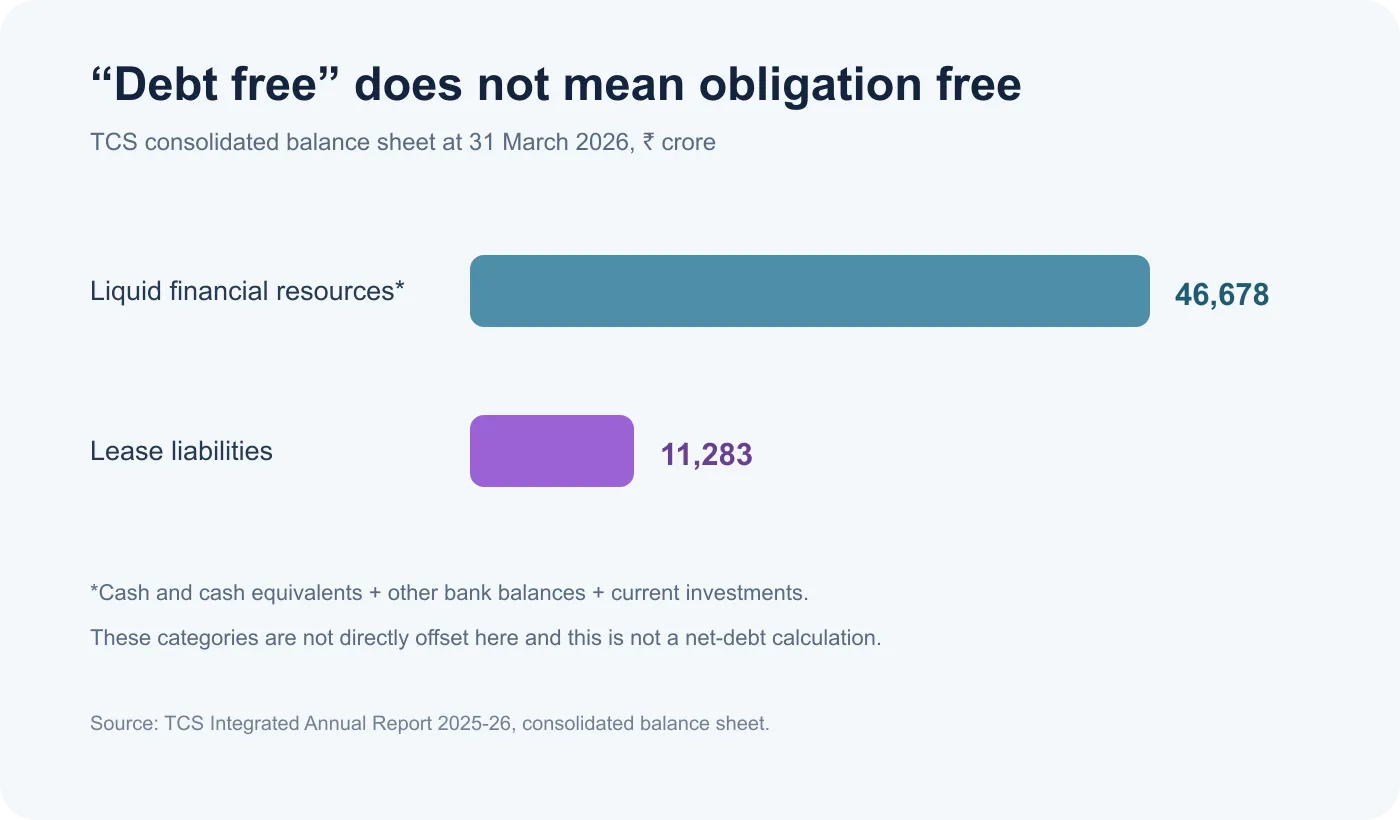
TCS demonstrates why definitions matter. At 31 March 2026, its consolidated balance sheet showed ₹6,417 crore of cash, ₹6,491 crore of other bank balances and ₹33,770 crore of current investments. It also showed ₹11,283 crore of current and non-current lease liabilities. Calling it simply “debt free” hides a material contractual obligation even though no conventional borrowing line appeared.
Why Companies Choose to Operate With Little Debt
Asset-light businesses may not need debt because customer receipts and retained earnings fund working capital and investment. A net-cash position also provides flexibility for acquisitions, buybacks, dividends and downturns. Management can act without negotiating waivers or refinancing during stressed markets.
For cyclical firms, low leverage can protect capacity and employment when prices fall. For technology and consumer franchises, it can reflect high returns on capital and modest physical investment requirements. These are valid reasons why debt free stocks in India attract conservative investors.
However, borrowing is not inherently bad. Sensible debt can lower the cost of capital, match long-lived assets with long-term funding and avoid diluting shareholders. The question is whether cash flows comfortably service obligations under a realistic downside scenario.
Get research like this in your inbox
The week’s research that mattered, in five minutes. Joined by 2L+ investors.
Beyond Debt-to-Equity: Profitability, Cash Flow and Returns on Capital
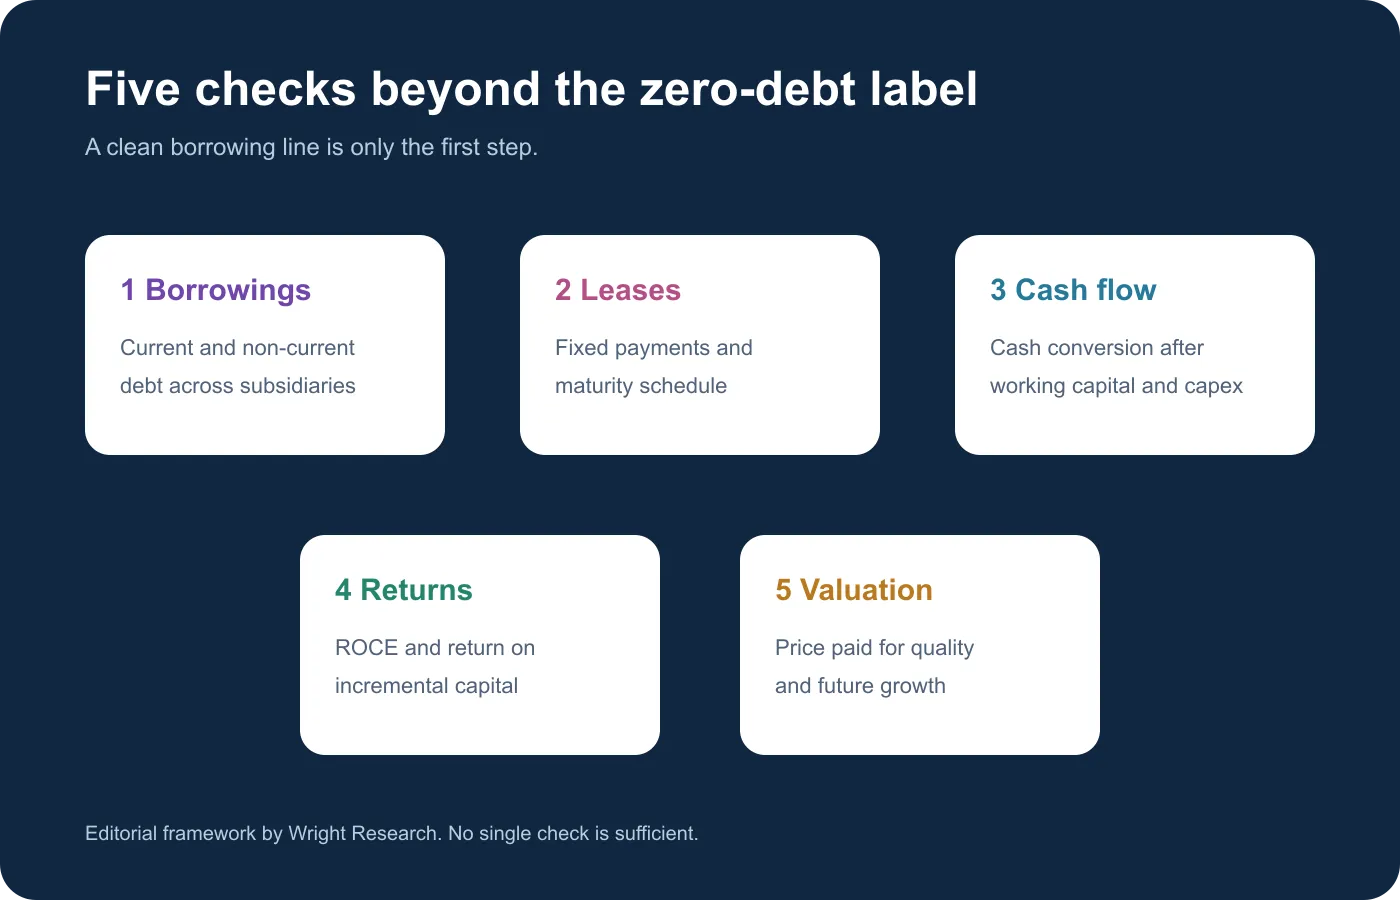
Debt-to-equity is only the first filter. Review operating margin stability, return on capital employed, free-cash-flow conversion and working-capital intensity. A business with no debt but chronically negative free cash flow may eventually need external capital.
Also calculate return on incremental capital. Some zero debt stocks retain large cash balances that earn low returns because management lacks productive reinvestment opportunities. In that case, a clean balance sheet can coexist with mediocre shareholder value creation.
Use cash from operations minus maintenance and growth capital expenditure as a starting point, then inspect one-off movements in receivables, payables and advances. Compare free cash flow with dividends, buybacks and acquisitions. Wright Research’s fundamental-analysis guide explains how these measures fit into broader company research.
When Zero Debt May Be a Warning Rather Than a Strength
A company may avoid debt because lenders view its business as risky, collateral is weak or governance is poor. Management may also underinvest in capacity, technology or distribution to preserve a clean ratio. Low leverage is not valuable if competitors are taking profitable opportunities that the company cannot fund.
Excess cash can attract inefficient acquisitions or related-party transactions. Investors should ask why the cash exists, where it is held, whether it is freely available to the parent and how management has allocated capital historically.
The debt free companies list can also contain firms with shrinking businesses. Falling sales reduce working-capital needs and temporarily increase cash, creating the appearance of strength. Sustainable revenue, pricing power and reinvestment runway matter more than the badge alone.
How to Verify Borrowings in Annual Reports and Results
Download both consolidated and standalone statements. The consolidated view captures subsidiaries; the standalone view helps identify parent-company guarantees and inter-company balances. Read accounting policies and the maturity analysis of financial liabilities.
Search for “borrowings,” “lease liabilities,” “default,” “covenant,” “guarantee,” “charge,” “contingent liability” and “commitment.” Reconcile totals with the cash-flow statement, where proceeds and repayment of borrowings reveal activity that a year-end snapshot can miss. The guide on how to read an annual report provides a practical sequence.
Check exchange filings after the reporting date for acquisitions, fundraising and credit-rating actions. For zero debt companies in India, document whether the conclusion applies to conventional borrowings only or to all debt-like obligations.
How to Build a Debt-Free Stock Watchlist
Create columns for reporting date, consolidated borrowings, cash and investments, lease liabilities, net cash, free cash flow, return on capital, promoter pledge and valuation. Add a source link for every figure. This makes the watchlist auditable and prevents an old number from being presented as current.
Apply quality and valuation filters after the balance-sheet test. A diversified portfolio framework can stop a screen from becoming concentrated in expensive IT or consumer names. Define position limits and review triggers before buying.
Finally, update the debt free companies list after each quarterly result and annual report. The best debt free stocks in India are not those with the cleanest ratio in isolation, but businesses that combine financial resilience, durable economics, responsible capital allocation and a reasonable purchase price.
Is your portfolio built for what’s coming?
Get a free AI-powered review of your holdings — risk, overlap and quality in minutes.
FAQ
Can banks and NBFCs be fairly compared with debt-free non-financial companies?
No. Borrowing and deposits are core operating inputs for lenders. They should be assessed using capital adequacy, asset quality, liquidity and funding metrics rather than a conventional zero-debt screen.
Can a debt-free company still have a weak cash position?
Yes. It may have little cash, high receivables, large supplier obligations or commitments not classified as borrowings. Liquidity and cash conversion must be reviewed separately.
Are debt-free stocks automatically less volatile than companies that use leverage?
No. Share-price volatility also depends on valuation, earnings cyclicality, liquidity, regulation and investor expectations. A debt-free balance sheet can reduce financial risk without eliminating market risk.
How often should a debt-free stock list be updated after quarterly results?
Review it after every quarterly result and immediately after acquisitions, capital expenditure announcements or fundraising. Perform a deeper reconciliation when the audited annual report becomes available.
The central lesson is simple: debt free stocks in India deserve attention, but “zero debt” is a starting filter. The strongest candidates combine transparent accounts, cash generation, reinvestment discipline and sensible valuation.
For education only, not investment advice. Financial positions can change after the reporting date. Consult a SEBI-registered adviser where appropriate.