


Mutual-fund costs often appear as one percentage, but the 2026 disclosure framework draws a clearer line between the base cost of running a scheme and the final amount charged to its assets. Investors need both numbers to compare plans fairly.
The base expense ratio covers permitted management and recurring scheme costs. The total expense ratio adds specified trading costs and statutory levies. Neither arrives as a separate invoice: both are reflected through the scheme’s daily NAV.
Base Expense Ratio vs Total Expense Ratio
The simplest comparison is an equation. Under the SEBI Mutual Funds Regulations, 2026, TER in mutual funds equals the base ratio plus permitted brokerage cost, transaction cost incurred for executing trades and statutory levies, including applicable GST.
This makes the base expense ratio a component of the final figure rather than a competing fee. If a factsheet displays both, investors should not add the base number to the total again. The total already incorporates the base and the other disclosed components.
Both are annualised percentages of scheme assets. Actual deductions occur through the NAV calculation, generally over time, so the investor does not see a debit entry labelled “expense ratio.”
Run the numbers on your next investment
Project returns on a lumpsum or SIP with our free calculators.
What Is Base Expense Ratio?
The base expense ratio is the permitted annual cost of investment management, advisory services and recurring scheme operations. The regulatory definition also covers distribution-related charges or commission to the extent permitted for regular plans.
Common operating heads can include trustee and audit fees, custodian and registrar expenses, investor communication, statutory advertising, marketing and the required investor-education allocation. Expense heads operate within the applicable regulatory limit rather than as unlimited individual add-ons.
Direct plans must have a lower base expense ratio because no distribution expense or commission is paid from them. Direct and regular plans hold the same underlying portfolio and have the same fund manager, but their costs and NAVs differ.
What Is Total Expense Ratio?
The total expense ratio is the fuller annualised measure of what is charged to scheme assets. Under the current framework, it combines BER, permitted brokerage, transaction costs and statutory levies.
This definition explains why TER in mutual funds may vary from month to month. Trading activity changes brokerage and transaction costs, applicable levies can change, and an AMC can revise the base component within regulatory limits and disclosure requirements.
AMCs disclose current expenses on their websites, while AMFI provides a central TER reporting page. Use the latest plan-level disclosure instead of relying on an old article, an NFO ceiling or the ratio shown when the investment was first made.
What Costs Make Up a Fund's TER?
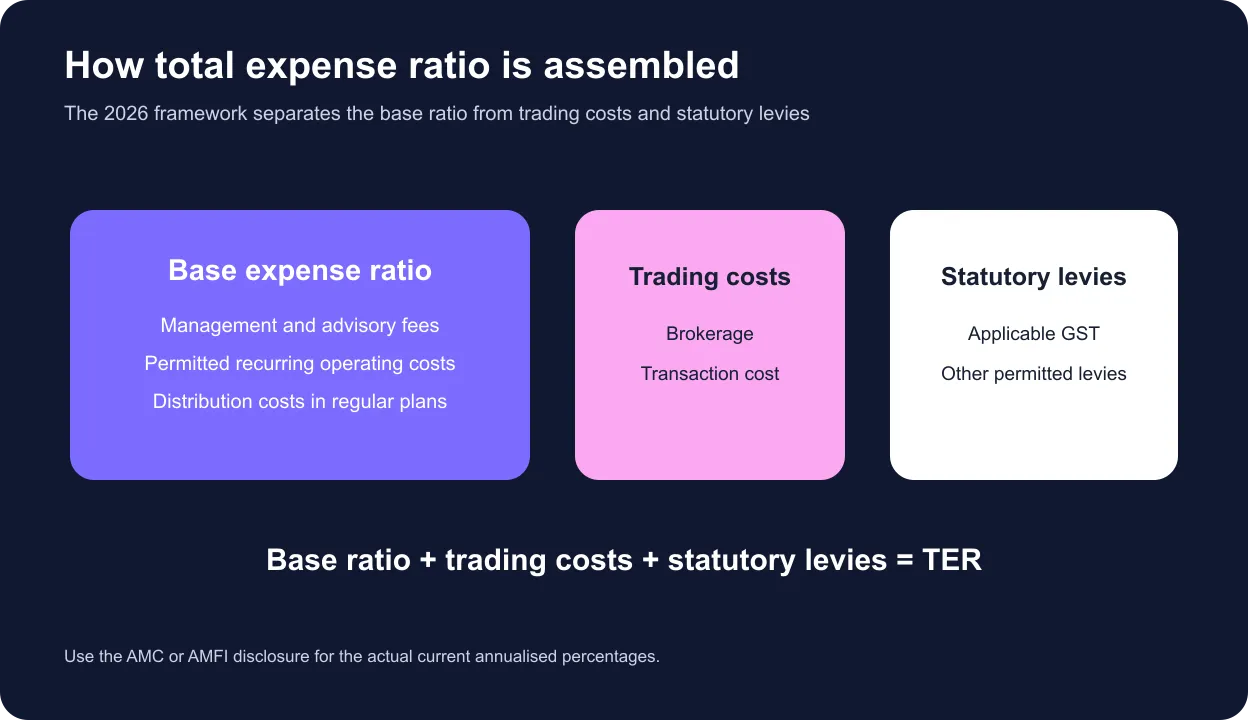
The base bucket contains the scheme’s permitted fund management charges and operating expenses. A regular plan may also bear permitted distribution costs, while a direct plan excludes distributor commission.
Separate disclosed components cover brokerage and transaction cost incurred to execute trades. Statutory levies can include applicable GST and charges connected with trade execution. The precise expense ratio calculation therefore uses the scheme’s actual annualised components for the relevant disclosure period.
Exit load is different. It may apply when units are redeemed within a stated period and is transaction-specific, whereas recurring expenses are continuously reflected in NAV. Taxes payable by an investor are also separate from the scheme’s operating ratio.
Get research like this in your inbox
The week’s research that mattered, in five minutes. Joined by 2L+ investors.
Base TER vs Total TER: Side-by-Side
| Feature | Base expense ratio | Total expense ratio |
|---|---|---|
| Scope | Management, advisory and permitted recurring expenses | Base ratio plus brokerage, transaction cost and statutory levies |
| Direct vs regular | Direct must be lower because distribution commission is excluded | Also differs because the base component differs |
| Presentation | Annualised percentage of daily net assets | Annualised aggregate percentage |
| Investor use | Understand core operating cost | Compare the fuller current cost burden |
A valid comparison matches the same scheme category, option, period and plan type. Comparing the base expense ratio of one fund with the total expense ratio of another mixes unlike measures.
For fund selection, the mutual fund expense ratio that matters most is the actual current cost associated with the exact plan an investor will own, not merely the maximum permitted ceiling in the scheme document.
How Expense Ratio Reduces Investor Returns
Fund expenses are accrued in the scheme and reduce NAV. If a portfolio earns 10% before expenses and the all-in cost were 1%, the simplified net result before investor tax would be about 9%. Actual daily calculations and portfolio returns are more granular, but the direction is the same.
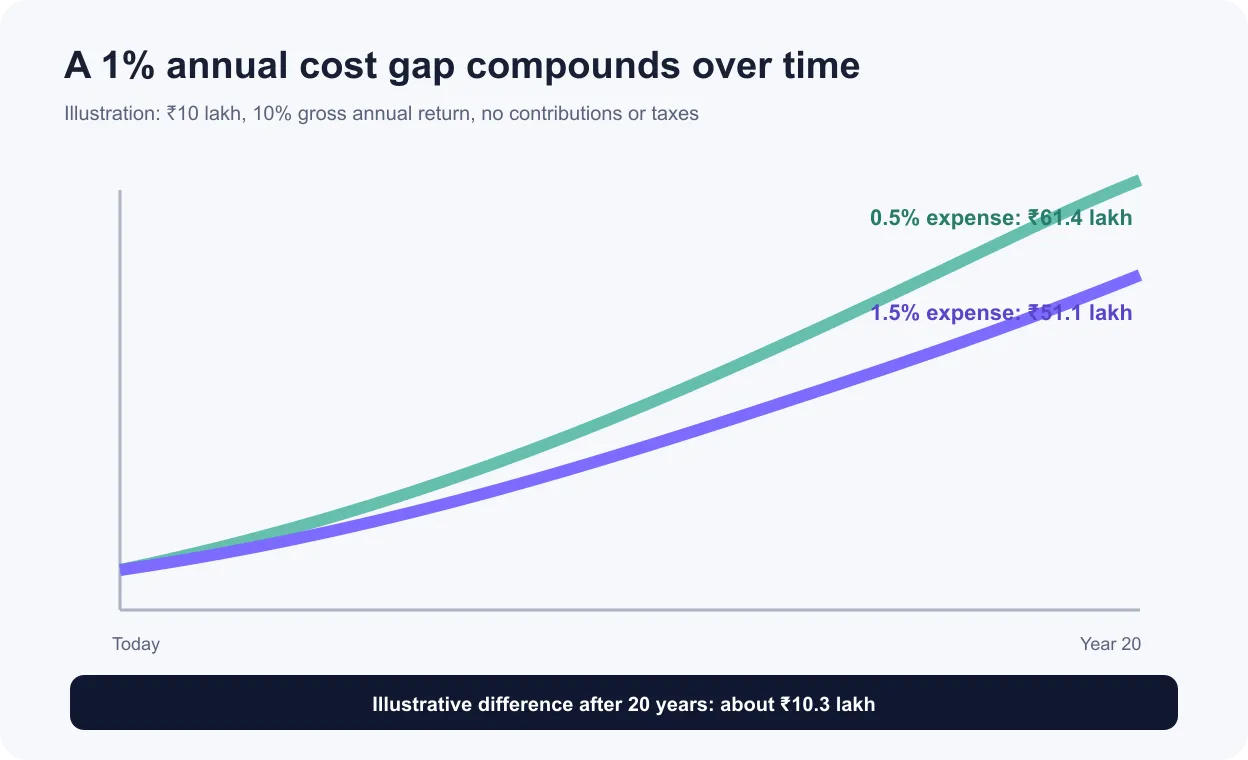
For example, ₹10 lakh compounding for 20 years at a constant 10% gross return grows to about ₹61.4 lakh after a 0.5% annual expense and ₹51.1 lakh after a 1.5% expense. The illustrative gap is roughly ₹10.3 lakh.
This expense ratio calculation isolates costs only. It ignores tax, cash flows, tracking difference and changing returns. Still, it shows why an apparently small mutual fund expense ratio difference deserves attention over long horizons.
Direct vs Regular Plans and Expense Ratio
Direct and regular plans belong to the same scheme and share a portfolio, strategy and fund manager. Their main structural cost difference is distribution. A regular plan pays permitted distributor expenses from scheme assets; a direct plan does not.
Consequently, the direct plan has a lower base expense ratio and generally a lower total expense ratio. Over time, that cost gap produces different NAVs and returns even though the underlying securities are common.
The regular-plan cost may accompany advice or service from a distributor, but investors should understand what is being received. Those who use a fee-based adviser or can transact independently should avoid paying twice for overlapping support.
How Investors Should Compare TER
Begin with the same category and plan type. Compare the latest TER in mutual funds from AMFI or the AMC, then review how it changed over several periods. A temporary trading-cost movement should not be mistaken for a permanent base-cost difference.
Next, evaluate value rather than cost alone. For passive funds, tracking difference, tracking error and liquidity are crucial beside the mutual fund expense ratio. For active funds, assess mandate, risk, portfolio construction and performance consistency after expenses.
Do not assume the cheapest scheme is automatically best. A lower total expense ratio helps when all else is equal, but poor tracking, unsuitable risk or weak execution can overwhelm a small fee advantage.
Use an identical investment amount and realistic holding period for your own expense ratio calculation. Investors comparing current choices can review mutual fund options while keeping cost, suitability and risk in the same decision.
Keep a dated record of the total expense ratio because current disclosures can change. Compare that total expense ratio with the latest TER in mutual funds for the same plan. A complete review places the mutual fund expense ratio beside performance, risk and service received; it also checks whether fund management charges and the resulting mutual fund expense ratio remain competitive.
See what markets are pricing in
Live indices, sector moves and market breadth — the backdrop to every story we publish.
FAQ
What is base expense ratio?
It is the annualised percentage of scheme assets used for permitted management, advisory and recurring operating expenses. Under the 2026 framework, applicable trading costs and statutory levies sit outside this base measure.
What is Total Expense Ratio in mutual funds?
It is the annualised aggregate charged to scheme assets: the base ratio plus permitted brokerage cost, transaction cost and statutory levies. It is reflected in NAV rather than billed separately to the investor.
What is the difference between base TER and TER?
Base TER covers the permitted base expense heads. TER adds the other permitted components, so the disclosed total can be higher than the base number.
Which expenses are included in TER?
The total can include management and advisory fees, recurring scheme expenses, permitted distribution expenses, brokerage, transaction costs and applicable statutory levies, subject to regulation and plan type.
Does a lower expense ratio always mean a better fund?
No. Lower cost improves the return retained when everything else is equal, but suitability, strategy, risk, tracking quality, portfolio construction and consistency also matter.
How does expense ratio affect long-term returns?
Expenses are deducted from scheme assets and reduce NAV growth. Even a modest annual difference can compound into a meaningful gap over long holding periods.


