


India's stock market has lagged the global AI trade through 2026. Foreign investors have withdrawn about US$25 billion from Indian equities this year and the Nifty 50 is down 12%, while chip-heavy markets such as South Korea and Taiwan have led global returns. The common explanation is that India has little to sell into the AI build-out.
The first, on Indian equities, identifies 42 listed companies that already earn revenue from AI infrastructure and have risen about 60% this year. The second, on global labour markets, finds that AI's effect on hiring is real and narrow, falling mainly on junior workers and a small set of service industries. AI in 2026 is primarily a capital spending story. India sits on both sides of it: it supplies part of the physical build-out, and it exports many of the services that AI is beginning to automate.
Why do global investors treat India as an anti-AI market?
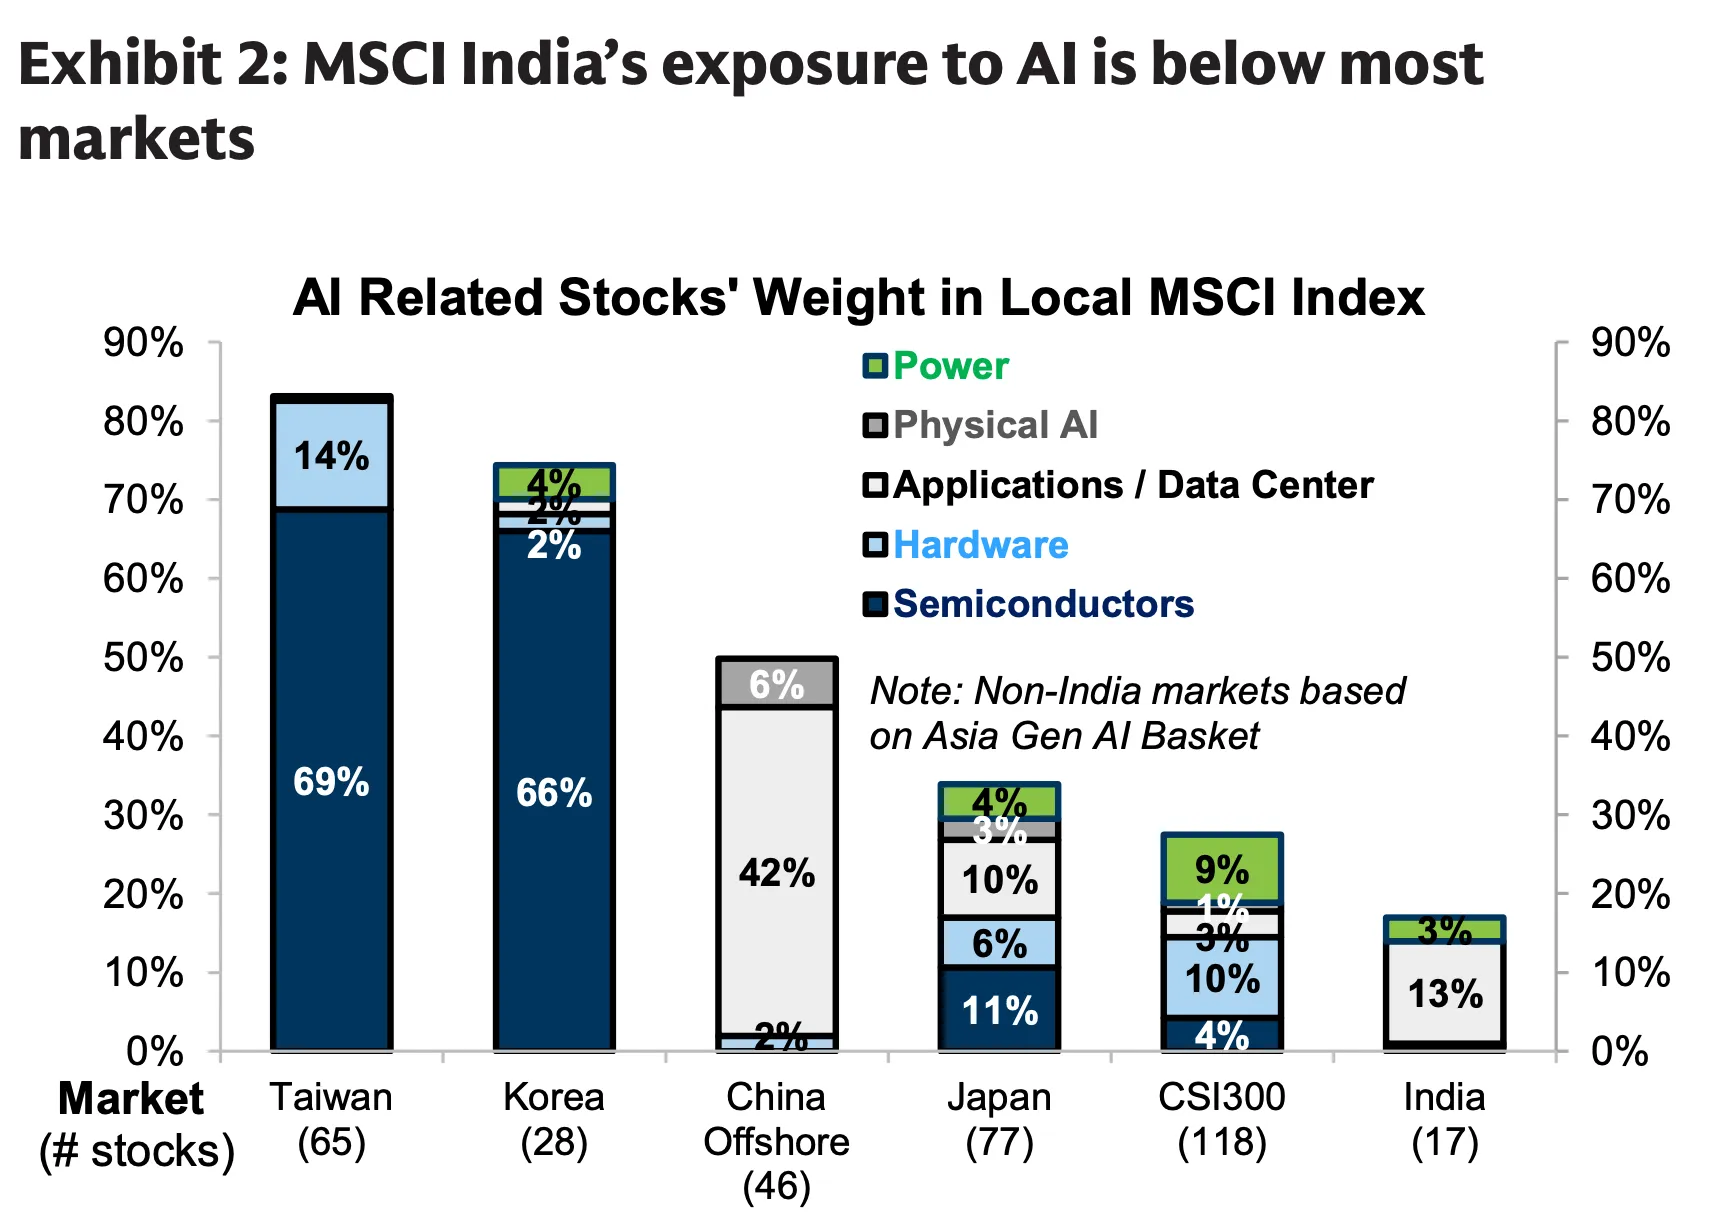
India's benchmark index holds very few companies that sell chips, memory or AI hardware. AI-related stocks account for about 16% of MSCI India's market value, compared with 70% to 80% in Korea and Taiwan and 30% to 50% in China and Japan. When global funds buy the AI theme, they buy those markets.
That trade is highly concentrated. About 72% of the MSCI Emerging Markets Index's gains this year came from three semiconductor companies: TSMC, Samsung Electronics and SK hynix. Foreign portfolio ownership of NSE-listed companies has fallen to a 17-year low as capital moved toward Taiwan and Korea.
Domestic investors have absorbed much of the selling. Local institutions bought a net ₹4.63 trillion of Indian equities in the first half of 2026, the highest for that period since 2017. That support has limited the fall in the index. It has left the way global allocators classify India unchanged.
Check the macro backdrop
GDP, inflation, rates and more — India’s key economic indicators in one dashboard.
Where is the world's AI money actually being spent?
Most of it is going into physical assets. AI-related investment will reach about US$1 trillion globally in 2026, including US$581 billion in the United States, taking cumulative AI investment since 2022 to around US$1.8 trillion. That money buys chips, memory, servers, buildings, cooling systems, transformers and electricity. The companies that supply these items book the revenue first.
Spending is running ahead of adoption
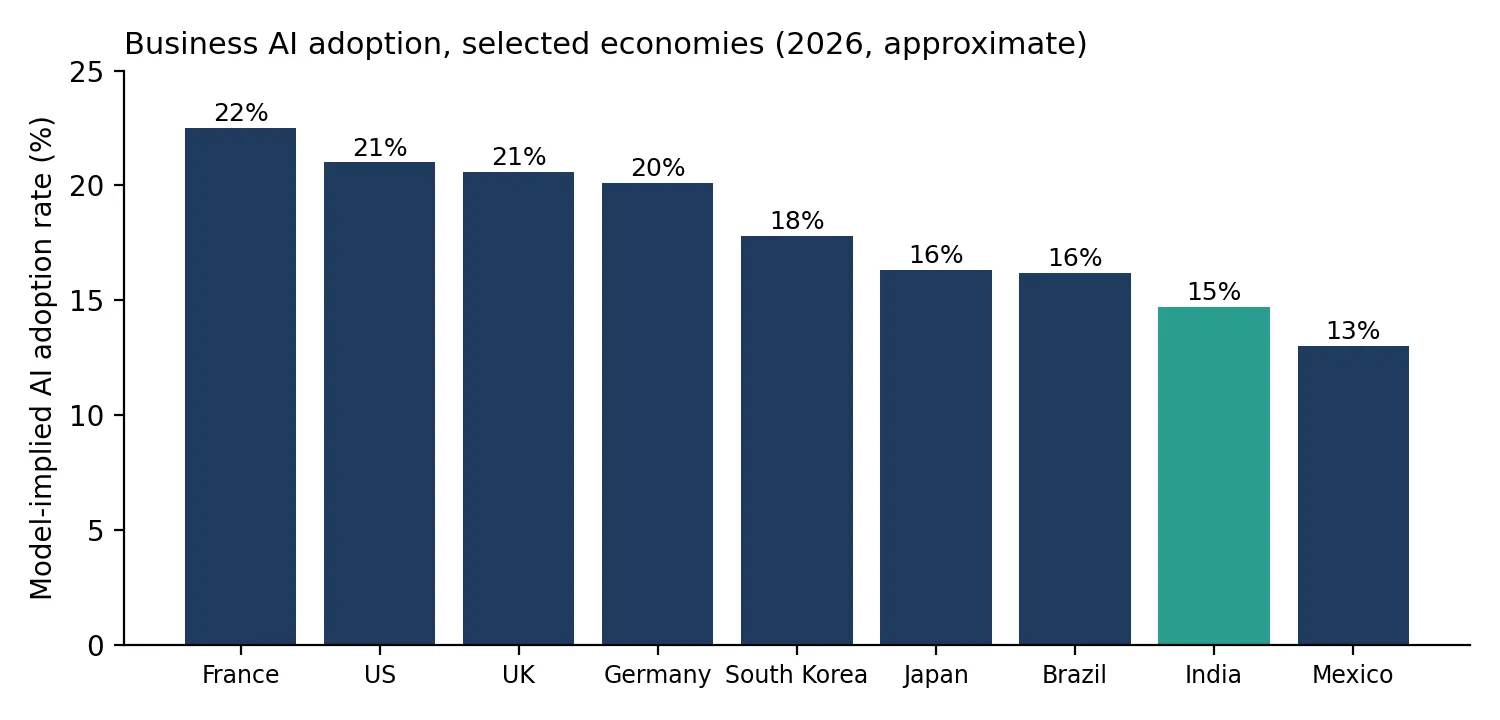
Businesses that use AI are moving more slowly than the companies building for it. Adoption rates of 15% to 20% across major developed economies, led by France, the US, the Netherlands and the UK, and 10% to 15% in major emerging markets. India sits near 15%. This gap explains the pattern of equity returns in 2026. Markets are paying the suppliers of capacity today, while productivity gains for users arrive later and are harder to measure.
Figure 1: AI adoption is still at an early stage, even in leading economies
Which Indian companies are capturing that spending?
A group of 42 companies that Goldman Sachs calls "AI Enablers". The firm screened about 1,800 listed Indian companies for size, liquidity, growth and capital intensity. It then used earnings call transcripts and news flow to keep only those with visible orders, capacity commitments or partnerships tied to AI infrastructure.
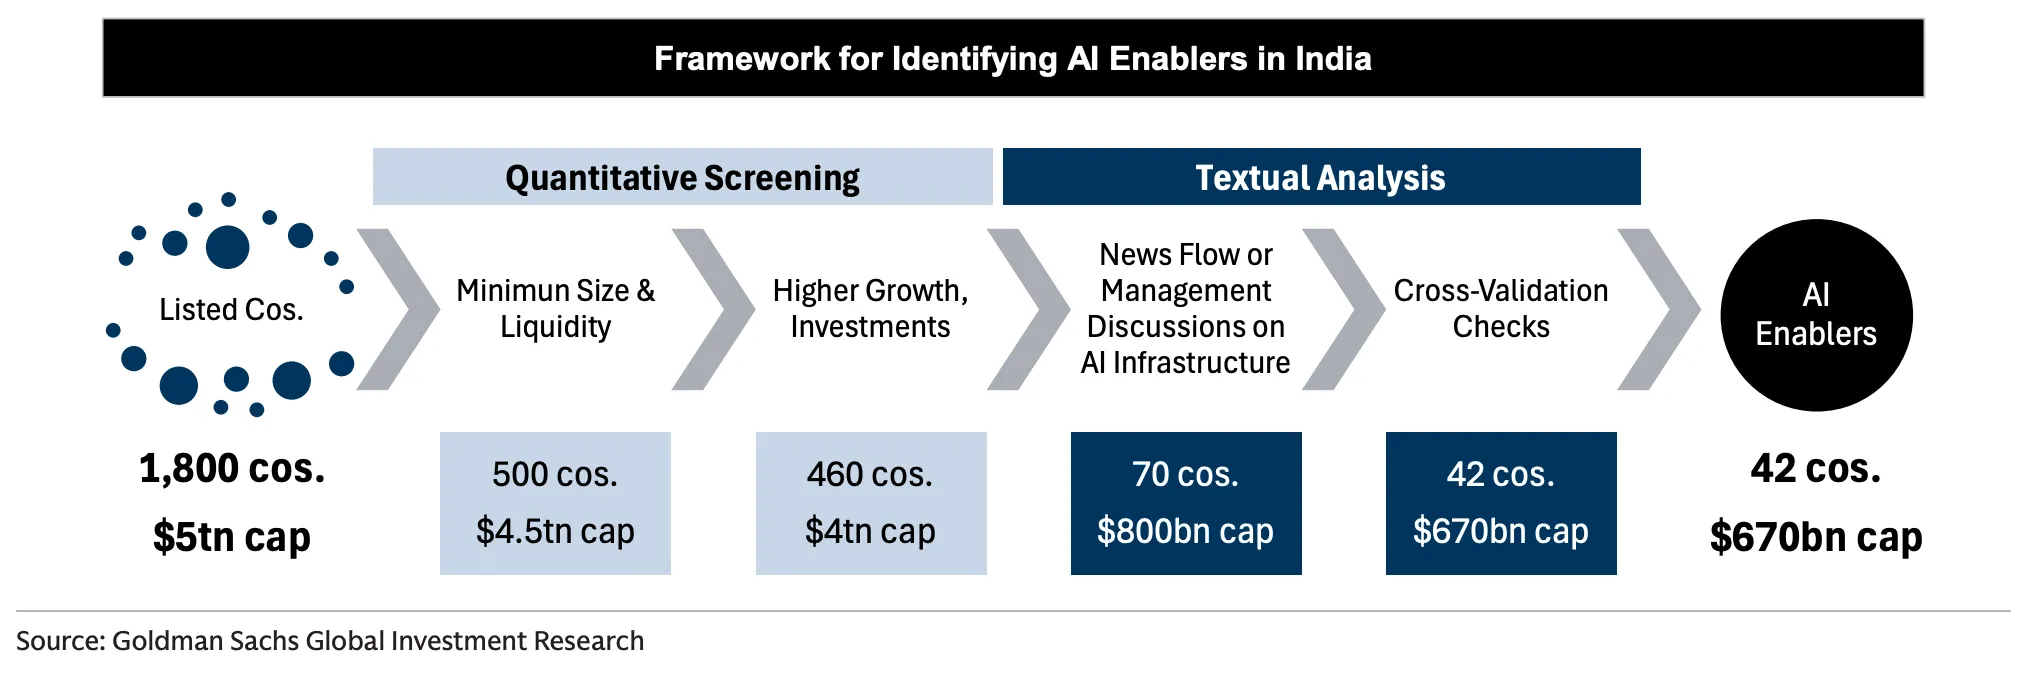
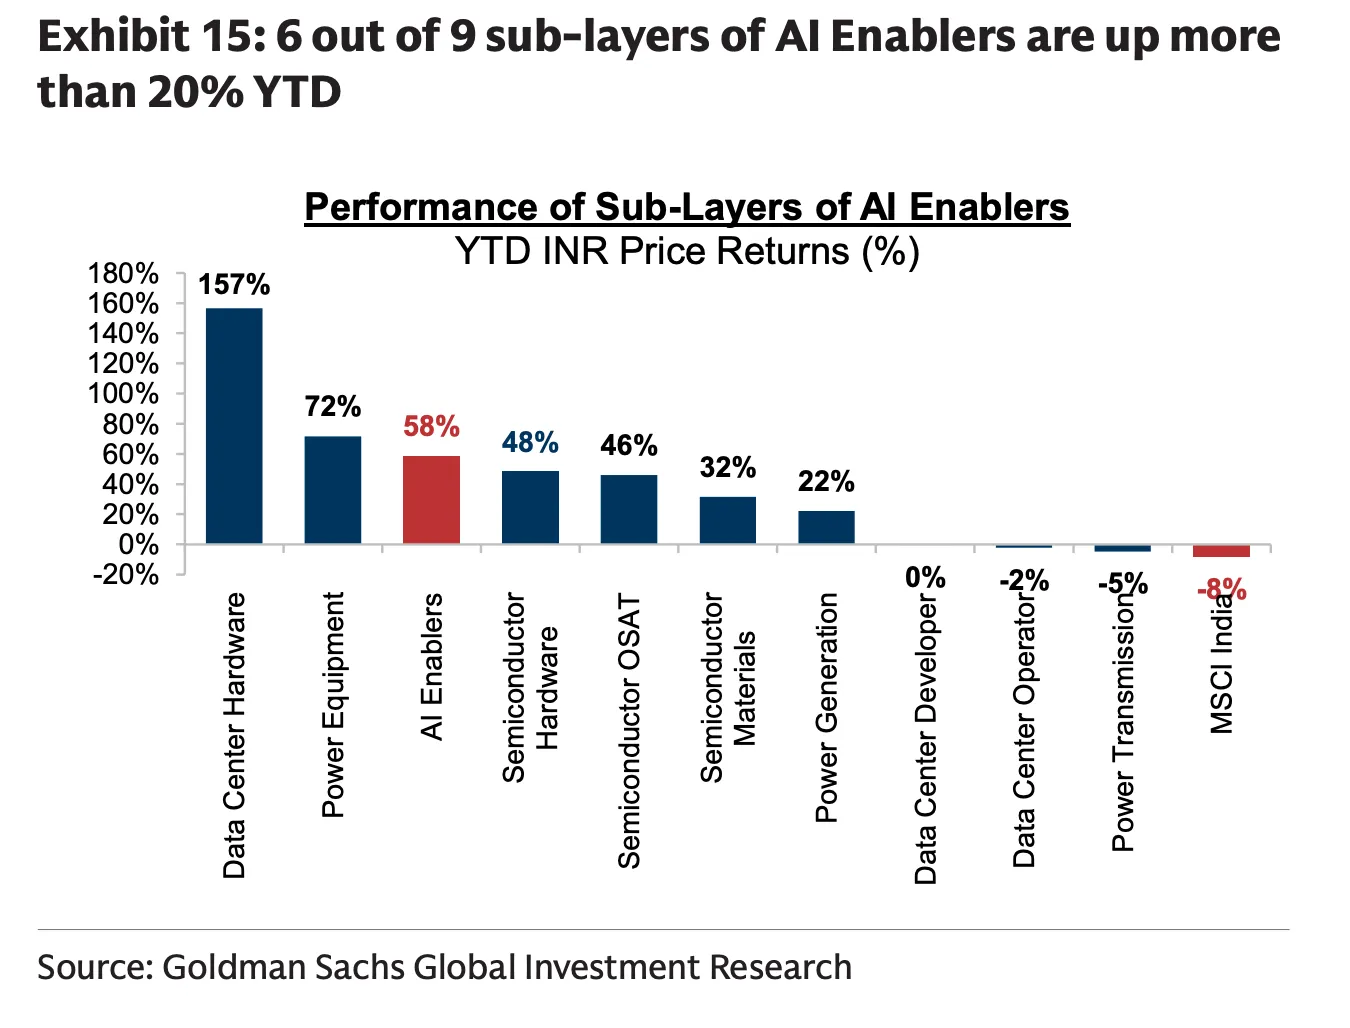
The resulting group has a combined market value of about US$670 billion across three layers: power, data centres and semiconductors.
Table 1: The structure of India's AI Enabler cohort
Layer | Sub-segments | Companies | Market value (US$bn) |
Power | Generation, transmission, equipment | 20 | About 187 |
Data centres | Operators, developers, hardware | 13 | About 438 |
Semiconductors | Assembly and test (OSAT), materials, hardware | 9 | About 46 |
Total | 42 | About 670 |
The data centre layer is the largest by value because it includes diversified groups such as Reliance Industries and Bharti Airtel, which are building AI-ready capacity. By count, the cohort is dominated by smaller firms. Thirty of the 42 are mid, small or micro caps, and half sit in capital goods, making transformers, switchgear, cables, engines and cooling equipment.
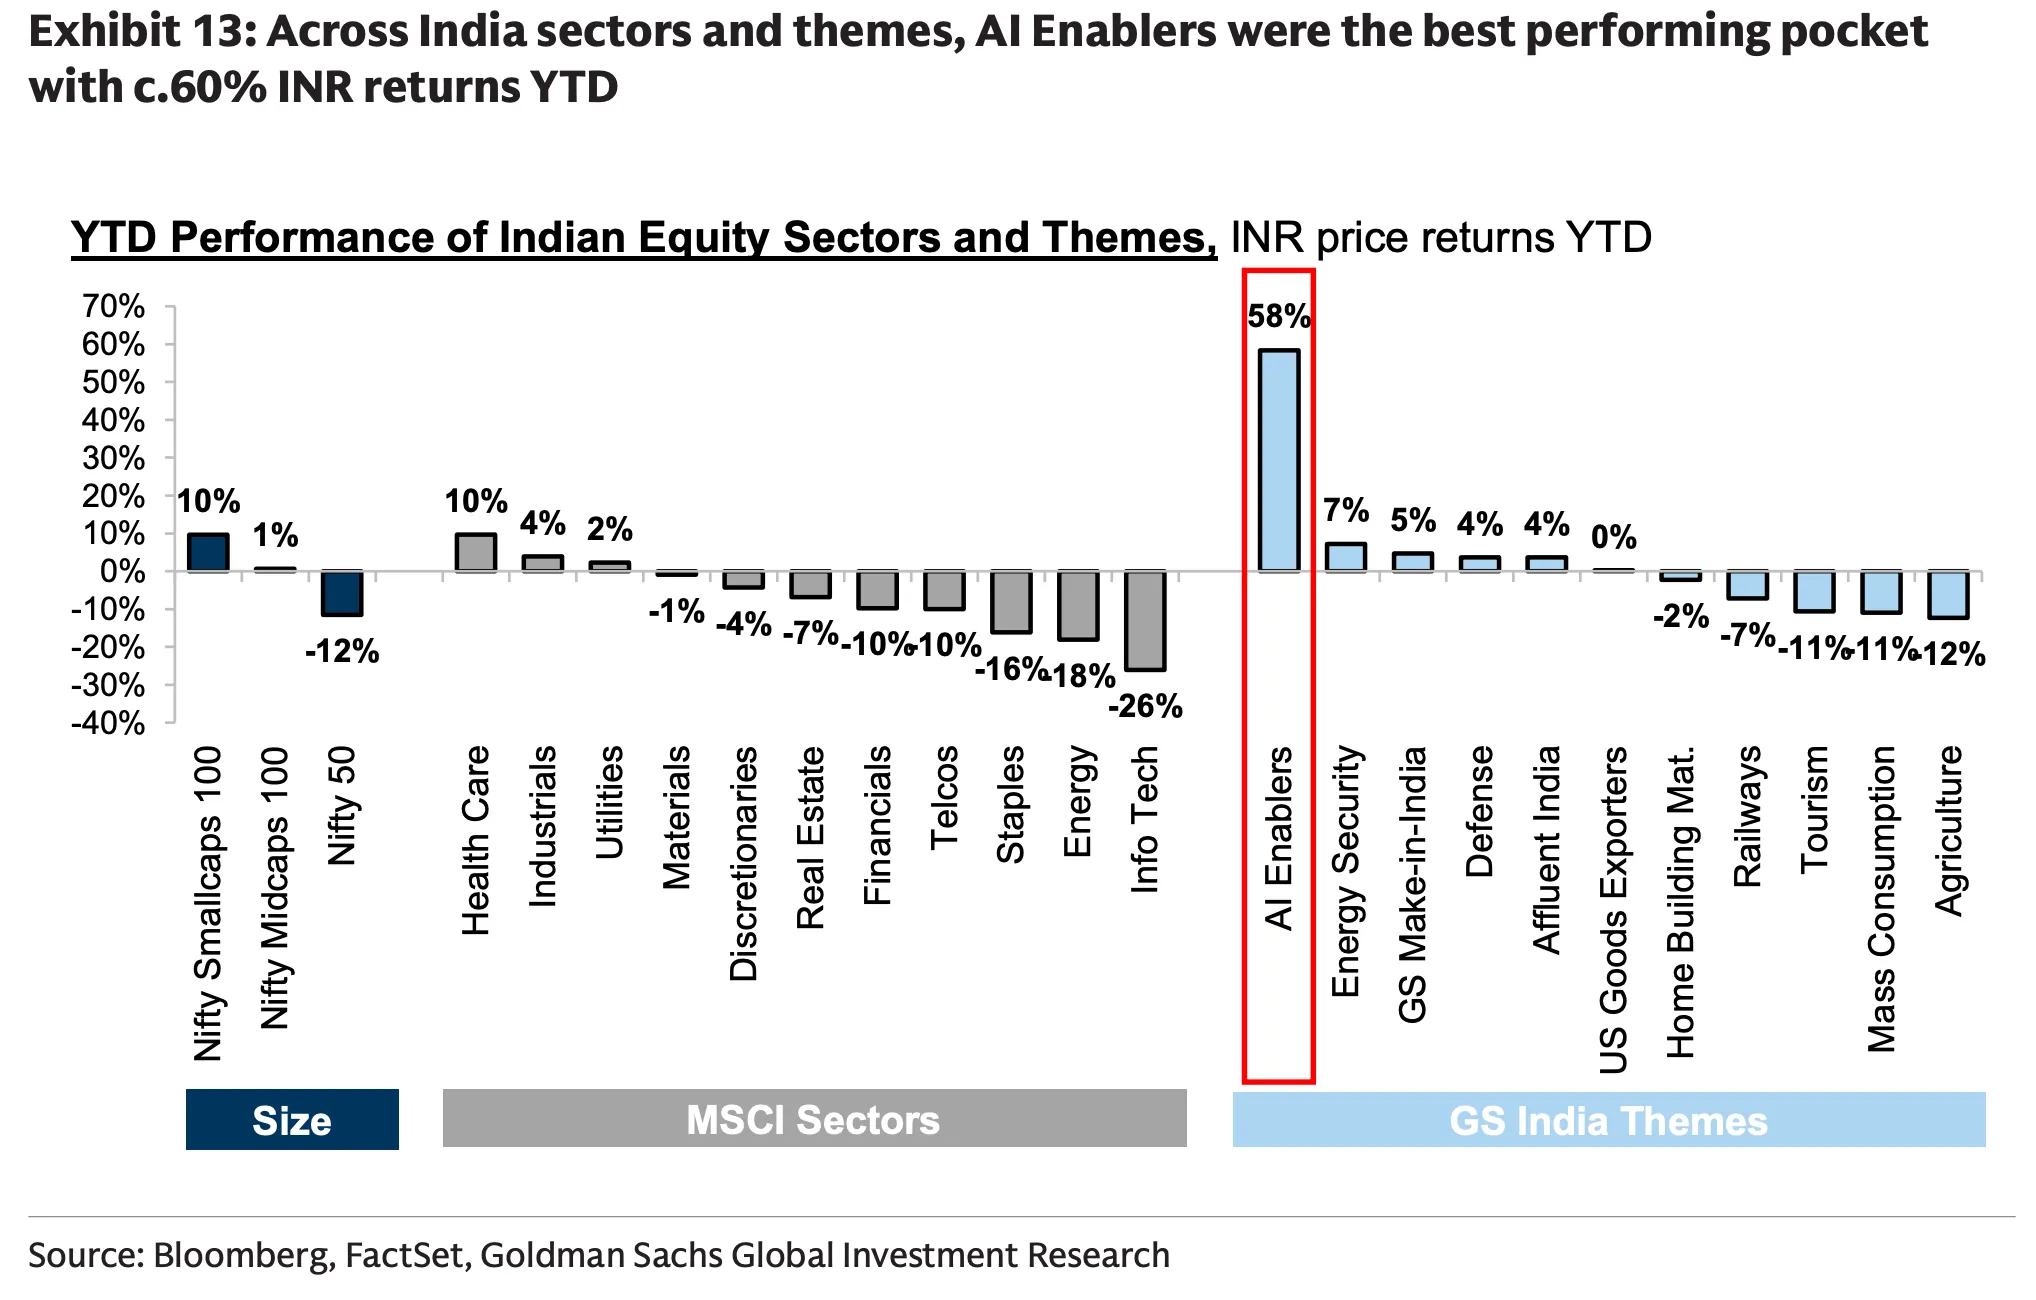
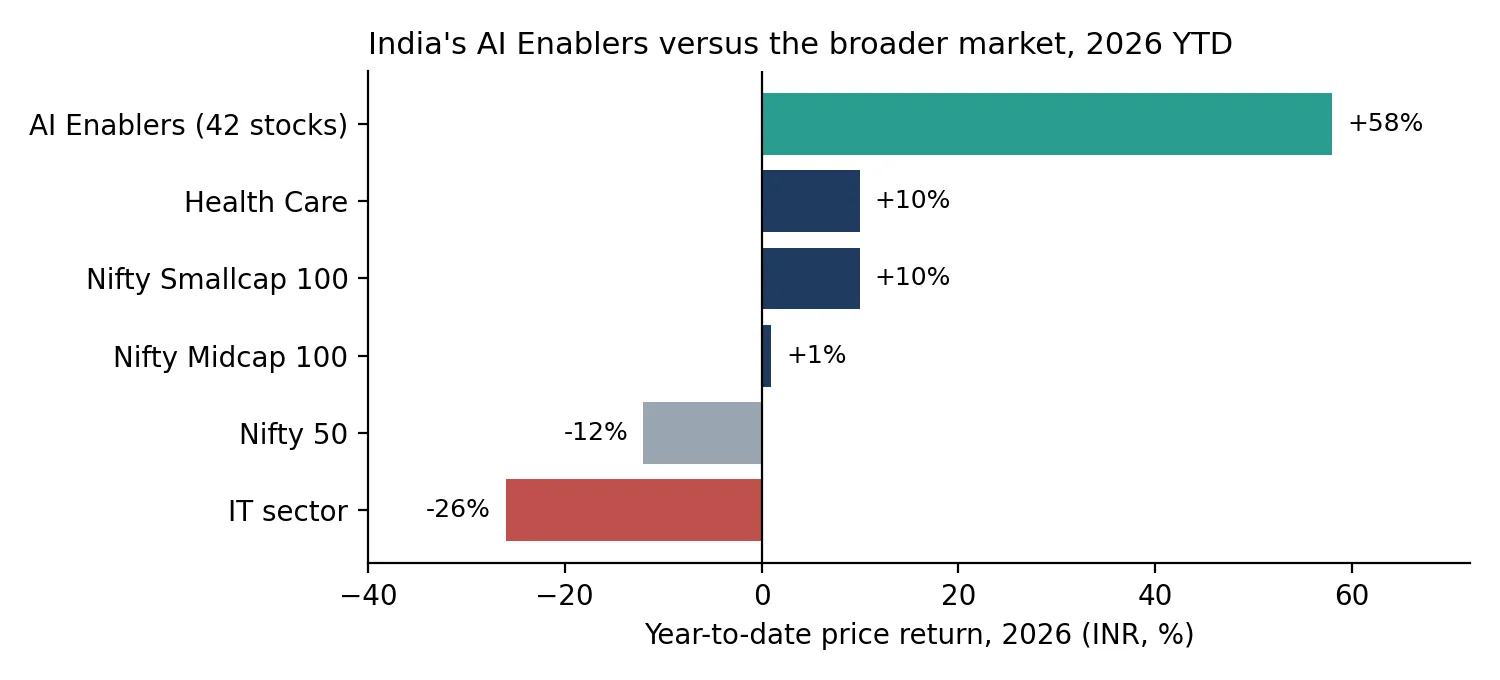
The group has risen about 60% in 2026 while the Nifty 50 fell 12%. Healthcare, the next strongest part of the market, gained about 10%.
Figure 2: AI Enablers have outperformed every major Indian index and sector in 2026
Earnings have driven the rally
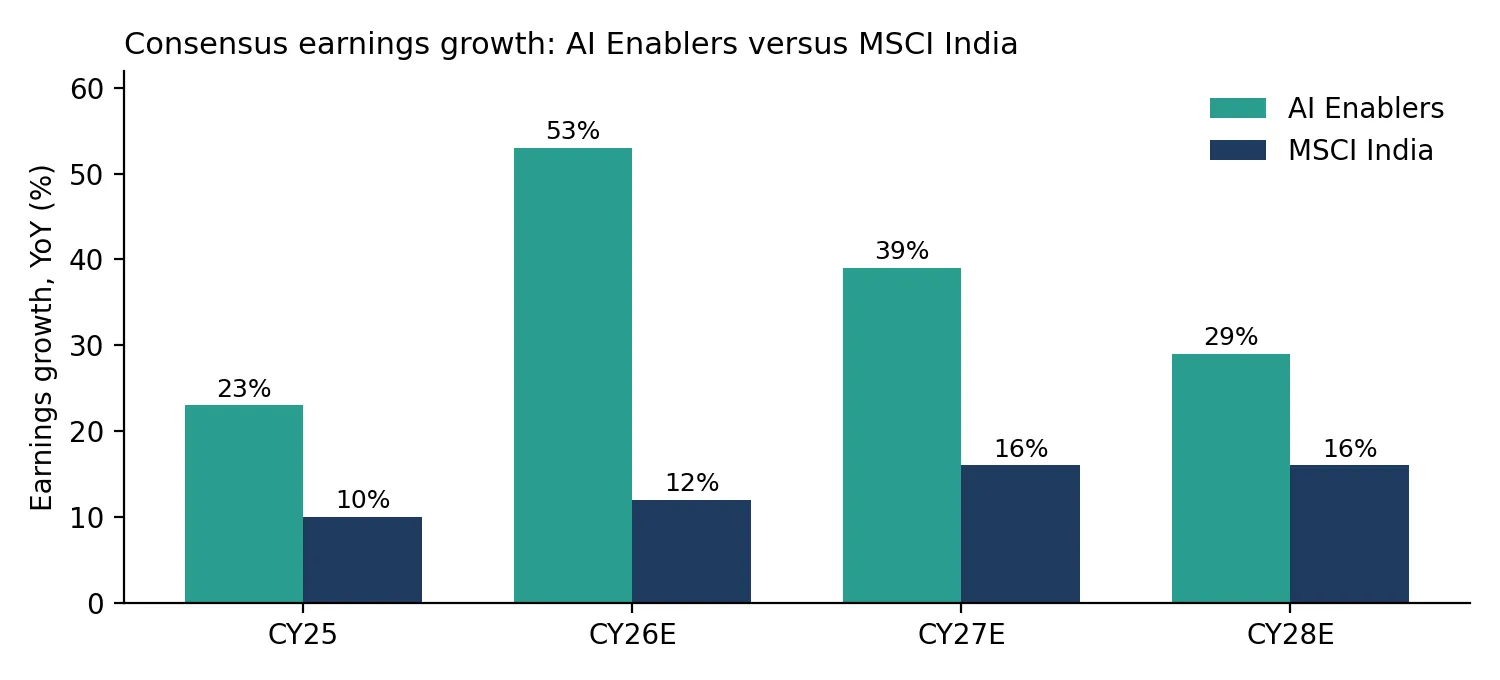
The gains have tracked profits. Since the start of 2025 the cohort has returned 53%. 65 percentage points of that to earnings growth and minus 12 points to lower valuation multiples, which means share prices rose by less than profits. Consensus expects the group's earnings to grow 53% in 2026 and 39% in 2027, compared with 12% and 16% for MSCI India. Analysts have raised 2027 earnings estimates for the cohort by 22% this year and cut them by 2% for the Nifty 500.
Figure 3: Consensus expects AI Enabler earnings to keep growing faster than the market
The benchmark hides them
Cap-weighted indices give small and mid-sized capital goods companies very little weight, so a foreign fund that owns India through large caps sees almost none of this group. The anti-AI label describes the composition of the index. India's corporate sector has a growing AI supply chain beneath it.
Is AI already replacing workers?
In a few industries, yes. Across whole economies, the effect is still small. Industries more exposed to AI automation have seen slower growth in job openings since the second half of 2022, with the strongest link in Germany, Australia and the US. Employment in call centres, software publishing, management consulting and advertising has dropped well below trend across developed economies. US call centre employment is now 39% below trend.
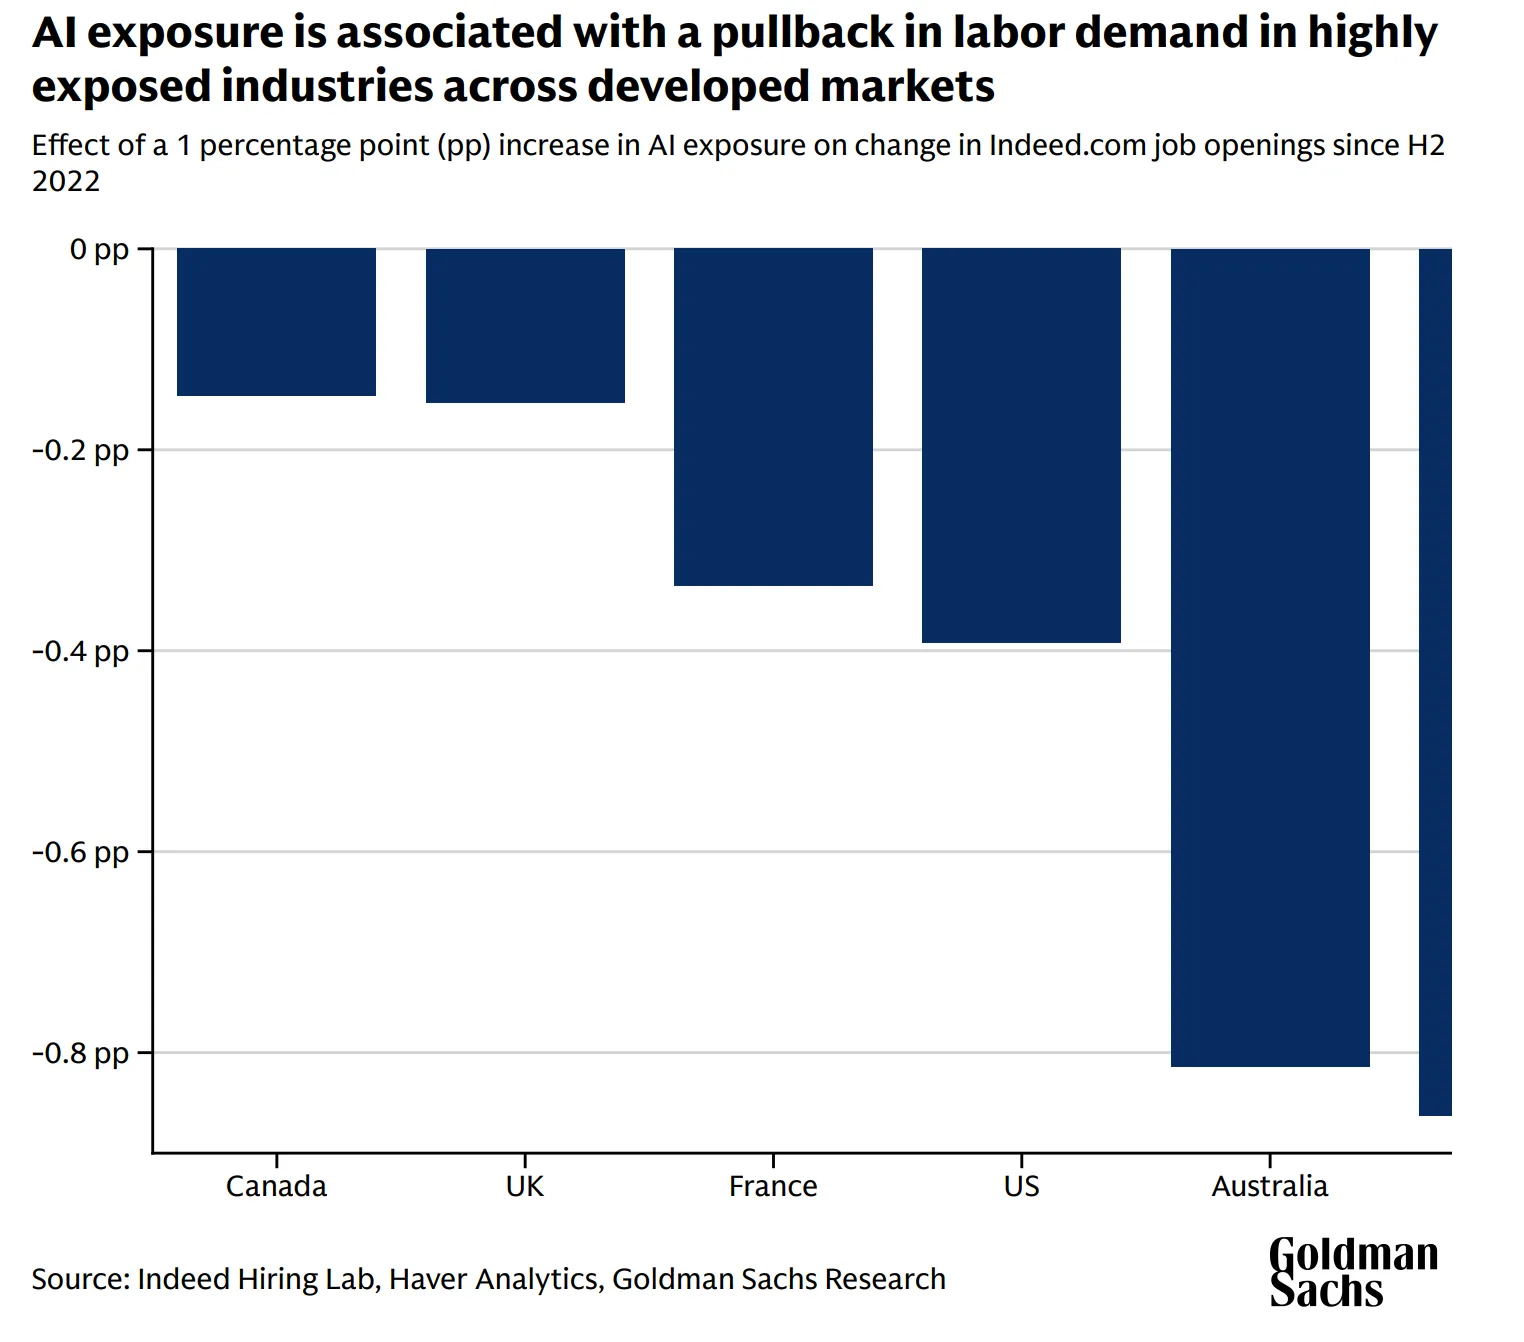
The economy-wide drag is limited. Across more than 800 occupations, a 10% occupational exposure to AI is associated with a 0.1 percentage point reduction in annual headcount growth in France, Canada and the US. The pressure is heavier for entry-level workers, whose tasks are easier to automate.
The affected industries are India's export industries
The sectors where AI is slowing hiring in the US and Europe are the sectors India sells to them: software services, call centres and business process work. India's exposure to AI-led job displacement therefore arrives mainly through its clients' budgets. When a US bank uses AI to resolve support tickets or write test code, it buys fewer offshore hours.
Get research like this in your inbox
The week’s research that mattered, in five minutes. Joined by 2L+ investors.
What does this mean for India's IT services industry?
It means slower growth in traditional revenue and a change in who gets hired. The Nifty IT index has fallen more than 20% in 2026 as investors priced in AI-led pricing pressure. AI could reduce revenue from traditional IT services by 2% to 3% a year over the next couple of years, in an industry worth about US$280 billion, while creating new AI-related work later in the decade.
Hiring data shows the shift. Naukri's JobSpeak index recorded 31% annual growth in AI and machine learning postings in August 2026, while overall hiring growth was led by non-IT sectors such as insurance, healthcare and retail. The Indian IT model has depended on large annual intakes of graduates at the bottom of its workforce pyramid. Junior roles face the strongest AI headwinds is the part of the labour research most relevant to India, because entry-level work is where that intake is concentrated.
How is the AI build-out showing up in India's economy?
Mainly through investment. India's GDP grew 7.8% in April to June 2026, and gross fixed capital formation rose 11.9%, about double its pace a year earlier. AI infrastructure is one contributor. Consensus expects AI Enablers' capital expenditure to rise 65% in 2026, adding about 6 percentage points to Nifty 500 capex growth of 16%, led by power generation, transmission and data centre operators.
The data centre pipeline is the clearest example. India had about 1.64 GW of data centre capacity in mid-2026, and JLL expects this to reach 6 GW by 2029, requiring roughly US$110 billion of investment. Global hyperscalers have committed more than US$50 billion, including Google's US$15 billion AI campus in Visakhapatnam with AdaniConneX and Airtel's Nxtra. The Union Budget for 2026-27 gave foreign cloud providers a tax holiday running to 2047.
Two effects are moving in opposite directions
The capital spending side adds orders for Indian manufacturers, utilities and builders, much of it funded by foreign hyperscalers. The labour side weighs on services exports and urban white-collar hiring. For now, the investment effect is larger and more visible in the national accounts. The labour effect is slower and falls on a narrower group, and that group includes some of India's largest private employers of graduates.
Table 2: The four channels through which AI is reaching India
Channel | How AI reaches India | What the 2026 data shows | Main risk |
Investment | Hyperscalers and domestic groups build data centres, grid links and power plants | Fixed investment up 11.9% in Q1 FY27; data centre pipeline of about 6 GW by 2029 | A slowdown in global AI capex |
Equity market | Earnings accrue to power, equipment and data centre suppliers | AI Enablers up about 60% YTD while the Nifty 50 fell 12% | High valuations if growth disappoints |
Services exports | Clients abroad automate coding, testing and support work | Nifty IT down more than 20%; analysts expect 2% to 3% annual deflation in legacy revenue | Faster automation of outsourced work |
Employment | Hiring shifts toward AI skills and away from routine entry-level tasks | AI/ML job postings up 31% year on year in August | Weaker graduate intake in IT services |
What could go wrong with the AI infrastructure trade?
Three risks stand out: valuations, the global capex cycle and physical constraints.
Valuations assume growth arrives on schedule
AI Enablers trade at about 36 times forward earnings, roughly an 85% premium to MSCI India and near the top of their five-year range. Adjusted for growth, their PEG ratio of 1.3 times is slightly below the index's 1.4 times. That comparison holds only if forecast earnings are delivered. Revisions are already uneven: 2027 estimates for data centre developers and power generators have been cut by 14% to 15% this year.
Indian orders depend on global budgets
Demand for Indian transformers, cables and data centre space depends on global AI investment continuing to grow. Briggs describes the path of AI capex growth as a key source of uncertainty for markets. A cut in hyperscaler budgets would reach Indian order books within a few quarters. The same event would likely move foreign money back toward domestic-demand stocks and IT services, a rotation Motilal Oswal has flagged as a possible trigger for renewed inflows into India.
Power, water and cash flow set physical limits
Data centres need reliable power, land and water. Several power generation companies in the cohort are running deeply negative free cash flow as they build capacity, which leaves them dependent on debt and equity markets. Water availability is already a contested issue at the proposed gigawatt-scale site in Visakhapatnam.
See what markets are pricing in
Live indices, sector moves and market breadth — the backdrop to every story we publish.
What should investors and policymakers track next?
Indicators that measure delivery against announcements. The most useful ones are:
Data centre megawatts commissioned each half-year compared with megawatts announced.
Transmission lines and power purchase agreements signed for data centre loads.
Earnings revisions for the AI Enabler cohort relative to the Nifty 500.
Deal wins and pricing on legacy contract renewals at large IT services firms.
Graduate intake at IT employers and the share of new postings in AI roles.
Foreign portfolio flows into India if returns in Korea and Taiwan cool.
India has limited exposure to the chip layer of the AI boom and growing exposure to its power, equipment and data centre layers. Its largest AI risk sits in services employment, especially at the entry level. The next two years will show how much of the global build-out India can host and how quickly its services workforce moves toward the work AI creates.


