


The Indian stock market often witnesses a surge in December, with the Nifty index frequently delivering positive returns during this month. This phenomenon has led to a widely held perception among investors that December is one of the more favourable months for the Indian stock market. Let’s explore this in depth today and see what exactly is the December effect for Indian stock markets.
Historical Performance of Nifty & Indian Stock Markets in December
Data shows that since 2000, the Nifty index has exhibited a consistent upward trend in December, closing higher in 17 out of the past 24 years. This translates to a 71% probability of positive returns in December.
Years like 2023 (+7.9%), 2020 (+7.8%), and 2003 (+16.4%) stand out as periods of robust December gains.
These performances often coincide with favorable macroeconomic conditions, strong corporate earnings, and bullish market sentiments.
Sectoral Strengths: Consumer goods, IT, and financial services consistently contribute to positive returns during December, driven by seasonal demand and global contract renewals.
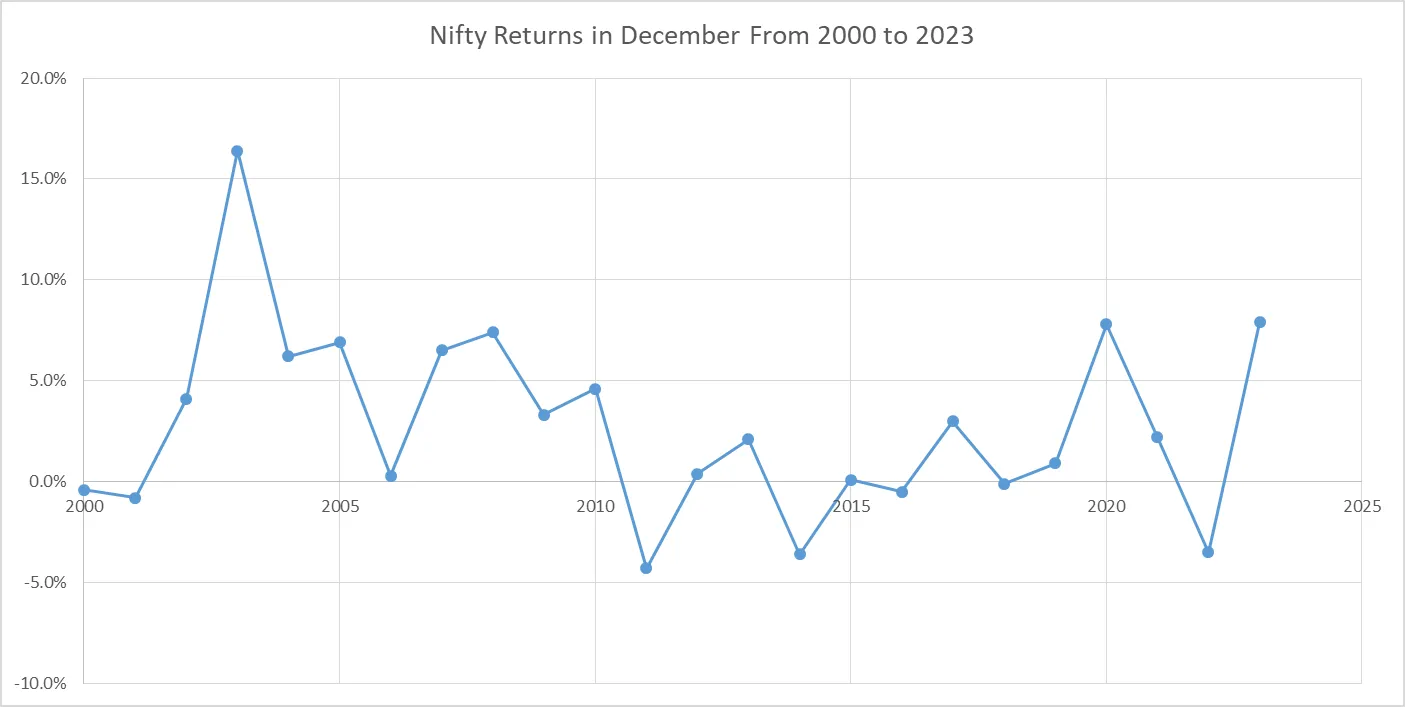
While the general trend in December is positive, there have been years when the Nifty index has experienced negative returns during December. These instances are usually attributed to external shocks and domestic challenges. The years with negative December returns for Nifty include 2011 (-4.3%), 2014 (-3.6%), 2022 (-3.5%), 2001 (-0.8%), 2000 (-0.4%), 2018 (-0.1%), and 2016 (-0.5%).
Factors Influencing Positive December Returns
Several factors contribute to this December surge in the Indian stock market:
Portfolio Rebalancing: Institutional investors often rebalance their portfolios in December to align with their annual performance goals. This rebalancing frequently involves increasing their equity exposure, leading to higher demand for stocks and driving prices upward.
Festive Season Boost: The festive season in India, which coincides with December, has a significant impact on consumer demand. Increased spending during festivals like Diwali and Christmas often translates to better-than-expected corporate performance projections, boosting market sentiment and driving stock prices higher.
Foreign Institutional Investors (FII) Activity: Historically, FIIs have been net buyers in the Indian stock market in December. Their increased buying activity contributes to the upward price movement during this month.
Economic Recovery Cycles: In years like 2020, post-pandemic recovery and stimulus measures played a critical role in sustaining upward momentum.
Expected Sector Performance in December
The outperformance in December is not confined to any specific sector. Consumer goods, banking, and IT sectors have consistently shown robust performance during this month.
Consumer Goods: The festive season drives increased demand for consumer products, leading to higher sales and profits for companies in this sector, positively impacting their stock performance.
Banking and Financial Services: Increased year-end lending and spending activities benefit the banking and financial services sector, translating into higher earnings and positive stock price movements.
IT: IT companies often see a surge in December due to global contract renewals and budget finalizations by international clients. This increased business activity enhances their earnings outlook and drives stock prices upward.
See what markets are pricing in
Live indices, sector moves and market breadth — the backdrop to every story we publish.
Indepth Analysis of Outperformance and Underperformance Across Nifty Indices in December (2012–2023)
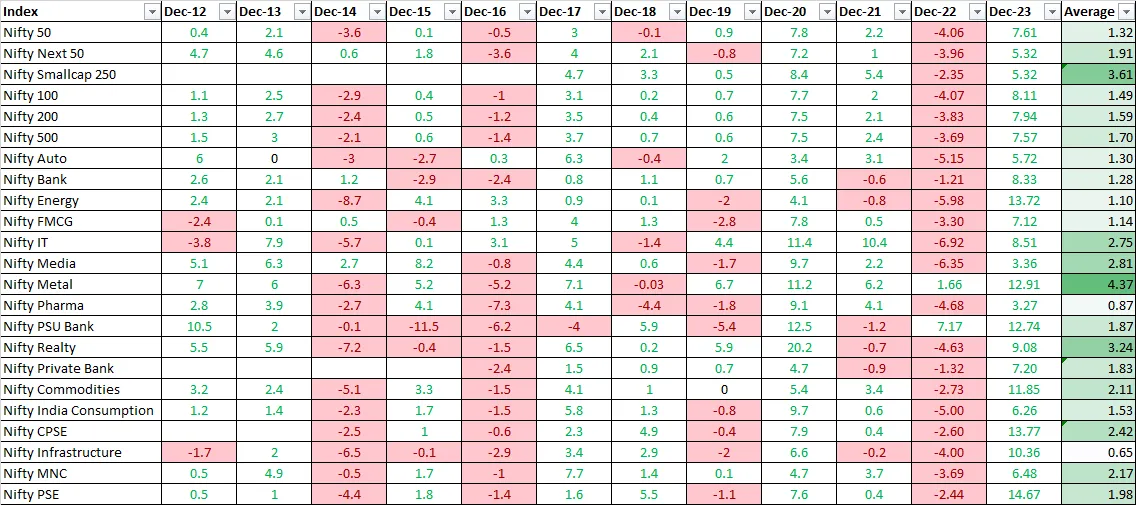
Looking at returns for Nifty indices in the month of December from 2012 to 2023, shows a clear distinction between outperforming and underperforming indices. Nifty Smallcap 250, Nifty Metal, and Nifty Realty are ideal candidates for high returns in December, while Nifty FMCG, Nifty Infrastructure, and Nifty Energy are more defensive in nature. Interestingly, all the mentioned Nifty indices ended December in the positive territory, on average.
Outperforming Indices During 2012 to 2023
Among the top performers, Nifty Metal emerged as a standout with an average growth rate of 4.37%, driven by cyclical upswings and robust demand in the metals sector, particularly in 2020 and 2023. Similarly, Nifty CPSE and Nifty Commodities demonstrated strong performance, reflecting the resilience and growth potential of public sector enterprises and commodity-related industries. Indices like Nifty Media (2.81%), Nifty IT (2.75%), and Nifty Realty (3.24%) also showcased consistent gains, benefiting from sectoral growth trends and periodic surges.
Underperforming Indices During 2012 to 2023
Conversely, underperformers such as Nifty Infrastructure (0.65%) and Nifty Pharma (0.87%) faced structural and demand-related challenges, with notable declines in specific years. Nifty Energy (1.10%) and Nifty FMCG (1.14%) struggled with volatility and conservative growth, while Nifty Auto (1.30%) grappled with regulatory pressures and subdued demand. Despite moments of recovery, Nifty Bank (1.28%) remained relatively subdued due to sector-specific headwinds.
Get research like this in your inbox
The week’s research that mattered, in five minutes. Joined by 2L+ investors.
Empirical Studies Exploring Stock Market Returns & Volatility in Indian Markets in December
Higher Volatility in December
A Pondicherry University study analysed the Bombay Stock Exchange SENSEX data from March 2011 to November 2016 and found a significant December effect in volatility and returns. The average volatility of the BSE SENSEX in December is generally higher than the average volatility in other months. This trend is consistent over the five years analysed in the study, except for 2012 when the US economy faced a fiscal cliff, potentially impacting the Indian stock market. The study attributes this to several factors, including:
Festival season and bonuses: The second half of the year in India is marked by festivals like Diwali and Christmas, along with year-end bonuses for employees. This leads to increased consumer spending and a boost to the economy, making December an attractive time for investment.
Investor optimism: Investors tend to be bullish about the next year's returns in December, further driving market activity.
Information leakages: Potential leaks of company or government strategies and budget information around this time can also influence market volatility.
Overall, the source suggests that there is a statistically significant December effect in the Indian stock market, with higher volatility and returns compared to other months.
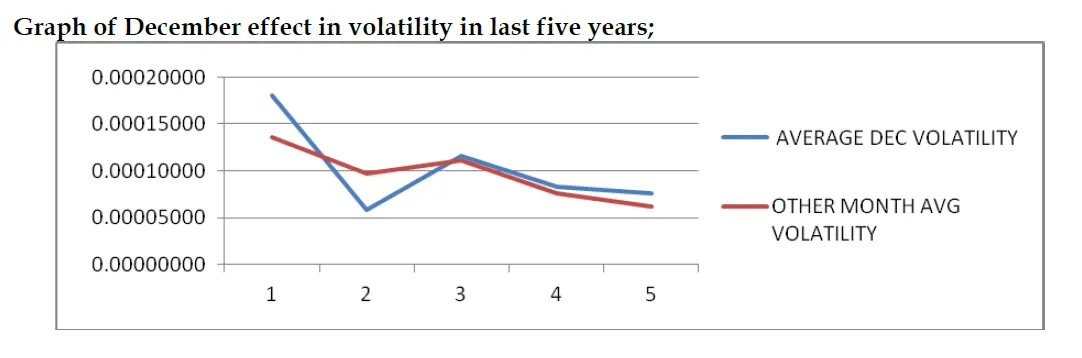
However, exceptions can occur due to external factors, as seen in 2012. The persistent December effect contradicts weak-form market efficiency, suggesting that investors could potentially leverage this anomaly for strategic gains. Research in both global and Indian markets indicates varying prevalence and intensity of calendar anomalies. For instance:
International studies have found the January Effect in the US and Europe, where returns in January surpass those of other months due to tax-loss selling and reinvestment behaviors.
In India, while studies have highlighted anomalies in March (end of the fiscal year) and December, other like October & November effect have also shown significant effects in different periods
December Returns vs. January & November Returns
Another study “Month‑of‑the‑Year Effect: Empirical Evidence from Indian Stock Market“ analysed the S&P BSE 500 and NIFTY 500 indices. Comparing the months of December, November, and January we see that for S&P BSE 500, December shows a mean return of 0.729%, which is significantly lower than January’s 1.474% and November’s 1.545%. This suggests that December is not as high-performing month compared to its counterparts. While the mean return for December is positive, it lags behind the stronger performance observed in November and January. In terms of volatility, December’s standard deviation is higher than November and January, indicating that December is a more volatile month and presents a greater risk-reward trade-off for investors.
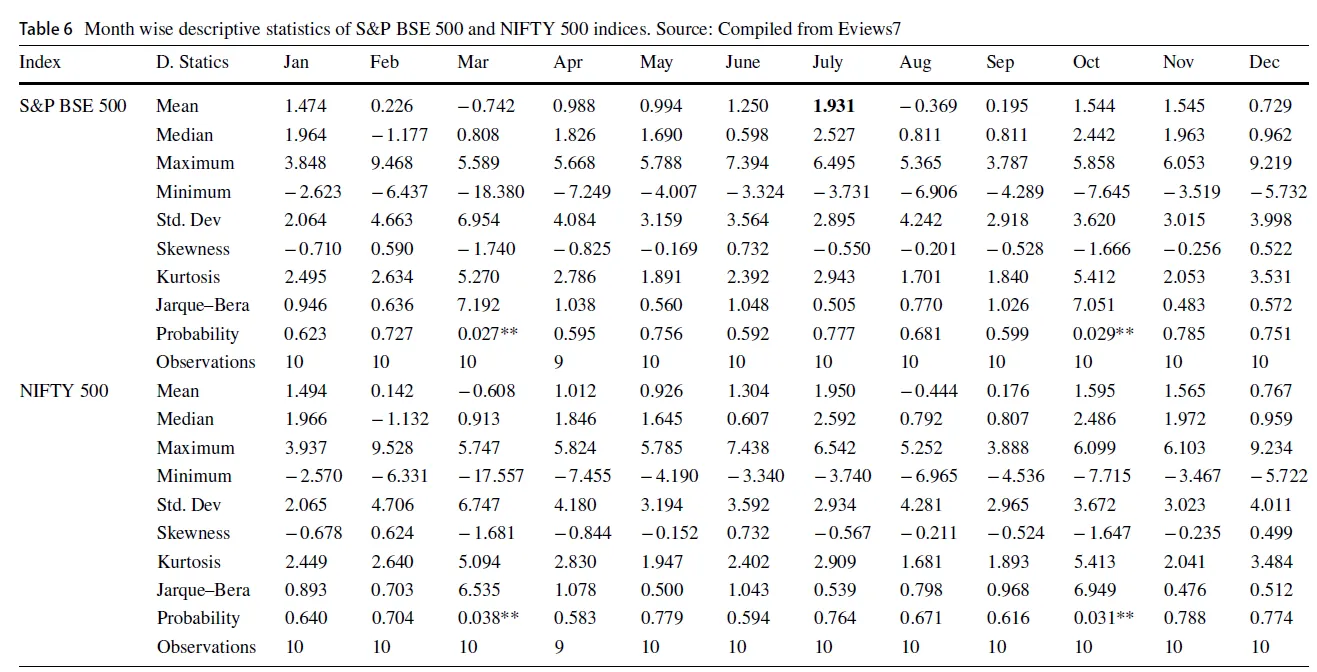
Similarly, for the NIFTY 500, December’s mean return of 0.767% is the lowest among the three months, trailing November’s 1.565% and January’s 1.494%. Like the S&P BSE 500, December is also the most volatile month for the NIFTY 500, with a standard deviation of 4.011, compared to November’s 3.023 and January’s 2.065. These figures suggest that November is the strongest performing month in terms of returns for both indices, followed by January, with December being relatively weaker.
How December Starts Is Important For The Performance of US Markets
The month of December is often perceived as a period of optimism and strength in financial markets, thanks to factors such as the holiday season and year-end adjustments. However, historical data for the S&P 500 over the last 50 years reveals a more nuanced picture, particularly when examining performance on the first trading day of the month. December has demonstrated relatively weak returns compared to other months. The average return on the first trading day of December is -0.10%, one of the lowest among all months, with a median return of 0.06% and a positivity rate of only 46%. This stands in stark contrast to months like July, which boasts an average return of 0.24% and a positivity rate of 73%. These figures highlight that December’s strong reputation may not extend to its early trading sessions.
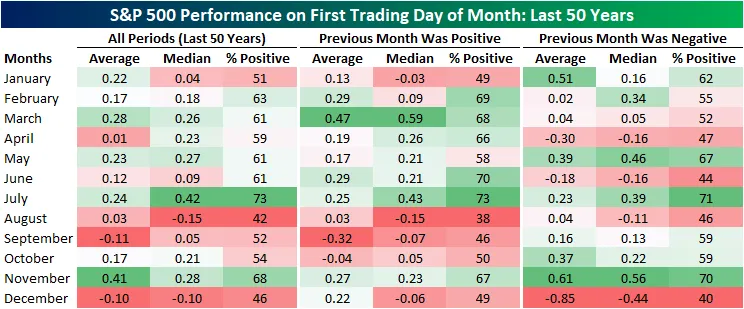
Further analysis reveals that the performance of the preceding month significantly influences the first trading day of December. When November posts positive returns, December begins on a slightly stronger note, averaging a return of 0.22% with a positivity rate of 50%. However, the median return in such cases dips to -0.06%, reflecting inconsistency. On the other hand, if November ends with losses, December performs poorly, averaging -0.85% on the first trading day, with gains occurring only 40% of the time. This underperformance suggests that December’s start is particularly vulnerable to the momentum—or lack thereof—carried over from November.
Although December is often associated with the " Santa Claus Rally ," a period of market optimism typically observed in the final trading days of the year, the data underscores that this trend does not extend uniformly across the entire month. The weak performance on the first trading day contrasts with the broader optimism of December and aligns it with another underperforming month, August, which also struggles early on regardless of the prior month’s performance. These insights serve as a reminder that while December may overall be a strong month for markets, its early days require cautious navigation.
Is your portfolio built for what’s coming?
Get a free AI-powered review of your holdings — risk, overlap and quality in minutes.
Outlook for Indian Markets in December 2024
The positive performance of the Nifty index in December over the years suggests a "December effect" in the Indian stock market. This effect is driven by a confluence of factors like portfolio rebalancing, increased consumer spending during the festive season, and positive FII activity. However, external shocks and domestic policy changes can occasionally lead to negative returns, making it crucial for investors to be aware of the potential risks.
The outlook for the Indian economy is characterised by a slowdown in growth and persistent inflation concerns, both of which could negatively impact corporate earnings.
RBI has revised its GDP growth forecast for FY25 downwards from 7.2% to 6.6%, acknowledging a potential miss in its initial estimates.
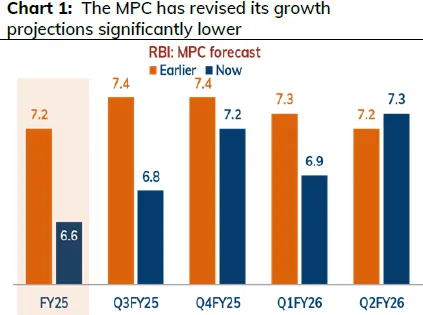
Some analysts believe the actual GDP growth for FY25 could be even lower, at 6.3%. This slowdown is attributed to various factors, including weak industrial performance, muted urban demand, and potential global headwinds under the new US administration.
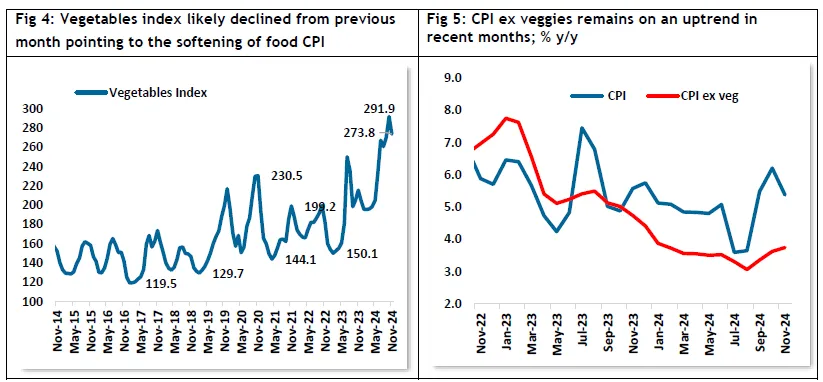
Despite the growth slowdown, the RBI has raised its inflation projection for FY25 to 4.8%. This upward revision is driven by volatile food prices, particularly vegetables, and potential global supply chain disruptions.
Despite occasional setbacks, the overall trend for December remains positive, and the outlook for December 2024 appears optimistic, citing strong economic indicators and the recovery of corporate earnings post-pandemic as key drivers.
The RBI reduced the CRR by 50 bps in two equal tranches of 25 bps each, effective from 14th and 28th December 2024. This move will release ₹1.16 lakh crore into the banking system and also have a positive impact on the stock market by improving investor sentiment.
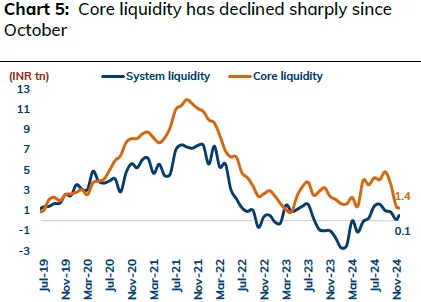
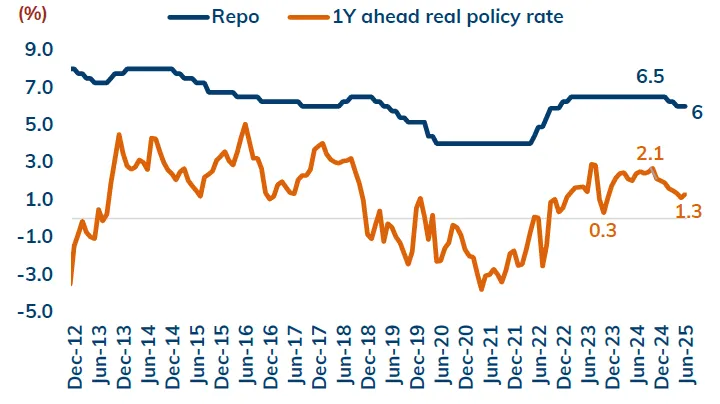
While in December the repo rate was kept unchanged at 6.50% for the eleventh consecutive time, anticipated rate cuts starting in February 2025 could provide a boost to the market by lowering borrowing costs for businesses and increasing consumer spending.
Historical trends suggest that high-performing sectors like consumer goods and IT provide attractive investment opportunities during December, particularly during market dips. Strategic allocation toward these sectors can help investors maximize returns while navigating December’s inherent volatility.


