


Two companies can report the same profit but use very different amounts and types of capital to produce it. Return on equity focuses on the shareholders' capital. Return on capital employed evaluates the operating return generated from a wider funding base.
Understanding ROE vs ROCE helps investors separate genuine operating efficiency from returns amplified by debt. Neither ratio should be used alone. This guide explains both formulas, works through a common example and shows how to combine the ratios with cash flow, leverage and valuation.
What Is ROE (Return on Equity)?
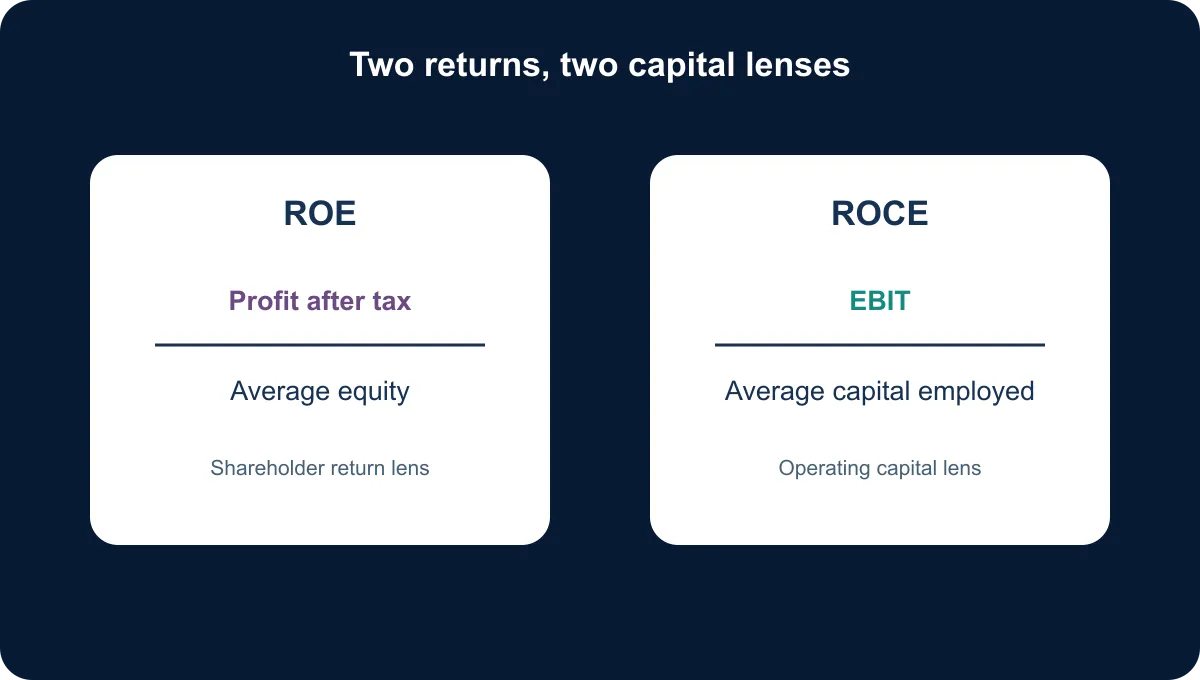
Return on equity measures the profit available to equity shareholders relative to their capital in the business.
ROE = Profit after tax ÷ Average shareholders' equity × 100
Average equity is usually preferable when the balance changes materially during the year. It can be calculated from opening and closing equity. When investors ask what is roe in stock market analysis, the practical answer is a measure of how effectively the company converts shareholder funds into accounting profit.
A 15% ROE means the company generated ₹15 of profit after tax for every ₹100 of average equity during the period. It is not a guaranteed investor return. The market price paid for the shares, dividends and future earnings growth determine the shareholder's realised outcome.
ROE can also rise when a company takes on debt and reduces its equity base. Therefore, a second answer to what is roe in stock market research is that it is a useful shareholder lens that must be checked against leverage and cash generation.
See what markets are pricing in
Live indices, sector moves and market breadth — the backdrop to every story we publish.
What Is ROCE (Return on Capital Employed)?
Return on capital employed compares operating profit with the long-term capital used by the business.
ROCE = EBIT ÷ Average capital employed × 100
EBIT is earnings before interest and tax. Capital employed is commonly calculated as total assets minus current liabilities, or as equity plus non-current debt. Analysts should apply one definition consistently and reconcile unusual items.
For readers asking what is roce in share market analysis, ROCE indicates how productively the core operation uses both equity and debt capital before financing costs and tax. It is particularly relevant for manufacturing, utilities, telecom and other businesses that require substantial assets.
The interpretation of what is roce in share market research also depends on reinvestment. A high ratio is more valuable when the company can deploy additional capital at attractive returns without weakening its balance sheet.
ROE vs ROCE: Formulas and Worked Example
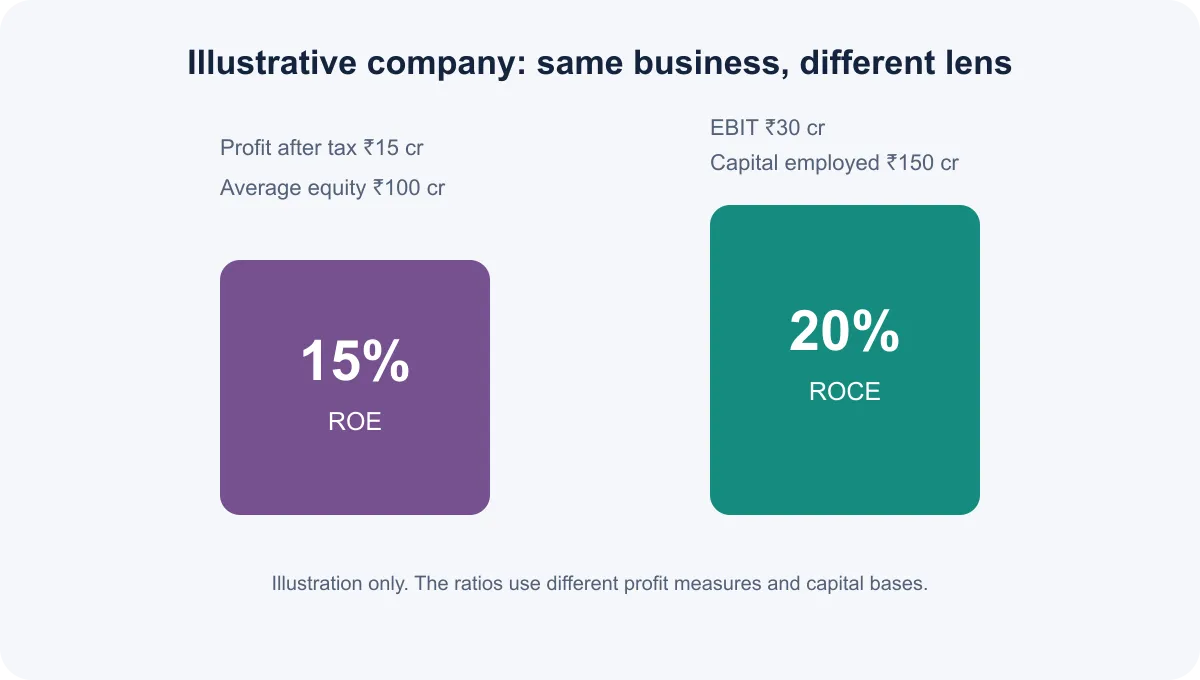
Consider an illustrative manufacturer with ₹15 crore profit after tax, ₹30 crore EBIT, ₹100 crore average equity and ₹150 crore average capital employed.
| Item | Illustrative amount |
|---|---|
| Profit after tax | ₹15 crore |
| EBIT | ₹30 crore |
| Average shareholders' equity | ₹100 crore |
| Average capital employed | ₹150 crore |
ROE is ₹15 crore ÷ ₹100 crore = 15%. ROCE is ₹30 crore ÷ ₹150 crore = 20%. This ROE and ROCE example uses different profit measures and denominators because the ratios answer different questions.
The difference between roce and roe is not the five-percentage-point gap alone. ROE is after interest and tax and belongs to equity holders, while ROCE is before interest and tax and measures operating productivity across long-term capital.
ROE vs ROCE: Key Differences
The following table captures the main ROE and ROCE difference.
| Feature | ROE | ROCE |
|---|---|---|
| Numerator | Profit after tax | EBIT |
| Denominator | Shareholders' equity | Equity plus long-term debt, or assets less current liabilities |
| Main lens | Return attributable to owners | Operating return from capital employed |
| Debt effect | Can be lifted by leverage | Includes debt capital in the base |
| Best use | Equity efficiency and bank-style analysis | Capital-intensive operating businesses |
In an ROE vs ROCE comparison, the same company can look strong on one ratio and ordinary on the other. High ROE with modest ROCE may indicate leverage is boosting shareholder returns. Strong ROCE with lower ROE may reflect interest, tax, surplus cash or other non-operating factors.
The difference between roce and roe should therefore be traced through the income statement and balance sheet instead of treated as a ranking contest. Formula definitions can vary between data providers, so compare recalculated numbers on a consistent basis.
Get research like this in your inbox
The week’s research that mattered, in five minutes. Joined by 2L+ investors.
When Is ROE More Useful and When Is ROCE More Useful?
ROE is useful when the central question is the return earned on shareholder capital. For banks and many financial companies, debt behaves more like operating raw material, making conventional capital-employed comparisons less informative. Regulatory capital and asset quality are also crucial.
ROCE is often more revealing for industrial and asset-heavy companies because it assesses returns before financing choices. A factory, power asset or telecom network must earn enough on total long-term capital to justify reinvestment.
The ROE and ROCE difference becomes especially informative when leverage changes. Investors can use Wright Research's quantitative glossary to standardise definitions before comparing businesses across datasets.
How to Use Both Ratios When Analysing a Stock
Start with a multi-year trend rather than one exceptional period. Compare a company with peers that share similar business models and accounting. Then examine debt, interest coverage, operating cash flow, asset turns and reinvestment needs.
A practical ROCE vs ROE review asks:
- Are both ratios stable through a business cycle?
- Is ROE high because profit is strong or equity is unusually small?
- Does operating cash flow broadly support accounting earnings?
- Is ROCE above the company's cost of capital over time?
- Can the business reinvest without diluting future returns?
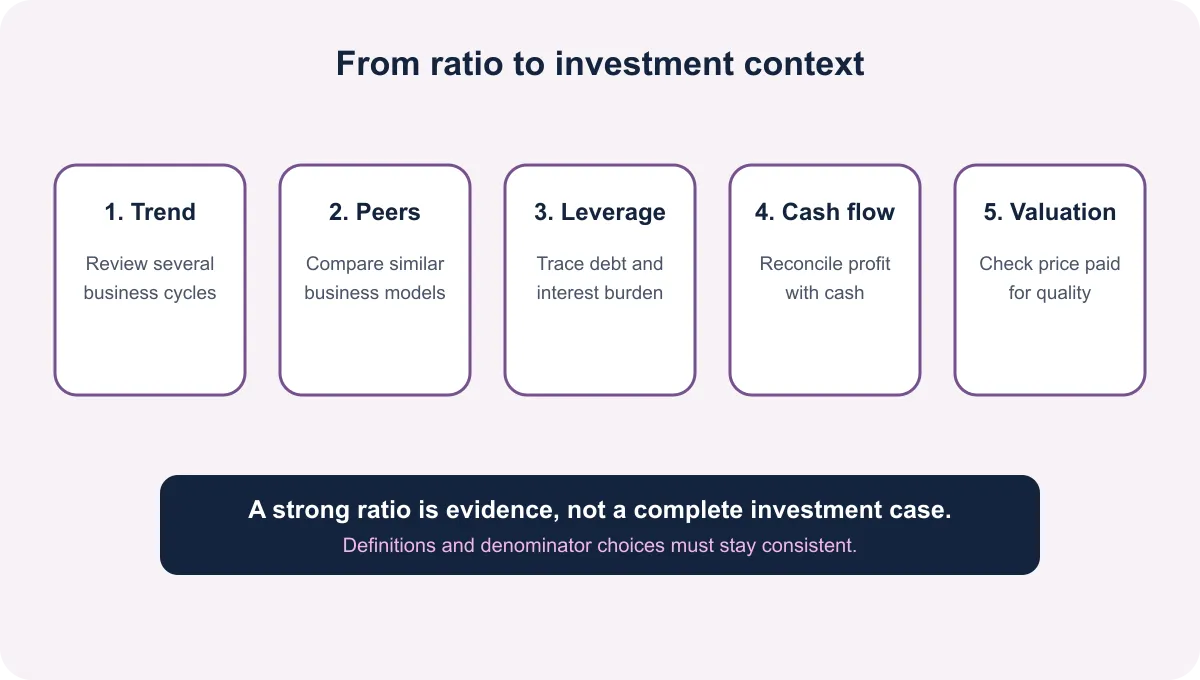
Ratio quality does not determine whether a stock is attractively priced. Apply an appropriate stock valuation method after assessing economics, and use stock research tools to compare like-for-like businesses. The best ROE vs ROCE profile can still be a poor investment at an excessive valuation.
Limitations and Common Interpretation Mistakes
Accounting choices, acquisitions, impairments, asset revaluations and buybacks can distort both ratios. Using year-end equity after a large dividend or issue can also mislead, which is why average capital is often better.
Common mistakes include:
- Treating a high ROE as proof of quality without checking debt.
- Comparing a bank's ROCE directly with a manufacturer's ROCE.
- Mixing EBIT, operating profit and profit after tax definitions.
- Ignoring negative or very small equity, which can make ROE meaningless.
- Assuming a high ratio means the stock is undervalued.
The ROCE vs ROE order in a search phrase does not change the analytical principle: use consistent inputs and investigate why the ratios differ. A sound ROE vs ROCE conclusion combines trend, peer context, cash conversion, leverage and valuation.
Is your portfolio built for what’s coming?
Get a free AI-powered review of your holdings — risk, overlap and quality in minutes.
FAQ
What is considered a good ROE for an Indian company?
There is no universal threshold. A useful ROE is sustainable, supported by cash flow and achieved without excessive leverage. Compare it with the company's history, direct peers and the risks required to earn it.
What is considered a good ROCE in a capital-intensive industry?
ROCE should be assessed against peers and the company's cost of capital across a full cycle. A ratio above the cost of capital suggests value creation, but investors must test whether it can persist as new capital is invested.
Can a company report high ROE despite weak operating cash flow?
Yes. Accruals, working-capital build-up, one-off gains, leverage or a reduced equity base can produce high ROE while cash conversion is weak. Reconcile profit with operating cash flow over several years.
Are ROE and ROCE useful metrics for banks and financial companies?
ROE is commonly useful for financial companies, alongside asset quality, margins and regulatory capital. Conventional ROCE is often less meaningful because borrowing is integral to operations and the industrial-company distinction between financing and operations becomes blurred.
Used together, ROE vs ROCE reveals who receives the return, how much capital the operation consumes and whether financing choices are shaping the result. The ratios become decision-useful only when their inputs and business context are understood.


