
You need to have a good strategy in place to take any decision! Strategies become even more essential when it comes to investments. Resources to build good strategies though, have always been lacking. Therefore, Wright brings to you Simulator, a user friendly platform where you can build your own strategies. You can also see how your strategy performs against benchmarks and make further customisation to keep improving. Let's look at the platform and understand how to build a strategy on Simulator.
Here's a step by step flow of how you can use Wright Simulator to build you own quant strategies
Step 1
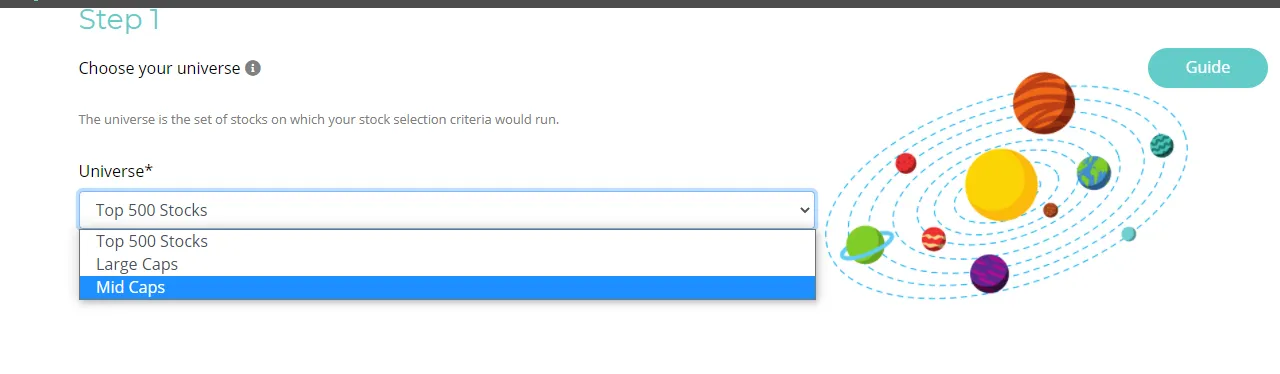
Choose your universe
In the first step you choose the set of stocks you would like to build your strategy around. You have options to choose from top 500 or choose according to market capitalisation of stocks.
Step 2
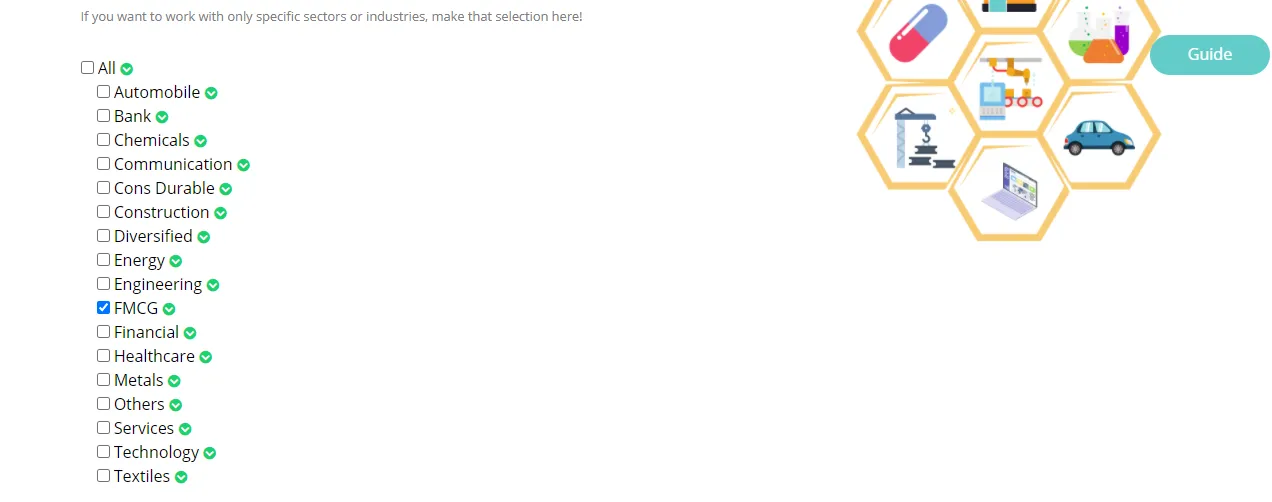
Choose your sectors or industries
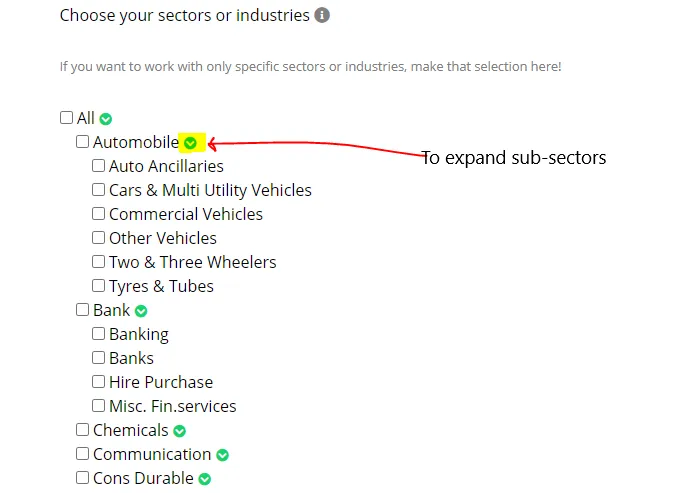
In the second step you have the option of choosing sectors in which your strategy will work optimally. You can have all the sectors, a set of sectors, single sector or even sub-sectors (click on the green arrow).
Step 3
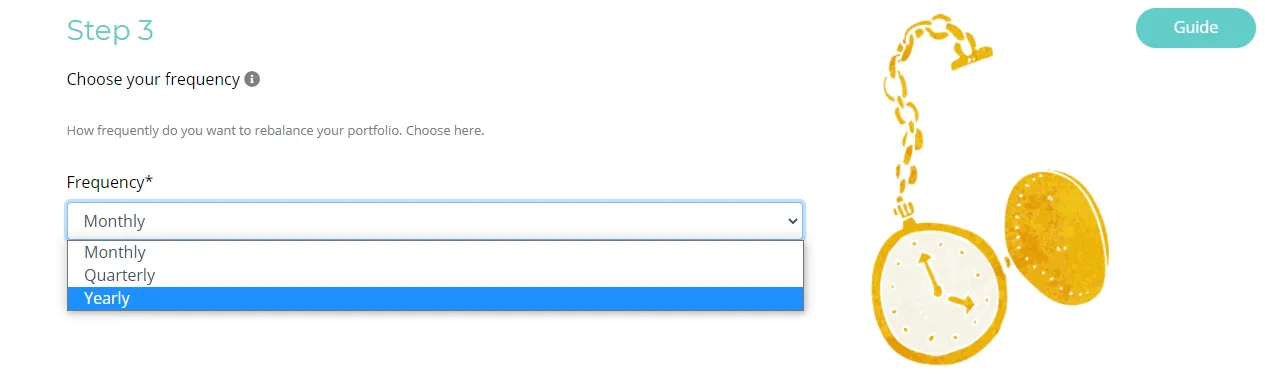
Choose your frequency
In the third step you choose the frequency with which you would like your portfolio to be rebalanced. Rebalancing changes the weights(how much shares you should have(buy/sell) of a stock in your portfolio) allotted to stocks of your portfolio in accordance with your strategy, removes stocks that no longer comply with your strategy and adds new stocks that comply well with your strategy. Here, according to your activity preference you can choose frequency to be monthly, quarterly or yearly.
Step 4
Choose your theme
In the fourth step you define the main logic of your strategy. Here you have a number of variables to choose from and operators to apply to build any sort of strategy that will outperform the market. You can refer guide to see all the available variables and operators.
Example: You can use a single variable like "growth" for your strategy which will select stocks for your portfolio on the basis of how good the underlying firm growth has been. You can also combine variable "Growth" with "Momentum_ShortTerm", like Growth+Momentum_ShortTerm which will select stocks for your portfolio when the combined value of growth and momentum of the underlying firm is good.
Advanced
Here, you can do further customisation to make your strategy trade ready and also improve the overall dynamics of your strategy.
You can decide the normalisation of your portfolio. Normalisation mainly reduces data redundancy and improves data integrity. You have options in normalisation like cross-sectional which will normalise the entire data if you have chosen set of sectors, or you can choose sector cross-sectional which will normalise each sector data separately.
Then you have position sizing with option of inverse volatility. The basic idea of inverse volatility position sizing is that the more volatile position have smaller size whereas less volatile positions have larger size. You can choose these option to decrease drawdown it might affect returns positively/negatively but will improve overall Sharpe ratio.
Then you can also add expected trading costs in the cost option. You can also provide appropriate tags to your strategy.
Example
Here, We provide a simple example of strategy built in Simulator.
Step 1: Choose Top 500 Stocks
Step 2: Choose FMCG sector
Step 3: Choose frequency as Monthly
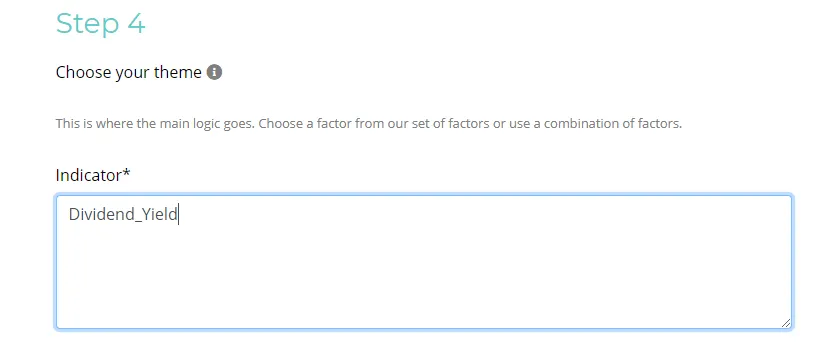
Step 4: As FMCG sector firms usually provide good dividends. We can assume that FMCG firms that provide good dividend_yield should perform well in the sector. So, we write Dividend_Yield
Now, we look at the performance by running the above strategy.
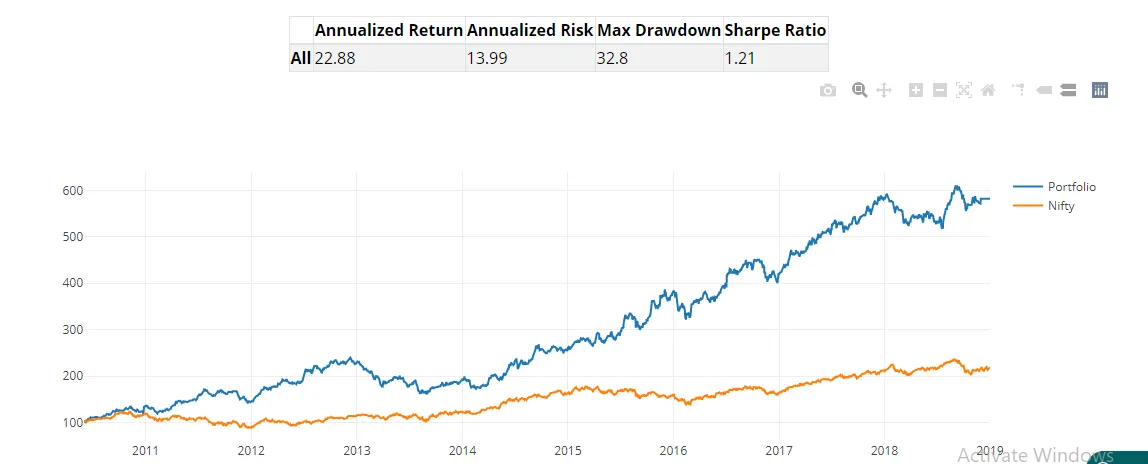
As we can see our portfolio returns outperform that of nifty from a simple strategy. Now, we look at advanced options to see if we can improve our strategy even further. We normalize using cross-sectional normalization (as we have only one sector) and do inverse volatility position sizing.
Final strategy performance
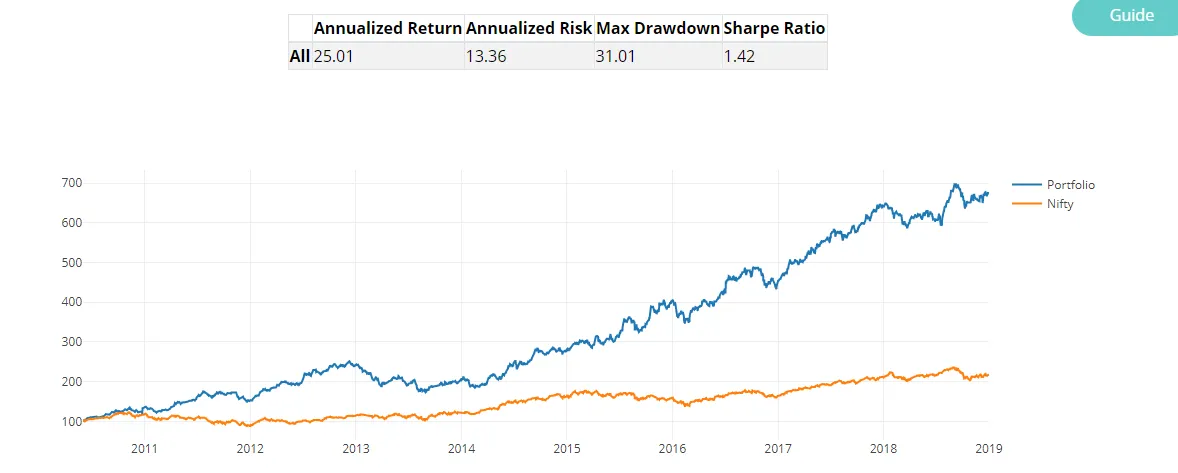
As we can see including advanced options helped our strategy improve. We have better returns and sharpe ratio, while risk and drawdown have gone down.
Guide
A comprehensive guide explaining the terms used for describing the investment themes & the functions that can be used is presented here
You are all set to make your own strategy on these amazing platform. All the best!