


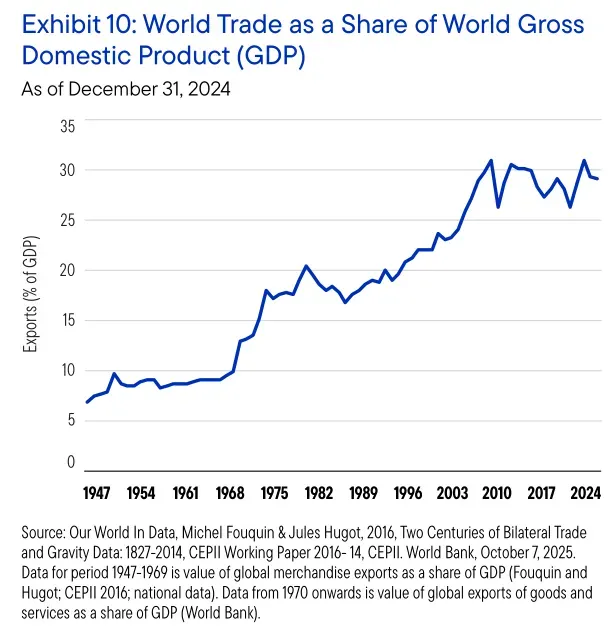
In the first half of 2025, it was easy to think global trade was entering a “deglobalisation” phase. Tariffs rose, restrictions multiplied, and supply chains became geopolitical objects, especially once tit-for-tat measures started spilling across sectors and borders.
World Trade Organization’s latest trade monitoring overview captures the scale of the shift: between mid-October 2024 and mid-October 2025, new tariffs and other import measures covered about USD 2.64 trillion of goods imports, over 4x the previous period, and nearly 1/5th of world imports (19.7%) are now affected by tariffs and similar measures introduced since 2009.
And yet, “trade falling apart” is not the same as “trade disappearing.” The same WTO overview notes that members also introduced hundreds of trade-facilitating measures, and that economists still estimated world merchandise trade growth of 2.4% in 2025, helped in part by front-loading and continued demand in specific segments such as AI-related products. The global economy has absorbed a major stress-test by rewiring how it trades, not by retreating into autarky.
That’s also the core message of the Global Value Chain Development Report 2025: globalization is reorganizing, not retreating. 2025 was a difficult year marked by tariffs and uncertainty, but one where supply chains proved resilient because firms adapted and government policies evolved in response to these trade shocks. Let’s look at this in more depth.
US & China Trade Breaks and the Geography of Diversion
The clearest structural shift is the thinning of the US and China trade corridor. A few years ago, the United States absorbed close to a fifth of China’s exports. That share fell from roughly 18–19% in 2017–18 to about 14–15% in 2024, and closer to 11–12% in 2025. This is a large move in a short time for the world’s most consequential bilateral trade relationship, and it matters because it reshapes incentives for everyone plugged into that corridor.
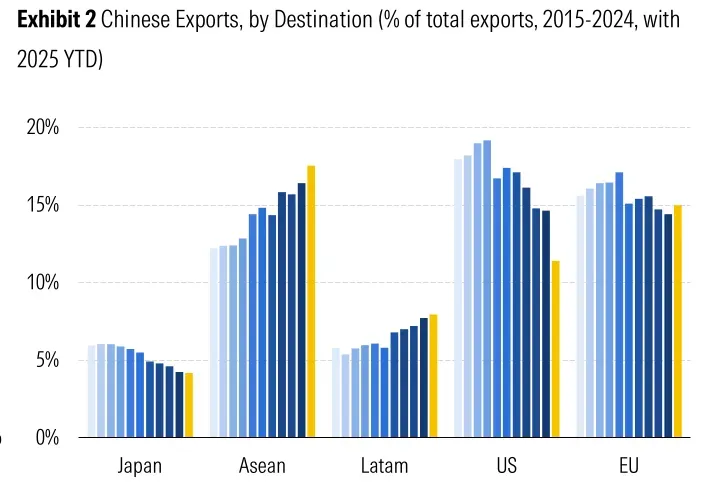
The critical nuance is that much of this trade didn’t vanish; it relocated. Southeast Asia absorbed a growing slice of China’s outbound trade, with ASEAN’s share rising from roughly 12–13% in 2015 to around 17–18% by “today,” making it China’s largest export destination. Latin America’s share climbed from around 5–6% to nearly 8%, while Europe remained broadly stable. The picture is one of diversion and absorption: the US channel narrows, while other channels deepen.
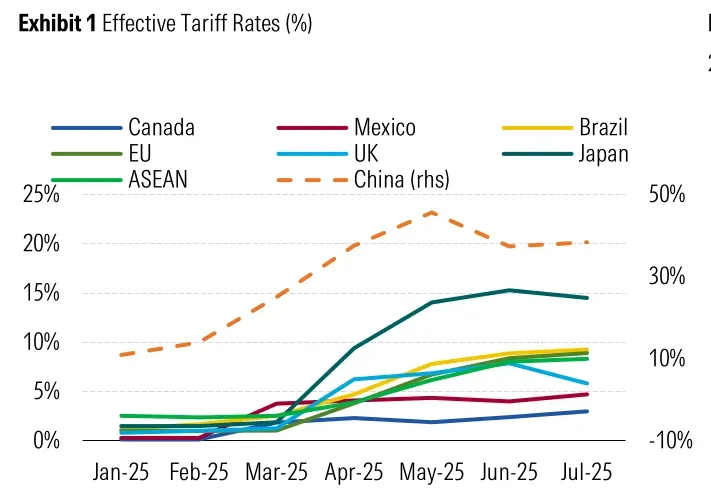
That diversion also explains why tariff levels can look dramatic in one dataset and underwhelming in another. US tariffs are clearly higher than pre-2018, but for many major partners they still sit below 10%, far from a 1930s-style shutdown. The bigger transformation is not the average tariff; it is the reallocation of production steps across borders so that firms can keep selling into large markets while reducing direct exposure to contested routes.
Check the macro backdrop
GDP, inflation, rates and more — India’s key economic indicators in one dashboard.
Globalisation Shifts from Goods First to Network First and Services Led
Fragmentation is real, and the data show it. Recent trade patterns highlights how the gap between “traditional” bilateral trade and multi-border global value chain trade widened during disruptive periods like the 2019–2020 PRC–US trade dispute and the pandemic, suggesting that shocks and geopolitical frictions increasingly reshape the structure of trade rather than merely shrinking it. This matters because value chains are not just volumes; they are relationships, sequencing, and the distribution of tasks across borders.
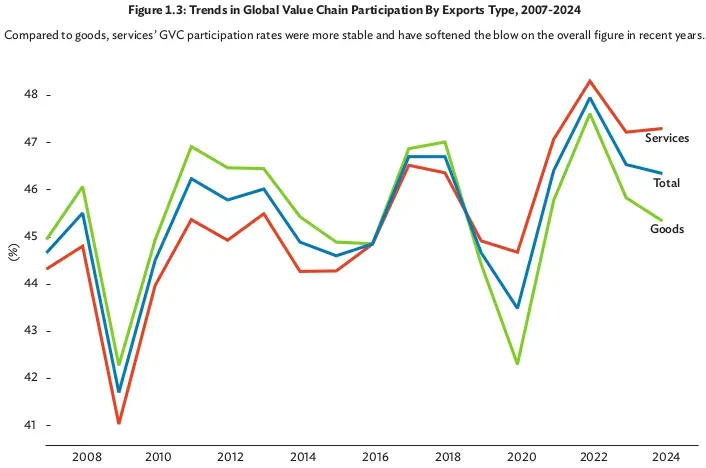
One of the most revealing metrics is how little the overall degree of value-chain globalization has moved, despite the political noise. Global value chain related trade peaked at 48% of total trade in 2022 and then eased to 46.3% in 2024. That decline is meaningful, but it is not a collapse. It is better read as a rebalancing: the world is still deeply connected, but the balance of which links matter most is changing.
World exports fell by about 6.63%, from $25.48 trillion (2018) to $23.8 trillion (2019), with the China & US trade dispute as a major trigger. They then rebounded sharply, with world exports rising by about 25.8% in 2021 and 11.2% in 2022. Even after that surge, the system absorbed the Ukraine-war era disruptions and later policy frictions with an uneven slowdown rather than a breakdown.
What 2025 adds is not a new kind of volatility, but a new kind of policy-driven uncertainty. Average tariffs and other restrictions reached levels “not seen in decades,” and emphasizes that uncertainty itself can be distortive even before a single container is delayed. In this environment, firms do not wait for rules to stabilize; they adapt in anticipation redesigning sourcing, inventory, and routing as a form of risk management.
Global value chain related trade grew faster than traditional bilateral trade in the rebound period, then contracted more sharply in 2023, before both recovered in 2024. That pattern fits how firms behave under uncertainty: they do not instantly unwind complex multi-country production, but they do pause expansions, reduce marginal cross-border complexity, and shift final-stage processing to safer nodes.
Crucially, the composition of globalization is shifting. Services have overtaken goods in global value chain participation since 2019, and that services trade showed steadier growth after the pandemic compared with the volatility of goods trade. This is not just about IT exports; it includes finance, business services, logistics coordination, and the digital layers that make modern production possible. In parallel, WTO monitoring finds that many new services measures relate to regulatory frameworks, and a meaningful share target internet and network-enabled services. The “new age of trade” is increasingly built on invisible flows of data, standards, licenses, and professional movement alongside containers and ships.
Intangible capital has become a central competitive advantage. In many advanced economies, investment in intangibles like software and organizational know-how now exceeds spending on physical capital, and these assets help firms reconfigure quickly when shocks occur. In 2025, the most competitive supply chains are often the ones that can change shape fastest.
Connector Economies and the Rise of Indirect Trade
When direct trade becomes politically or commercially difficult, supply chains rarely stop; they route around obstacles. North America’s integration has deepened, with intra-regional trade growing more strongly than inter-regional trade, reflecting tighter regional production systems. Within that, Mexico stands out: while the US accounts for about 40% of regional trade, Canada captures a larger share of intra-regional traditional trade, whereas Mexico captures a higher share of global value chain related trade (about 35%), underscoring its role in intermediate production and re-exports inside supply chains.
This is what “connector economies” look like in the data: they become the places where tasks are reallocated when old routes are risky. The rise in intra-regional trade has occurred partly because of indirect US trade with the PRC through Mexico and Vietnam. The mechanism is often mundane but powerful: components shift assembly location, packaging moves, final-stage processing relocates, or supplier relationships are re-papered through intermediaries that sit on friendlier geopolitical terrain.
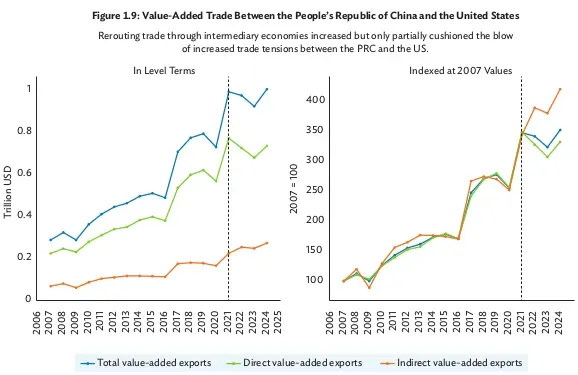
Rerouting isn’t a full substitute for direct trade. Looking beyond gross flows to value-added linkages, indirect value-added trade between China and US rose from 2021 to 2024, yet remained small relative to direct flows and did not compensate for the decline in direct value-added trade. That nuance is important: connector economies can soften shocks and keep goods moving, but they don’t magically recreate the scale and efficiency of a fully open bilateral relationship.
Get research like this in your inbox
The week’s research that mattered, in five minutes. Joined by 2L+ investors.
Resilience Becomes a Strategy, and Productivity Follows Capability
In the old globalization, many firms optimized for efficiency: lowest cost, just-in-time delivery, and minimal redundancy. The 2025 environment rewards a different posture: diversified sourcing, greater transparency, and supply chain mapping that treats disruption as normal rather than exceptional. Diversified sourcing and transparent mapping appear to be pillars of resilience, alongside sound macro-financial frameworks that prevent crises from cutting off trade and investment.
The deeper point is that resilience is not evenly distributed. Firm-level data confirm global value chain participation can boost productivity, with backward participation associated with 2 to 5% points higher productivity growth per year relative to non-participants, especially in technology-intensive sectors. That implies a feedback loop. Firms and countries with better connectivity, skills, and finance can both join and upgrade within value chains, which then raises productivity and makes them even more attractive nodes in a rewired system.
This is where “readiness” matters more than slogans. In a world where firms want alternatives, the winners are not automatically the lowest-wage locations; they are the places that can offer reliable logistics, regulatory predictability, digital infrastructure, and suppliers with real scale. 2025 saw a shift toward a structural equilibrium defined by regionalization and digitalization, where success depends on the capacity to adapt, innovate, and cooperate.
Industrial Policy and Targeted Trade Deals: Governance Rewires Too
Where the 1990s and early 2000s were defined by broad liberalisation, the mid-2020s are defined by selective state power. Global economic governance is being reshaped by two linked shifts: the resurgence of industrial policy and the proliferation of targeted trade deals. Industrial policy has re-emerged as a defining feature of the global economy, with governments using subsidies, tax incentives, mandates, and procurement to shape strategic sectors. Since 2020, announced programs across major economies exceed US$2 trillion, concentrated in semiconductors, clean energy, digital infrastructure, and upstream inputs such as critical minerals and battery components.
At the same time, trade agreements are mutating. Instead of sweeping, all-sector deals, governments are signing narrow “targeted trade deals” that focus on regulatory barriers in specific domains like digital trade and critical minerals. More than 185 of these were signed by end-2024 in just those two areas, with digital-trade linkages increasing more than 30x since 2019, and 80% of mineral-related deals concluded since 2022. This is a governance response to a world where the biggest trade barriers are increasingly non-tariff and strategic.
In 2023, global battery manufacturing consumed 85% of the world’s lithium and 70% of its cobalt, illustrating how concentrated dependencies can become strategic choke points. These targeted deals can matter even when they are not classic tariff-cutting pacts. Bilateral critical-minerals arrangements raised trade volumes between partners by an estimated 12%, while digital frameworks expanded cross-border services in participating economies. The new age of trade is as much about rules, standards, and access as it is about price.
The Era of Big Government and the Fiscal Overhang
Trade is being rewired at the same time as government balance sheets are becoming heavier. Deficits are staying large across advanced economies and major emerging markets, even without a recession-like crisis to “justify” them. Deficits across the G7, China, India, and Brazil remain firmly in the red through 2025 and 2026, driven by aging costs, welfare demands, defense spending, and higher interest bills as older debt rolls over.
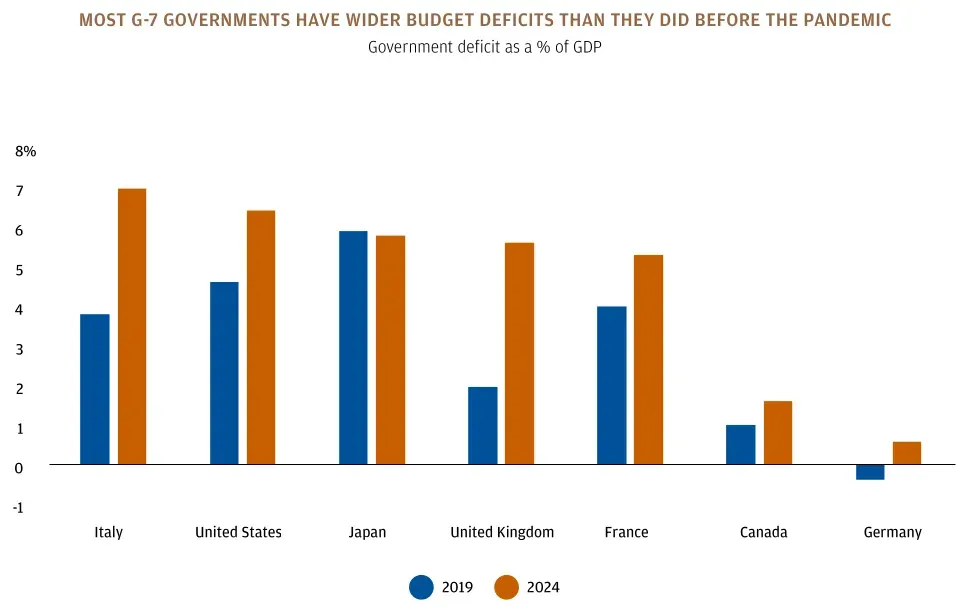
This fiscal overhang matters for trade because it changes the cost of capital and the politics of openness. When governments borrow heavily and persistently, they compete with the private sector for savings, which can keep real interest rates higher than investors have been conditioned to expect. A world that needs massive investment to build resilient, diversified supply chains is simultaneously a world where financing those investments becomes more expensive.
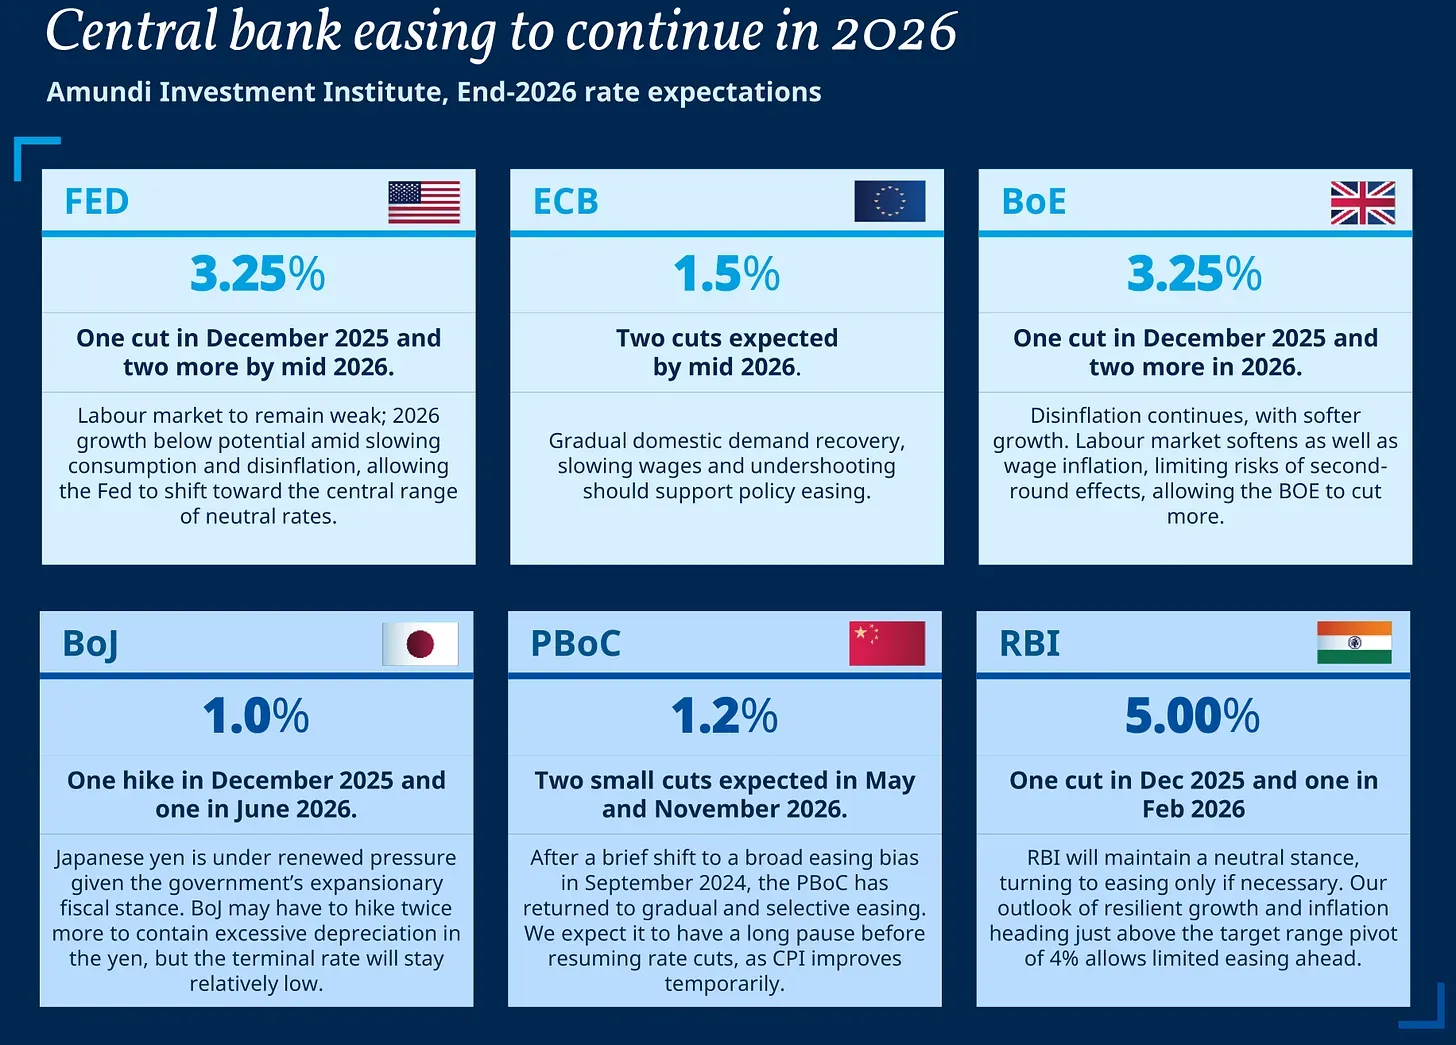
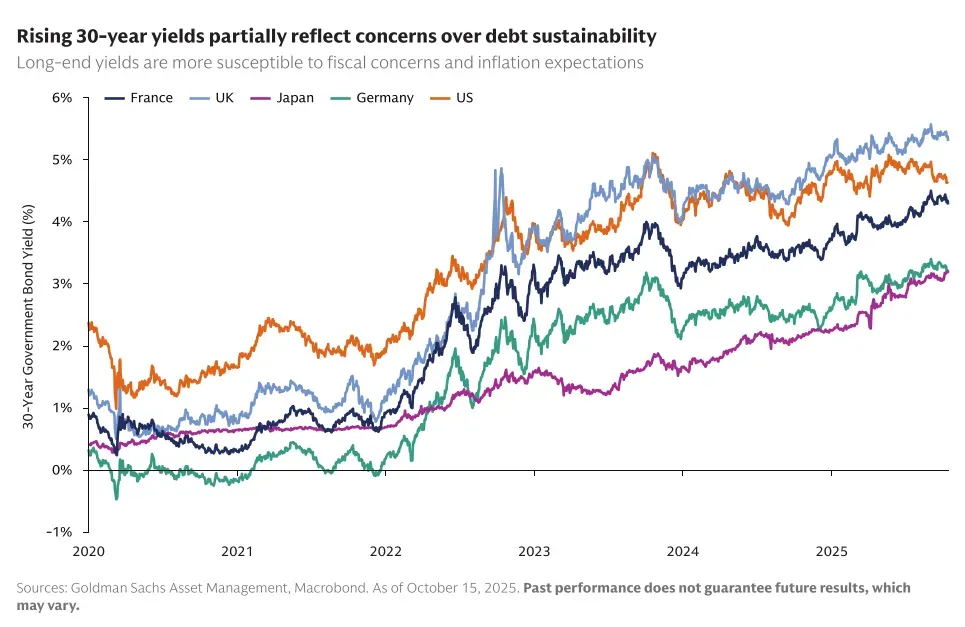
It also makes markets more sensitive to politics. The global government debt has crossed $100 trillion, and highlights how quickly bond markets can react when fiscal concerns collide with political uncertainty, citing France’s 10-year yields moving close to Italian levels as a warning sign in that narrative. In this environment, trade policy becomes entangled with fiscal reality: tariffs become a domestic political tool, subsidies become a strategic lever, and monetary policy independence becomes harder to preserve when debt service costs are high.
See what markets are pricing in
Live indices, sector moves and market breadth — the backdrop to every story we publish.
Where India Sits in the Rewired System of Global Trade & Value Chains
India’s position in this new map is best understood through value added, not just gross exports. India has become part of the top 10 value-adding economies since the pandemic, with 2.8% of global domestic value added in exports in 2024, a rise linked in part to the success of IT-enabled business process services. That aligns with the broader global shift toward services-led globalization: India’s comparative advantage fits the direction global value chains are moving.
At the same time, broader regional discussion hints at how geopolitics can pull India into new roles. Trade realignments after 2022 reshaped energy and intermediates flows, noting for example that by mid-2023 Russia became India’s largest crude oil supplier, with refined fuels accounting for about 28% of India’s total imports, up from 3.6% in 2021. Even when this trade is not “deep global value chain participation” in the classic manufacturing sense, it affects India’s input costs, inflation dynamics, and the competitiveness of downstream production.
The opportunity for India in a rewired world is not simply to “replace China” in manufacturing, but to become indispensable in specific layers of value creation: digital services, design and engineering, data-enabled operations, and selected manufacturing segments where scale, reliability, and ecosystem depth can be built. Reglobalization is useful here. The world is not choosing between openness and closure, but between old pathways and new ones. The era of big government changes the playing field for India too. If global deficits keep capital costs higher, the premium shifts toward countries that can deliver predictable policy, strong infrastructure execution, and stable macro-financial management. India’s task is to plug into the new pathways with capabilities that are difficult to substitute, so that resilience and competitiveness reinforce each other.


