


India’s electric vehicle market entered 2026 with broader adoption, more models and a deeper policy framework than it had a year earlier. The International Energy Agency says sales of all EVs in India reached a record 2.3 million units in 2025. Electric car sales rose by more than 75% to 165,000, while electric two-wheelers and three-wheelers continued to account for most unit volumes.
Those figures establish direction, but they do not settle the investment case. Adoption varies sharply by vehicle category. Subsidy timelines have changed. Domestic assembly has expanded faster than localisation of battery cells, power electronics and critical materials. Investors therefore need to assess the Indian EV sector in 2026 as a connected value chain, rather than treat every company with EV exposure as a common growth trade.
This review separates observed data from forecasts and focuses on the variables that can convert volume growth into durable earnings.
Where does the Indian EV sector stand in 2026?
The market is moving from early adoption towards category-specific scale. According to the supplied India EV and EV Components Market Report, India sold about 2.6 million EVs in calendar 2025, up from 2.0 million in 2024. The IEA uses a slightly lower 2025 estimate of 2.3 million for all EVs. Differences can arise from coverage, registration periods and vehicle definitions, so the two estimates should not be combined.
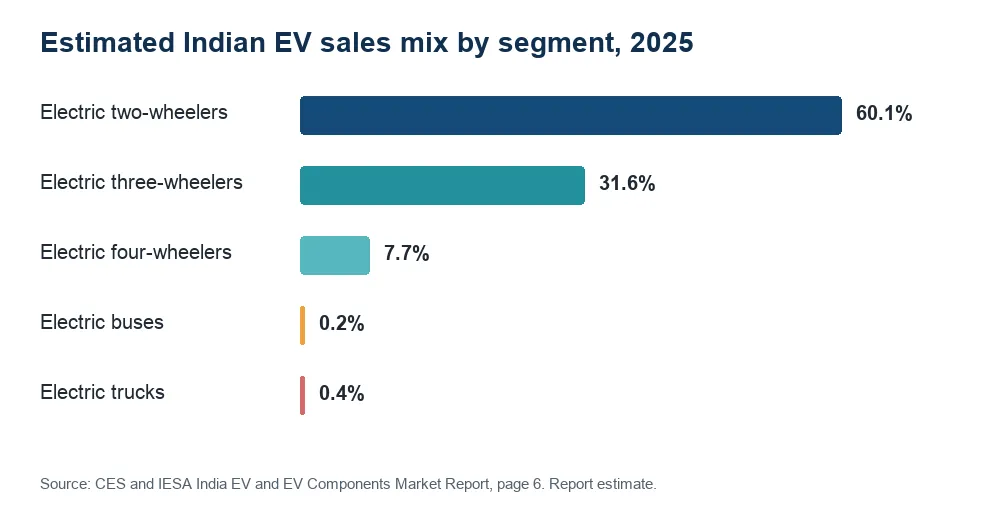
The segment mix is more informative than a single market total. The supplied report attributes about 60.1% of 2025 EV sales to electric two-wheelers and 31.6% to electric three-wheelers. Electric four-wheelers contributed 7.7%, with buses and trucks representing the balance. India’s transition is therefore led by small vehicles where daily utilisation, fuel savings and fleet economics can support adoption.
Passenger electric cars are gaining relevance from a smaller base. The IEA reports that their share approached 4% of Indian car sales in 2025 and that available electric car models increased from 33 in 2024 to 45 in 2025. More choice can broaden the addressable market, but competition can also raise marketing expenses and pressure pricing.
Early 2026 momentum remains constructive. The IEA says Indian electric two-wheeler and three-wheeler sales grew more than 30% year on year in the first quarter. A full-year conclusion would be premature because incentive changes, festive demand and new launches can shift registrations across months.
How was Indian EV demand distributed in 2025?
The segment mix below shows why India’s EV transition cannot be assessed through passenger cars alone. Two-wheelers and three-wheelers accounted for more than nine out of every ten units in the supplied report’s 2025 estimate.
See what markets are pricing in
Live indices, sector moves and market breadth — the backdrop to every story we publish.
Which vehicle segments are driving adoption?
Electric two-wheelers remain the largest source of unit demand. Their economics depend on purchase price, financing, battery life, service access and kilometres travelled. High-usage commuters and delivery fleets can recover the upfront premium faster than low-usage owners. Product quality and after-sales support are becoming more important as the market moves beyond subsidy-led customer acquisition.
Electric three-wheelers have achieved deeper penetration in commercial passenger and cargo use. The Ministry of Heavy Industries reported that the PM E-DRIVE target for L5 electric three-wheelers was met in December 2025, after about 288,500 vehicles were supported. This category benefits from frequent use and a clearer total-cost-of-ownership calculation. It also shows why adoption curves should be evaluated by use case.
Electric passenger cars are expanding through new models, larger batteries and wider price coverage. Yet their adoption still depends on home-charging access, resale confidence and public fast-charging availability. Fleet operators may reach an economic decision sooner than private buyers because utilisation is higher and routes are more predictable.
Electric buses and trucks offer greater battery demand per vehicle, even though their unit volumes are small. Their progress depends on procurement design, payment security, depot charging and vehicle uptime. Investors should distinguish announced tenders from delivered vehicles and operating fleets.
How much policy support remains available?
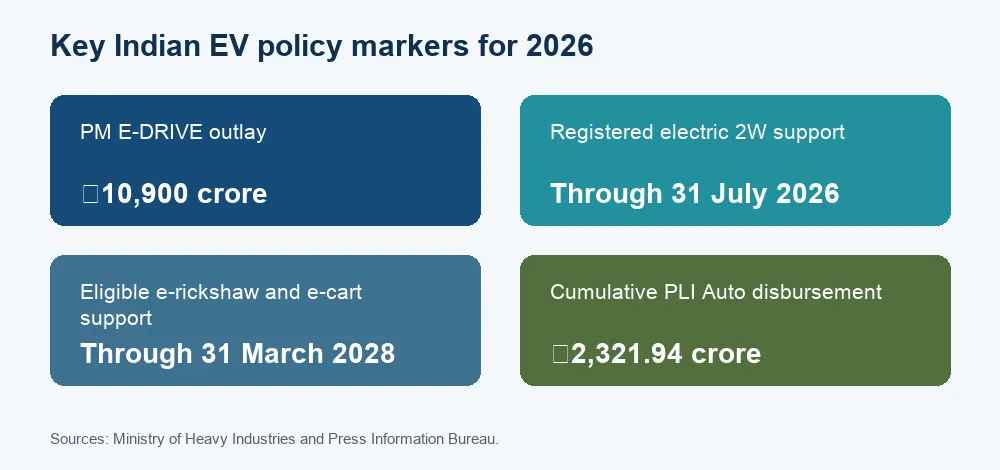
The ₹10,900 crore PM E-DRIVE scheme remains the central demand and infrastructure programme. Its design covers demand incentives, electric buses, public charging, testing upgrades, electric ambulances and trucks. The scheme portal shows that the terminal date for registered electric two-wheelers was extended to 31 July 2026, while eligible e-rickshaws and e-carts run to 31 March 2028. The L5 three-wheeler incentive closed after its target was achieved.
Policy support is also shifting towards manufacturing. The Production Linked Incentive scheme for automobiles has a ₹25,938 crore outlay and requires at least 50% domestic value addition for eligible products. By 31 December 2025, the government had disbursed ₹2,321.94 crore in cumulative incentives. It reported ₹35,657 crore of cumulative investment through September 2025.
These figures show capital formation, but investors should test whether incentive-linked sales generate acceptable margins and free cash flow. A subsidy can accelerate demand or offset investment. It cannot guarantee product competitiveness after support declines.
State policies add another layer through road-tax waivers, purchase incentives, manufacturing support and charging requirements. Terms and implementation differ across states, and draft policies should not be treated as active rules. Company forecasts that depend on a particular state incentive need verification against the latest notification.
Can localisation improve the EV value chain?
Localisation is the central industrial opportunity and a major execution risk. Vehicle assembly and battery-pack integration can expand while imported cells, semiconductors, rare-earth materials and electronic subcomponents still account for much of the value.
The supplied report estimates 2025 localisation at 10% to 20% for battery packs, 35% for traction motors, 28% for battery-management systems, 22% for inverters and 25% for DC-DC converters. These are research estimates, not audited industry statistics. They are useful as a directional map and should be checked against company disclosures before making a security-level decision.
The investment opportunity extends beyond vehicle manufacturers. It includes cells, pack enclosures, thermal systems, motors, controllers, power semiconductors, connectors, wiring, charging equipment, software, testing and recycling. Each layer has different economics. Some businesses can reuse capabilities from conventional vehicles or industrial electronics. Others need large plants, intellectual property and long qualification cycles.
The auto PLI’s domestic-value requirement can encourage local sourcing. The advanced chemistry cell programme can support domestic cell capacity. Actual competitiveness will depend on yields, capacity utilisation, technology choice, raw-material access and customer qualification. Announced capacity should therefore be separated from commissioned capacity and saleable output.
What does the component-localisation gap look like?
| Component | Estimated localisation in 2025 |
|---|---|
| Battery pack | 10% to 20% |
| Inverter | 22% |
| DC-DC converter | 25% |
| Battery-management system | 28% |
| Traction motor | 35% |
Source: Customized Energy Solutions and India Energy Storage Alliance, India EV & EV Components Market Report 2026-2032, page 8. These are secondary research estimates.
Get research like this in your inbox
The week’s research that mattered, in five minutes. Joined by 2L+ investors.
Is charging infrastructure keeping pace?
Charging needs depend on the vehicle. Many two-wheelers can charge at homes or workplaces, three-wheelers may use dedicated hubs, and buses typically require depots. Passenger cars need a combination of home, destination and highway charging. A national charger count cannot reveal whether the right charger is available at the right location.
PM E-DRIVE allocates ₹2,000 crore for public charging infrastructure. Operational guidelines were issued in September 2025, and the Ministry listed further clarifications in December 2025. Government responses in March 2026 described charging as an unlicensed activity and confirmed the allocation for deployment.
The relevant indicators are charger uptime, utilisation, power availability, connector compatibility and the economics of the charging operator. Low utilisation can delay profitability even as the network improves confidence for drivers. High-demand sites may require grid upgrades that lengthen project timelines.
For investors, charging should be treated as infrastructure with location and utilisation risk, not as a simple vehicle-sales multiple. Equipment suppliers, network operators and utilities occupy different positions in the return profile.
What should investors track across the EV value chain?
The supplied report’s base case projects annual EV sales rising from 2.6 million in 2025 to 3.2 million in 2026 and 17.2 million in 2032. Its higher-growth scenario reaches 3.9 million in 2026 and 30.4 million in 2032. These are scenarios from Customized Energy Solutions, not consensus forecasts or assured outcomes.
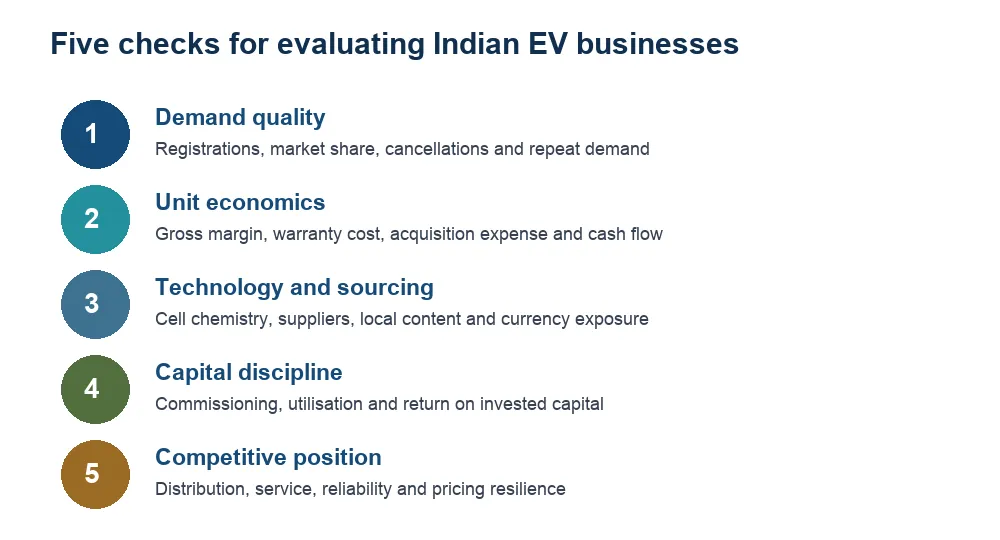
Investors can use five tests to evaluate exposure:
- Demand quality: Track registrations, retail market share, cancellations and repeat demand instead of relying only on wholesale dispatches.
- Unit economics: Compare gross margin, warranty cost, customer-acquisition expense and cash flow as volumes increase.
- Technology and sourcing: Review cell chemistry, supplier concentration, local content and exposure to currency or critical-material shocks.
- Capital discipline: Compare announced investment with commissioning, utilisation and return on capital.
- Competitive position: Assess distribution, service, product reliability and the ability to sustain pricing after incentives change.
This framework applies differently across original equipment manufacturers, component makers, battery businesses and charging companies. A diversified manufacturer may fund EV investment from an established business, while a pure-play company can offer greater growth sensitivity with higher financing and execution risk.
Valuation must reflect that difference. Revenue growth without improving contribution margin can require repeated capital. A lower-growth supplier with qualified products and multiple customers may have more visible economics than a high-growth assembler with weak differentiation.
What could change the Indian EV outlook?
The constructive case rests on expanding model choice, improving total cost of ownership, policy continuity and domestic manufacturing. Several risks can interrupt that path.
Demand could weaken if purchase incentives fall faster than vehicle costs or financing remains expensive. Safety incidents and poor service can damage category trust. Aggressive discounts can support volume while reducing industry profitability. Battery degradation and uncertain resale values can affect private buyers.
Supply risks remain material. India imports critical cell materials, electronics and rare-earth inputs. Trade restrictions, currency depreciation or logistics disruption can raise costs. Technology can also change before new capacity earns its expected return.
Policy execution matters as much as policy outlay. Delays in bus procurement, charger deployment, testing or incentive payment can affect working capital and capacity use. State rules can change at different speeds.
The 2026 Indian EV sector is therefore a measurable growth market, but it is not a uniform investment theme. Two-wheelers and three-wheelers provide scale, cars broaden consumer choice, and buses and trucks can lift battery demand. The strongest businesses will be those that convert adoption into reliable products, local capability, disciplined capital use and cash generation.
Follow this sector’s live moves
Sector-level performance across Indian markets, updated through the day.
What are the key FAQs about the Indian EV sector?
How large was India’s EV market in 2025?
The IEA estimates that India sold 2.3 million EVs in 2025. The supplied industry report estimates 2.6 million. The difference reflects methodology, so each number should retain its source and definition.
Which EV segment leads sales in India?
Electric two-wheelers lead unit sales, followed by electric three-wheelers. Commercial use and frequent daily travel make operating-cost savings more relevant in these categories.
Is PM E-DRIVE still active in 2026?
Yes, but timelines differ by category. Registered electric two-wheelers were extended to 31 July 2026, eligible e-rickshaws and e-carts to 31 March 2028, and the L5 three-wheeler incentive closed after its target was reached.
Are Indian EV components fully localised?
No. Assembly and some motor or software capabilities are developing, while battery cells, semiconductors, rare-earth inputs and advanced electronics retain significant import exposure.


