

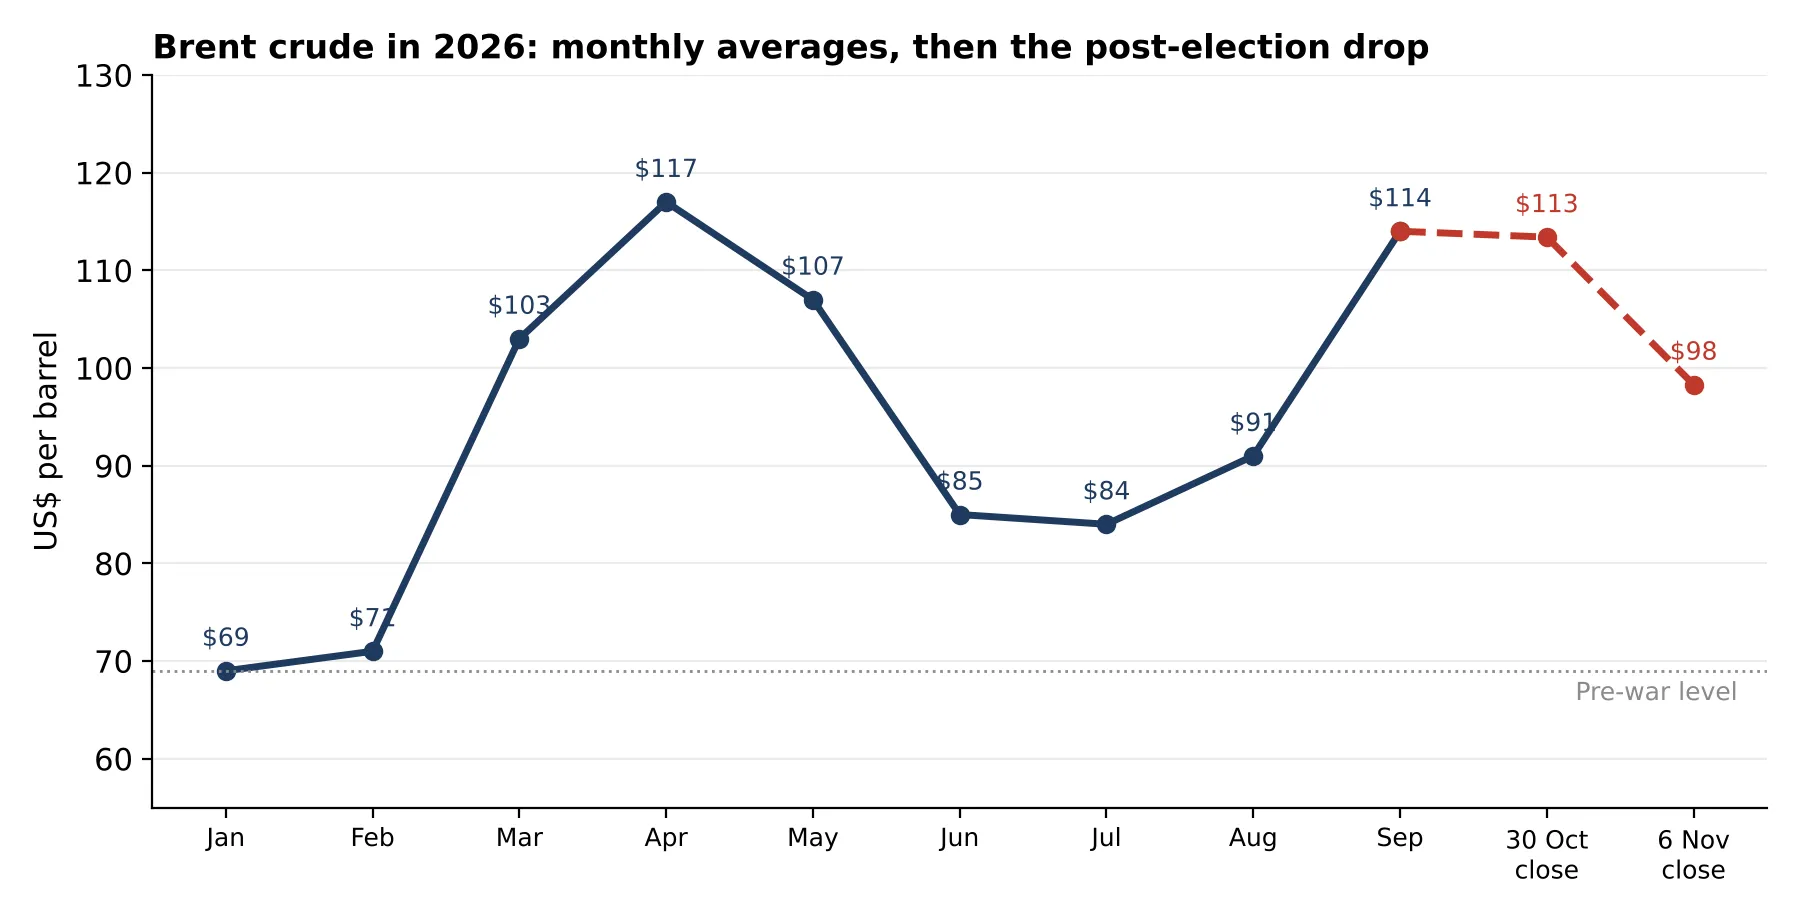
Brent crude ended October at US$113 a barrel. A week later it closed at US$98. The 13% drop was the sharpest weekly fall of 2026, and it came within days of the US midterm elections on 3 November. Over the same days, AI stocks fell hard in New York, Seoul and Taipei, and Indian equities drew their largest single-day foreign inflow in nearly six years.
These moves share a cause. This article explains which part of the oil price has fallen, which part remains, and how that split shapes stock markets, the world economy, and India's economy and markets.
Why did oil fall so sharply after the midterms?
Democrats won control of both the House and the Senate, ending the Republican hold on Congress. Analysts and exit polls read the result as a verdict on the cost of living, which the war with Iran has pushed up since February. On the eve of the vote, President Trump said he had no plans to attack Iran. Iran's president has since said he has wider authority to negotiate, including on issues previously treated as closed. Traders concluded that a deal had become more likely and a renewed military campaign less likely.
Brent's front contract fell from US$113.43 on 30 October to US$98.32 on 6 November. WTI, the US benchmark, fell from US$104 to under US$91. The premium buyers pay for oil delivered next month over the month after, a measure of how urgently refiners need barrels, narrowed from more than US$5 in mid-October to under US$2.50.
Check the macro backdrop
GDP, inflation, rates and more — India’s key economic indicators in one dashboard.
What part of the price has actually come out?
The part that came out is the fear. In late October, Goldman Sachs estimated that about US$27 of Brent's price reflected worry about what might happen next. By its count, the world was producing roughly as much crude as it consumed in September. The post-election drop is largely that premium leaving the price. The physical problems beneath it have changed very little.
Crude is moving again, finished fuel is the bottleneck
Gulf crude exports recovered through October. Saudi Arabia shipped about 7 million barrels a day, above its pre-war level, by routing oil through its pipeline to the Red Sea port of Yanbu. Refined fuels are harder to move. They cannot use crude pipelines, and transferring flammable products between ships at sea is riskier. Several Gulf refineries were also damaged by attacks. Commodity analysts at Kpler expect the region's refineries to return to pre-war output only by mid-2027, which keeps diesel, the fuel for trucks, farms and ships, the tightest part of the market.
Stockpiles leave little room for error
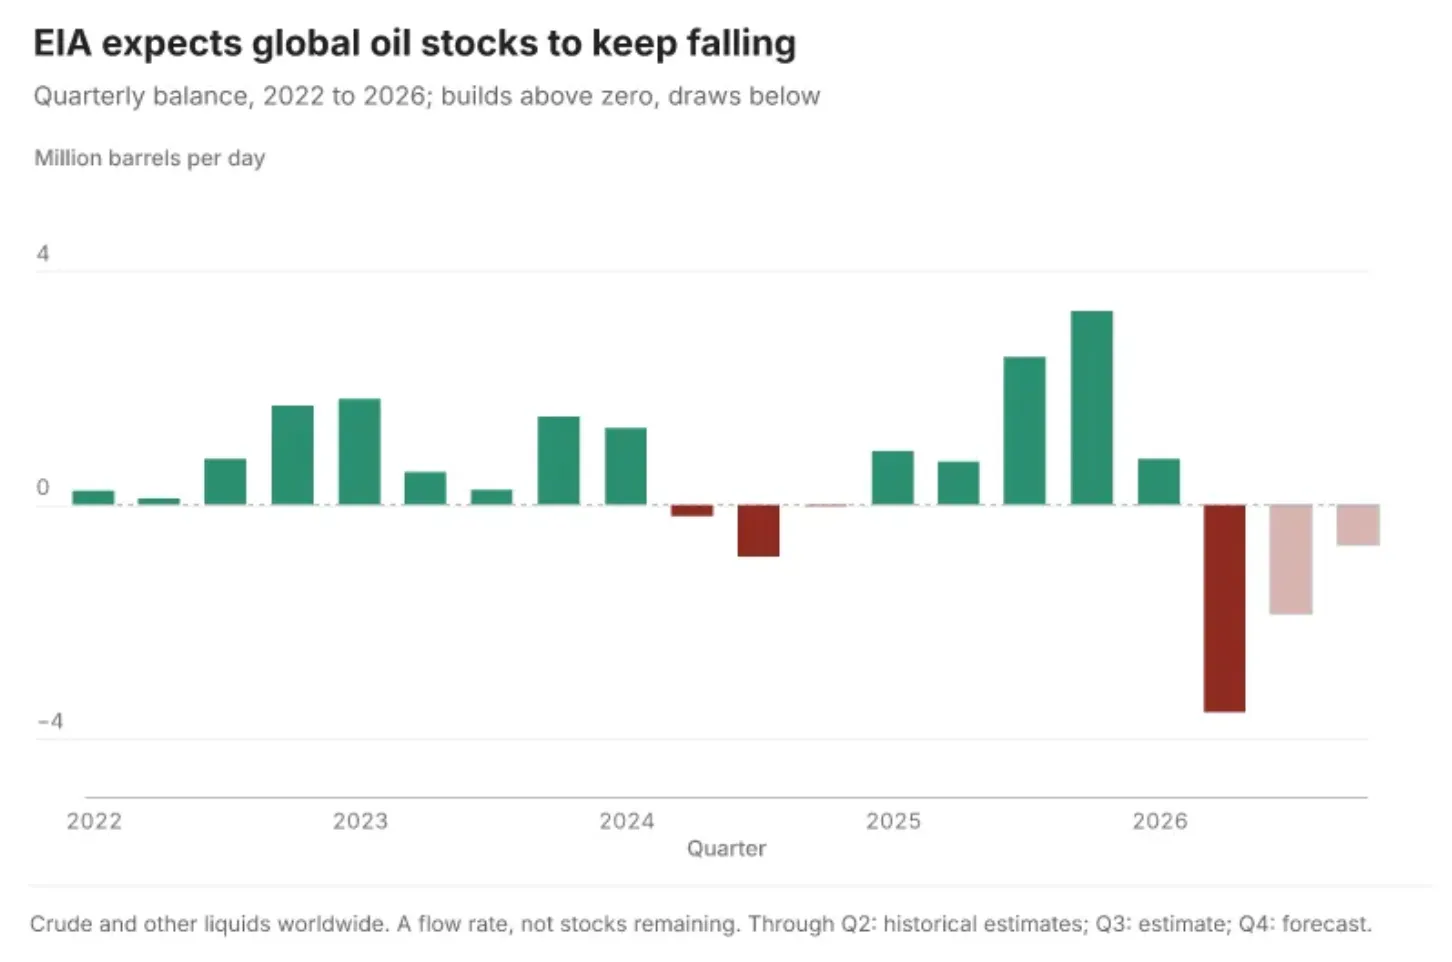
By the end of September, global oil stocks were about 509 million barrels below their February level, and stocks held on land were the lowest since at least 2016, according to the International Energy Agency. China, which eased the market earlier in the year by drawing on its own reserves, has resumed heavy buying. Thin inventories mean each new attack moves prices quickly, and Houthi strikes on Saudi targets and on ships near the Strait of Hormuz continued this week.
Where does the market expect oil to settle?
The futures market treats this as a temporary crunch. Contracts for delivery between 2028 and 2030 traded at roughly US$63 to US$70 in early November. The US Energy Information Administration's October outlook projected Brent averaging US$84 in 2027, falling through the year as Gulf flows normalise. The direction of travel is lower. The speed depends on diplomacy.
Scenario | What happens | Likely effect on Brent |
|---|---|---|
A deal is reached | US and Iran agree terms and Hormuz shipping returns to normal | The remaining fear premium fades; prices then track refinery restarts toward forward-curve levels |
Talks drag on | Negotiations continue alongside periodic attacks on ships and facilities | Volatile trading within the recent range, with thin stocks magnifying each headline |
Strikes resume | Military action restarts after the midterm pause | The premium rebuilds quickly and October's highs come back into view |
Why did AI stocks fall in the same week?
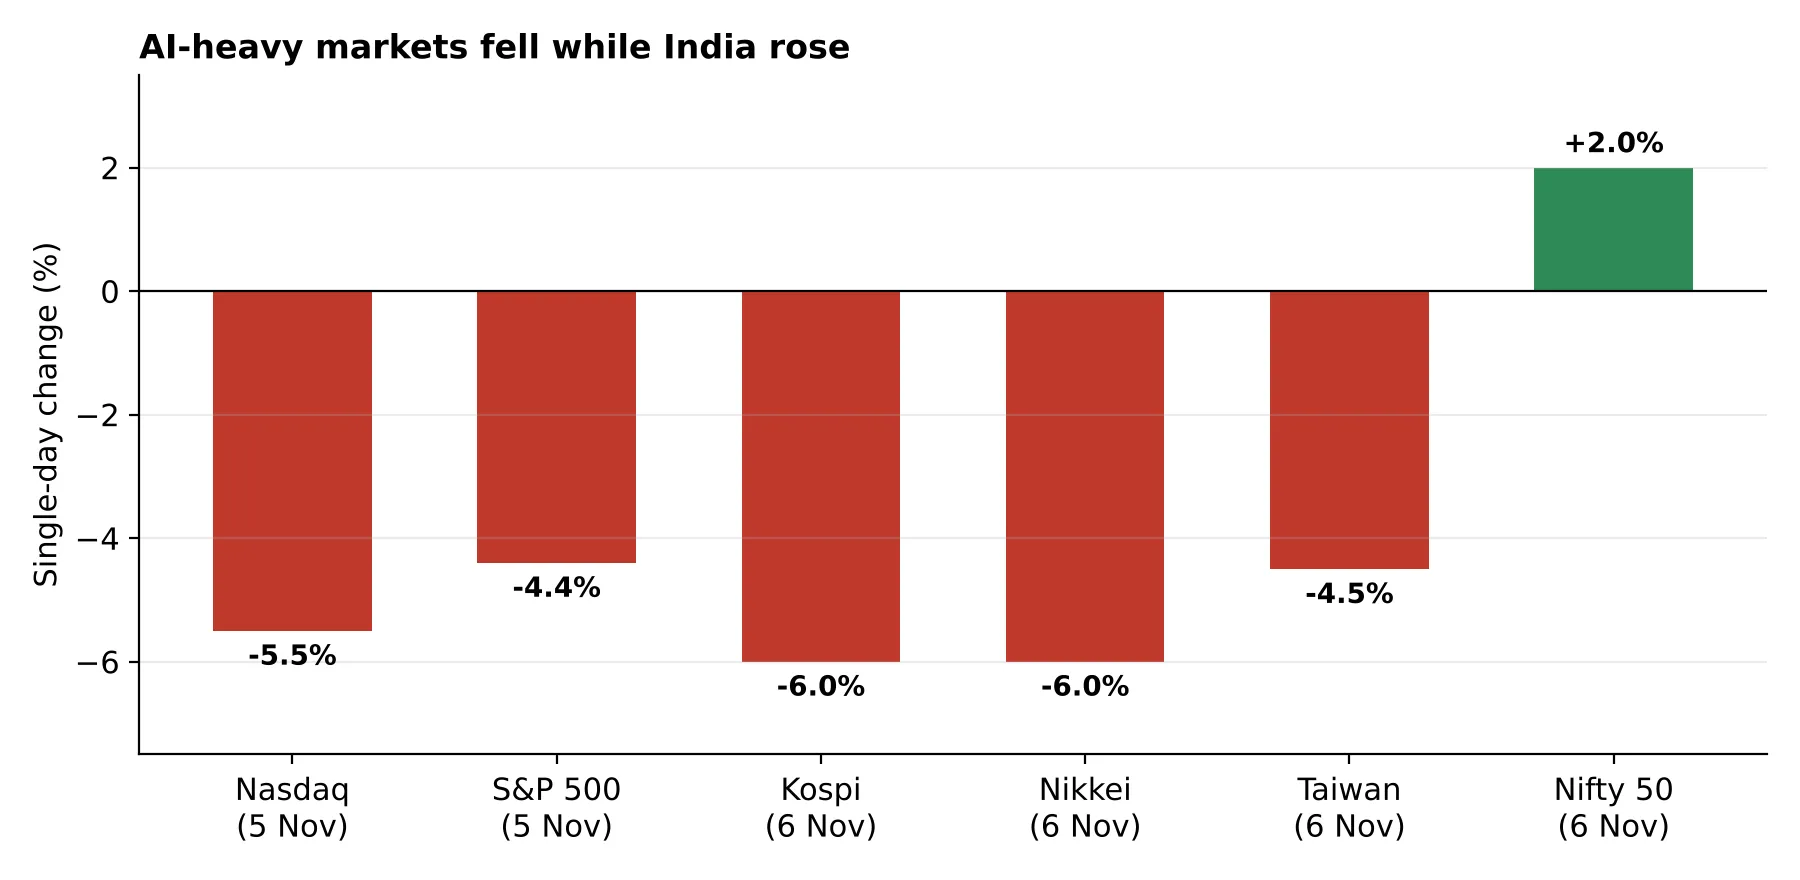
The same election result drove both moves. Democratic control of Congress raises the prospect of tighter AI regulation and closer scrutiny of data centre construction, which depends on land, power and public approvals. The Nasdaq fell 5.5% on 5 November, its worst day since April 2025, and now sits about 12% below its early October high. The Philadelphia semiconductor index has lost about a third from its October high.
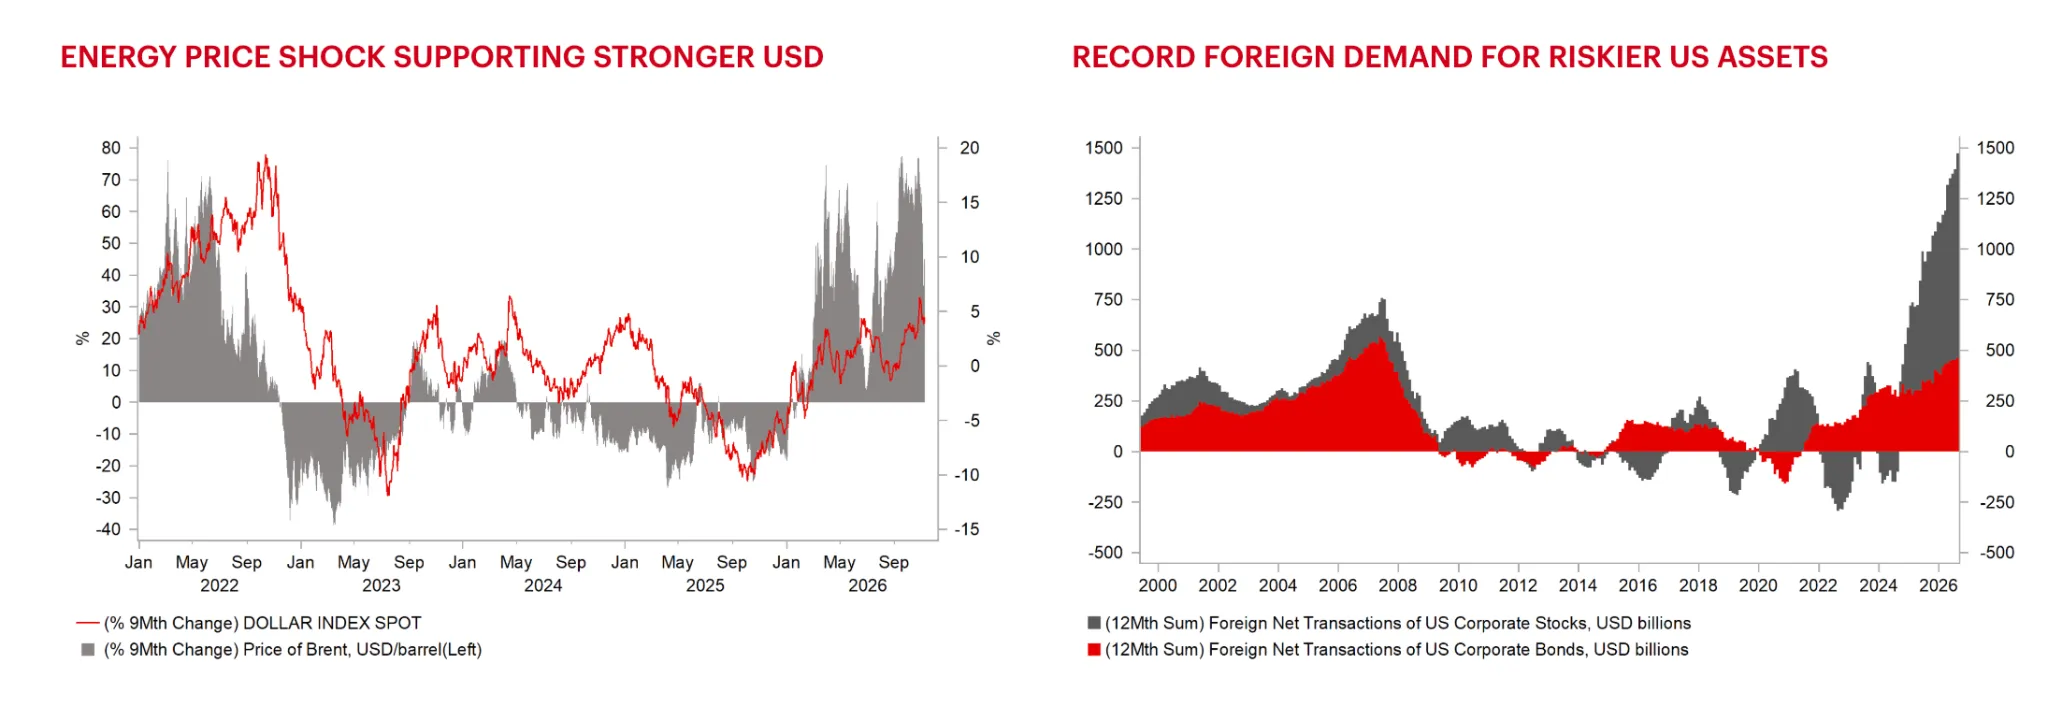
For most of 2026, two forces held up US markets: the energy shock, which pushed money toward the dollar, and the AI trade, which pulled in record foreign buying. Foreign investors bought a net US$1.47 trillion of US stocks and corporate bonds in the year to August. Both forces weakened in the same week. When a crowded trade loses momentum, the money it attracted looks for markets with different drivers.
Get research like this in your inbox
The week’s research that mattered, in five minutes. Joined by 2L+ investors.
How does cheaper oil change the outlook for inflation and interest rates?
Energy has driven this year's inflation cycle. The US Federal Reserve raised rates in September for the first time in this cycle, and the Bank of England raised rates this week. The International Monetary Fund expects global growth of 3.0% in 2026, held back by the oil shock. Lower oil gives central banks room to pause. Bond markets have already responded: the 10-year US Treasury yield has fallen almost half a percentage point since its 7 October peak of 5.36%, and traders have scaled back bets on a December Fed hike.
Oil producers carry the cost. Saudi Arabia's oil revenue fell 37% in the third quarter from the second, and its deficit for the first nine months is already about 50% above its full-year budget. Lower prices widen that gap and could slow spending across Gulf economies, which matters for India through remittances and exports to the region.
Why is foreign money returning to India now?
India spent most of 2026 on the paying side of the AI trade. Global funds wanting AI exposure bought US technology stocks and the chip-heavy markets of Taiwan and South Korea, and India, with few listed AI hardware firms and a large oil import bill, became a source of cash. Foreign investors sold a record US$30 billion of Indian shares through October.
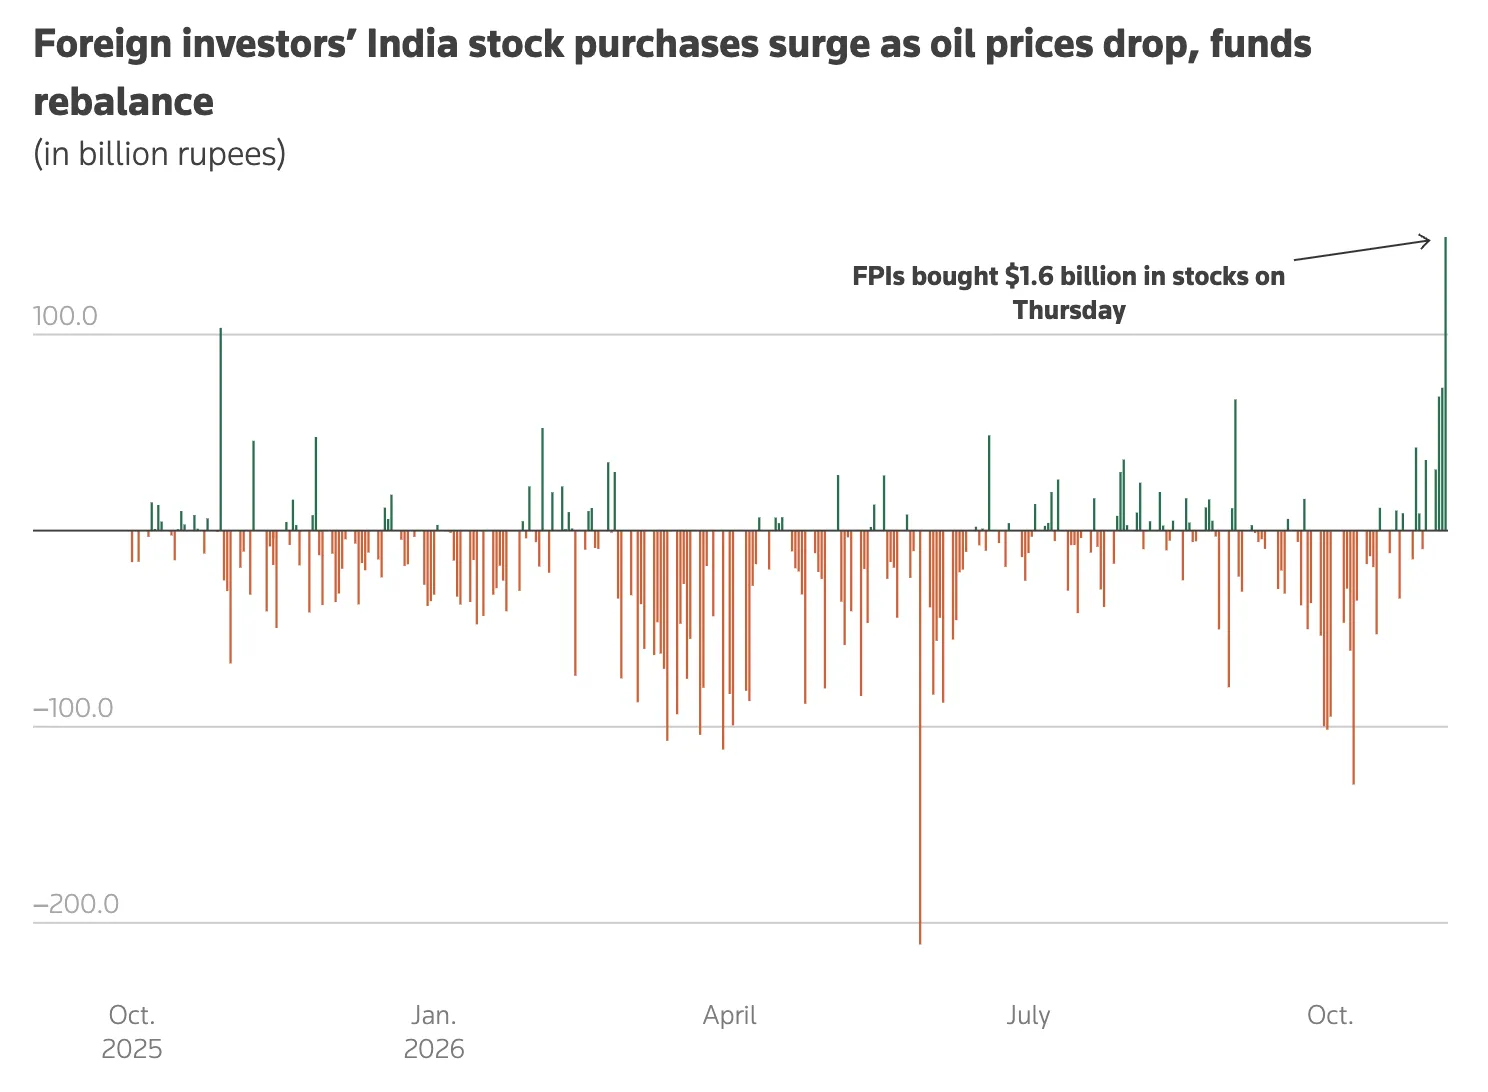
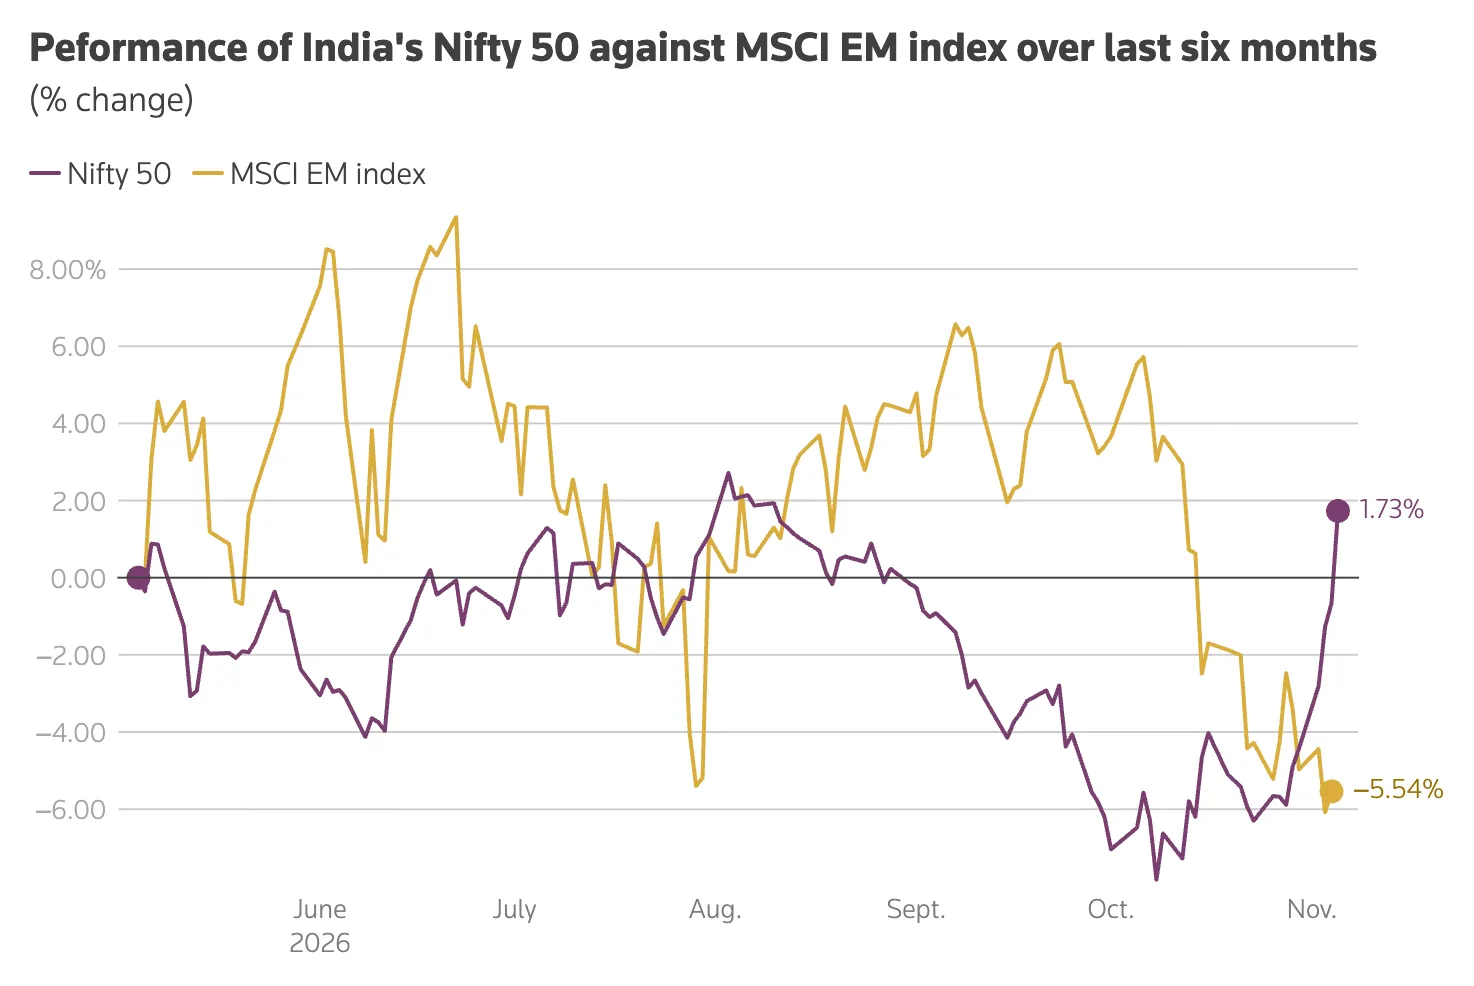
This week reversed both pressures at once. On 5 November, foreign investors bought a net ₹14,796 crore (US$1.6 billion), their largest daily purchase since February 2021. The Nifty 50 closed the week at 25,030, up 8.6%, while South Korea's Kospi and Japan's Nikkei each fell 6% on Friday. The rupee had its best week of the year and closed at 93.91 per dollar, its strongest level since April. Fund managers point to accelerating earnings, below-average valuations and low foreign ownership. India's limited exposure to AI hardware, a drag during the rally, now works as insulation.
Domestic institutions took the other side, selling more than ₹10,000 crore on the day foreigners bought. That split suggests local investors see this as a moment to book profits, and it leaves the durability of the inflow open.
Which parts of India's economy gain first?
India imports close to 90% of its crude. The IMF estimates that every sustained US$10 change in the oil price moves India's current account deficit by about 0.4% of GDP. The Reserve Bank of India's own analysis suggests a 10% fall in crude lowers headline inflation by around 0.2 percentage points. With retail inflation at 5.54% in September, close to the RBI's upper limit of 6%, and the central bank having raised its policy rate by 0.25 percentage points in October, cheaper oil reduces the case for another increase.
Who is affected | Effect of a lower oil price |
|---|---|
State fuel retailers (Indian Oil, BPCL, HPCL) | Losses of about ₹8 to ₹9 per litre on petrol and diesel narrow; retailers are likely to recover losses before cutting pump prices |
Airlines, logistics, paints and chemicals | Fuel and input costs ease; IndiGo's fuel bill rose 67% in the September quarter |
Rupee and the RBI | A smaller import bill supports the currency and reduces pressure for further rate increases |
Government finances | Room to restore excise duty cut earlier in the year or reduce fuel support |
Private refiners (Reliance, Nayara) | Export margins on diesel stay high while Gulf refineries remain impaired, then normalise |
Households | Relief arrives slowly, since pump prices were held down during the spike |
Households will feel the change last. Pump prices were held below cost during the spike, so the first gains flow to state retailers and the government's accounts. Companies with large fuel bills, led by airlines and transport firms, should show the improvement in their December quarter results.
See what markets are pricing in
Live indices, sector moves and market breadth — the backdrop to every story we publish.
What should investors watch from here?
US and Iran talks. A signed agreement removes most of what remains of the fear premium. A resumption of strikes brings it back.
Diesel prices and Gulf refinery restarts. Diesel reflects the physical damage and is the better gauge of how much tightness is left.
US inflation on 10 November and the Fed in December. A softer reading would confirm that cheaper oil is easing the pressure on rates.
Anthropic's listing later this month. A weak debut would extend the rotation out of AI-heavy markets. A strong one could pull money back toward them.
Foreign flows and the rupee. Whether one record day becomes a sustained trend, and whether domestic institutions keep selling into it.
Oil lost most of its fear premium in a single week. What remains in the price reflects damaged refineries and thin stockpiles, and those take months to repair. Further declines depend on a durable settlement in the Gulf. For India, the same week turned two of 2026's headwinds, expensive oil and the AI trade, into tailwinds. How long that lasts depends on both continuing to move in the direction they moved this week.