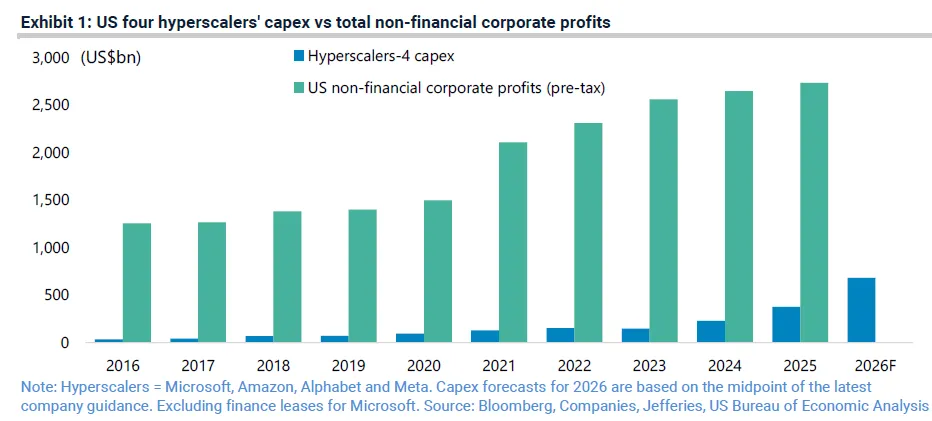
The four largest US hyperscalers, Microsoft, Amazon, Alphabet and Meta, are on track to spend approximately $700 billion on capital expenditure in 2026. That figure could reach $800 billion in 2027 depending on how many additional technology companies are included in the aggregate. This spending is equivalent to roughly 2% of US GDP, 20% of US non-residential fixed investment, and nearly 30% of all pre-tax profits earned by non-financial US companies. The scale is historically unprecedented. The question investors face is whether this cycle can sustain itself, and what happens when it cannot.
How Much Are the Hyperscalers Actually Spending?
The latest earnings season in late April 2026 confirmed that none of the four major hyperscalers plan to reduce AI-related capital expenditure. In fact, three of the four raised their guidance. Microsoft announced it expects to spend $190 billion in capex (including finance leases) this calendar year, with approximately $25 billion attributed to higher component pricing. Alphabet raised its 2026 capex guidance from $175-185 billion to $180-190 billion. Meta increased its range from $115-135 billion to $125-145 billion. Amazon maintained its guidance at $200 billion.
Combined, the four hyperscalers spent roughly $131 billion in Q1 2026 alone. Meta went from $13 billion in Q1 2025 to $20 billion in Q1 2026. Alphabet jumped from $17 billion to $36 billion. Microsoft increased from $17 billion to $31 billion in cash capex. Amazon rose from approximately $25 billion to $44 billion. These are quarterly figures. The year-over-year acceleration is sharp.
Capex as a share of cash flow
The most telling metric is the ratio of capex to operating cash flow. Based on consensus estimates of revenue and operating cash flow, the four US hyperscalers' capex as a percentage of operating cash flow has risen from 41% in 2023 to a projected 92% in 2026.
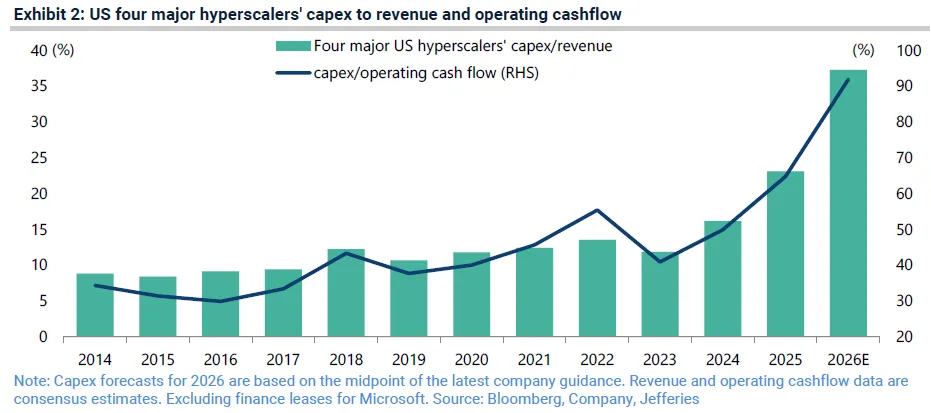
That leaves very little room for other capital allocation priorities, including buybacks and dividends. It also means that any shortfall in revenue growth will directly pressure free cash flow. Amazon, for instance, is projected to generate negative free cash flow in 2026, with Morgan Stanley estimating a deficit of nearly $17 billion. Barclays projects Meta's free cash flow will decline by almost 90% this year.
What Is Driving the Spending?
The bulk of hyperscaler capex is directed at AI compute infrastructure: GPUs, CPUs, memory chips, data centres, and networking equipment. Approximately 75% of aggregate hyperscaler capex in 2026 is allocated to AI-related infrastructure, representing roughly $450 billion in AI-specific spending.
A key detail is the short useful life of many of these assets. Two-thirds of Microsoft's capex in its most recent quarter went to short-lived assets, primarily GPUs and CPUs, which depreciate over three to five years. This creates fast-rising depreciation expenses and immediate operating margin pressure. The Nvidia hardware Microsoft purchases today will require replacement within a few years.
Memory chips are a significant and growing component. Hyperscalers are expected to allocate approximately 28% of their operating cash flow to DRAM this year, assuming memory accounts for 30% of total capex.
Why Do DRAM Makers Hold Unusual Leverage?
The global DRAM market has consolidated from 12 suppliers prior to 2012 to just three: Samsung Electronics, SK Hynix, and Micron Technology. This concentration alone gives the remaining suppliers considerable pricing power. But a structural shift has made this cycle different from previous ones.
Moore's Law has, for practical purposes, ended in DRAM manufacturing. Physical constraints mean that DRAM makers can no longer increase the number of chips on a wafer by 50-100% annually, as they could in previous decades. This creates a fundamental supply constraint that did not exist before. The result is that large buyers of DRAM, including Nvidia and hyperscalers, are now committing to three-to-five-year supply agreements with DRAM makers. Without these commitments, the DRAM manufacturers will not expand capacity.
This dynamic resembles the TSMC model, where capital spending follows concrete, contractually backed demand rather than speculative capacity expansion. It should, in theory, prevent the traditional boom-bust cycle that has characterised the memory industry for decades. The risk, however, remains that hyperscalers could suddenly conclude they have overinvested, triggering a demand contraction.
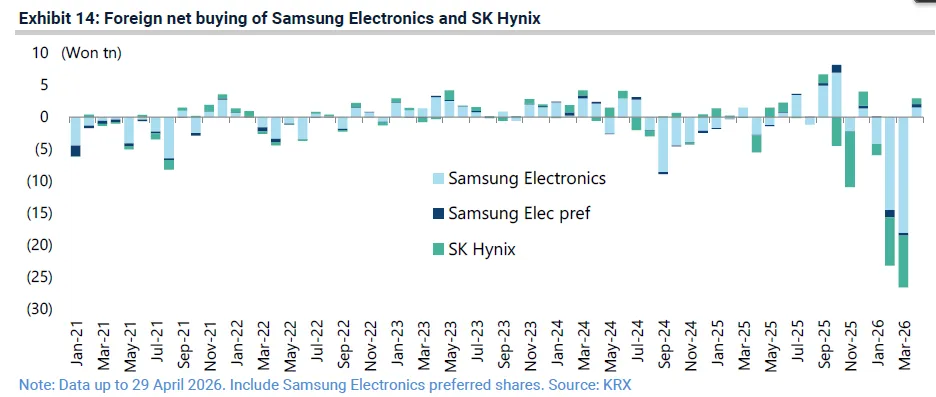
Foreign investors have been net sellers of Samsung Electronics and SK Hynix year-to-date, selling a net 52.9 trillion won despite both stocks trading at all-time highs. Foreign ownership of Samsung Electronics common shares declined from 52.3% at the end of 2025 to 49.2% as of late April 2026. SK Hynix foreign ownership fell from 53.8% to 53.0% over the same period.
Read our detailed analysis of AI’s New Bottleneck: Global Memory Chip Squeeze .
Is AI Generating Enough Revenue to Justify This Spending?
The monetisation question remains the central tension in the AI investment cycle. Alphabet, Microsoft, and Amazon benefit from AI spending through their cloud computing divisions, which report strong revenue growth. Google Cloud grew 63% year-over-year to approximately $20 billion in Q1 2026. AWS revenue came in at $37.59 billion, growing 28% year-over-year, its fastest pace in 15 quarters. Microsoft's AI run rate climbed past $37 billion. Meta, however, lacks a cloud revenue stream, which is why investors have expressed more concern about its capex trajectory than the others.
Jefferies' base case is that AI will resemble the capex-intensive airline industry more than the winner-takes-all network effects of the internet economy. A related Jefferies research note published in late April 2026 argued that the challenges facing AI business models remain underestimated, and that rising compute, memory, and power costs will likely mean sustainable profitability is far away for pure model players.
Shifting competitive dynamics among AI companies
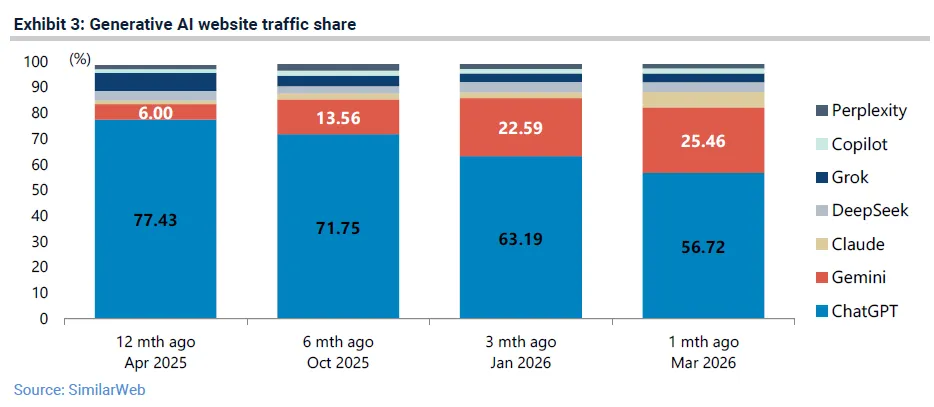
The competitive landscape among AI model providers is shifting rapidly. OpenAI has lost consumer market share to Google's Gemini, whose web traffic share in the generative AI market increased from 6% to 25.5% over the 12 months to March 2026, according to SimilarWeb. ChatGPT's share declined from 77.4% to 56.7% over the same period. A Wall Street Journal report in late April noted that OpenAI missed an internal goal of reaching 1 billion weekly active users by the end of 2025 and has missed multiple monthly revenue targets in early 2026 after losing ground to Anthropic in coding and enterprise markets.
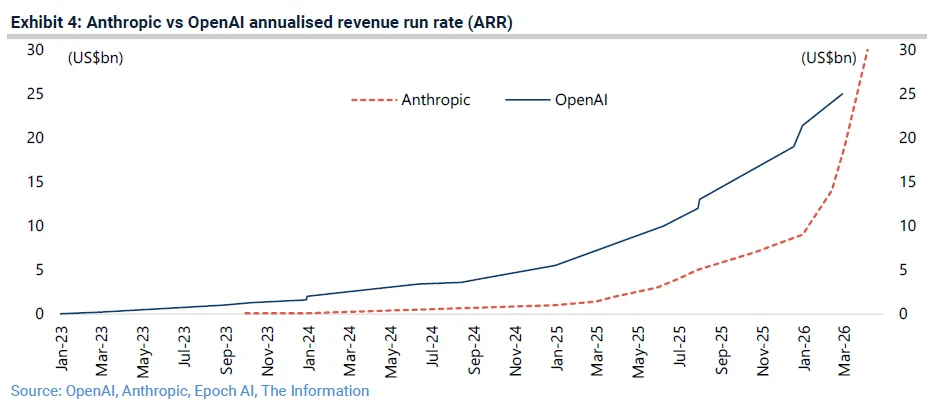
Anthropic reported in early April 2026 that its annualised revenue run rate surpassed $30 billion, up from approximately $9 billion at the end of 2025. OpenAI's annualised revenue run rate topped $25 billion in February 2026. The crossover between the two companies' revenue trajectories, which Epoch AI had projected for mid-2026, appears to be materialising.
How Does China's AI Model Ecosystem Fit In?
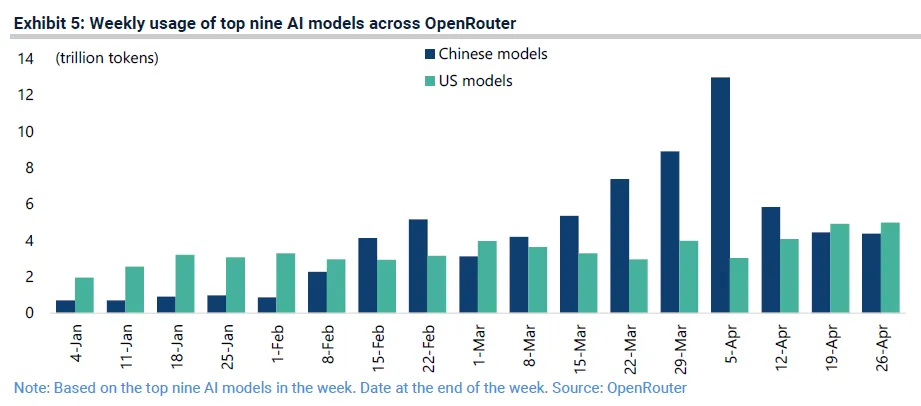
China's open-source AI models represent a growing competitive force. The launch of DeepSeek V4 on 24 April 2026 underscored this trend. Data from the aggregator platform OpenRouter shows that China AI models processed 4.37 trillion tokens in the week ended 26 April, compared with 4.98 trillion for US models, based on usage of the top nine models. In the week ended 5 April, Chinese models processed a record 12.96 trillion tokens, while US models processed only 3.03 trillion. US users account for nearly half of the platform's user base.
China is packaging its reserves of cheap energy and computing power to serve as a global token processor. It ranked as the world's sixth-largest exporter of digitally-delivered services in 2025, up from 17th in 2005. China's exports of digitally-delivered services have grown at an annualised 15.2% over the past 20 years, from $14.4 billion in 2005 to $245 billion in 2025.
What Geopolitical Risks Could Disrupt This Cycle?
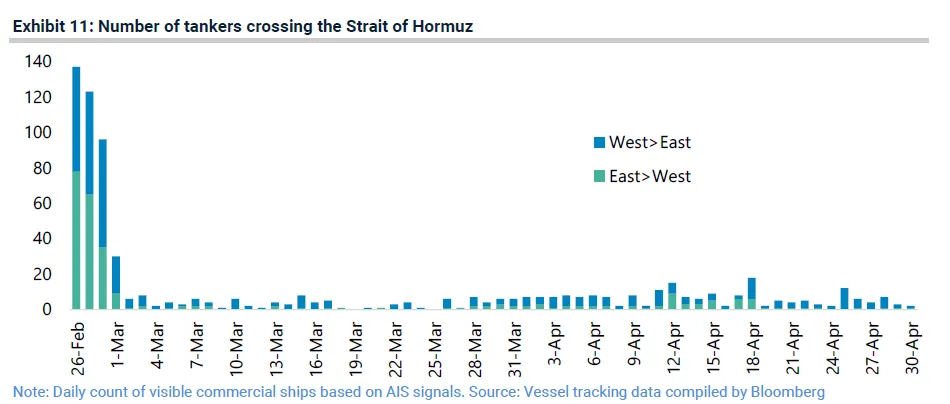
The Iran conflict and the disruption to the Strait of Hormuz represent a significant macro risk to the global economy. The number of tankers crossing the Strait of Hormuz declined from 137 on 26 February to an average of just 2 over a recent 5 day period.
Half of the world's seaborne sulphur trade passes through the Strait, along with 34% of crude oil, 29% of liquefied petroleum gas, 19% of LNG and refined oil products, 13% of chemicals including fertilisers, and 7% of aluminium, according to the World Bank. The UAE's decision to exit OPEC on 1 May marked a historic shift in Gulf State dynamics, after 59 years of membership.
Oil prices have returned to their highest level since June 2022, and the US 10-year Treasury bond yield sits just 12 basis points below the 4.5% threshold. Rising energy costs feed directly into the economics of AI infrastructure, where power consumption is a significant and growing cost component for data centre operators. Any sustained disruption to energy markets would compound the cash flow pressure hyperscalers already face.
What Could Signal a Turning Point?
The Federal Reserve held rates steady at its April meeting, Jerome Powell's last as chairman. The meeting featured the greatest registered dissent since 1992. With the 10-year yield approaching 4.5% and oil at multi-year highs, the fiscal and monetary environment is tightening around the AI capex cycle at the same time that hyperscalers are deploying historically unprecedented levels of capital.
The indicators to watch are: the capex-to-cash-flow ratio crossing 100% for any individual hyperscaler; sustained declines in cloud revenue growth rates; a reversal in DRAM supply agreements if demand softens; and any widening of credit spreads on Gulf state sovereign bonds, which would signal markets pricing in genuine geopolitical disruption.
The AI capex cycle is the largest concentrated infrastructure build in technology history. It is being funded by companies whose cash flows are being stretched to their limits, in a geopolitical environment that adds energy cost risk, and in the absence of proven AI business models at the scale required to justify the investment. The spending continues because no major player can afford to fall behind. Whether that logic holds through 2027 and beyond will define the next phase of global technology markets.
About the author

Our Investment Philosophy
Learn how we choose the right asset mix for your risk profile across all market conditions.
Subscribe to our Newsletter
Get weekly market insights and facts right in your inbox