A commodity supercycle is a prolonged period, typically lasting 15 to 30 years, during which commodity prices remain well above their long-term trend. It is driven by structural shifts in supply and demand rather than short-term speculation. In 2026, multiple forces have converged to trigger what many economists and investors now identify as the early phase of a new supercycle. The 2026 Iran war and the effective closure of the Strait of Hormuz have produced the largest oil supply disruption in the history of global energy markets, according to the International Energy Agency. At the same time, a decade of underinvestment in mining and energy exploration has left supply chains unable to respond to rising demand from AI infrastructure, the energy transition, and defence spending.
The result is a broad-based commodity price surge. Oil has climbed from $60 per barrel in January to above $110 in May. Gold hit a record $5,405 per ounce in Q1. Copper faces a structural deficit projected at 150,000 to 304,000 tonnes in 2026. Fertiliser, natural gas, and base metals are all elevated. The World Bank forecasts overall commodity prices to rise 16% in 2026, with energy prices up 24%. This article examines the structural forces behind the supercycle, its consequences for global economies, and the counterarguments that investors should weigh.
What Is Driving the 2026 Commodity Supercycle?
Three structural forces are converging simultaneously: a geopolitical supply shock in energy markets, chronic underinvestment in commodity production capacity, and rapidly accelerating demand from new industrial sectors.
The Energy Shock
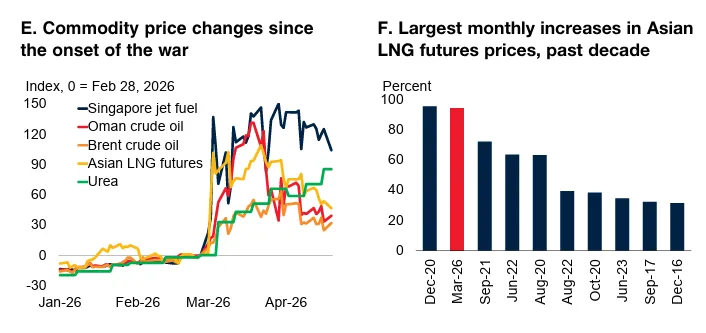
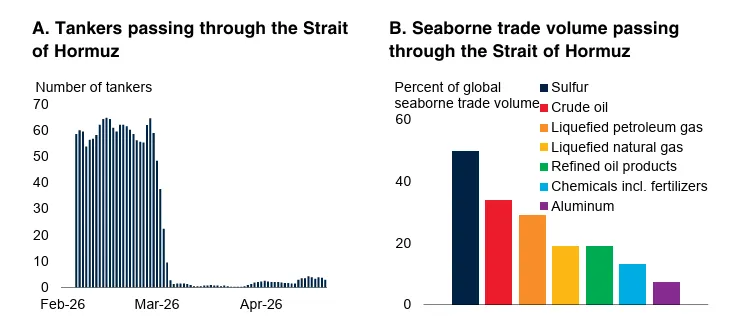
The 2026 Middle East conflict has disrupted energy supplies on a scale that exceeds the 1973 Arab oil embargo and the 2022 Russia-Ukraine shock in terms of barrels taken off the market. The Strait of Hormuz, through which roughly 20% of the world's oil trade passes, has been effectively closed since March 2026. The IEA has characterised this as the largest supply disruption in the history of global oil markets. Brent crude surged from around $72 per barrel on February 27, when the conflict began, to nearly $120 at its peak. As of mid-May, it has settled near $111.
The disruption extends beyond crude oil. Natural gas flows, fertiliser supplies, and aviation fuel have all been affected. Bank of America economists have described the situation as an energy shock rather than an oil shock, given its breadth. The IEA estimates the global oil market will fall 1.78 million barrels per day short of demand throughout 2026 unless the conflict resolves quickly. Governments have already released over 400 million barrels from strategic reserves in a coordinated emergency response, yet prices remain elevated.
A Decade of Underinvestment
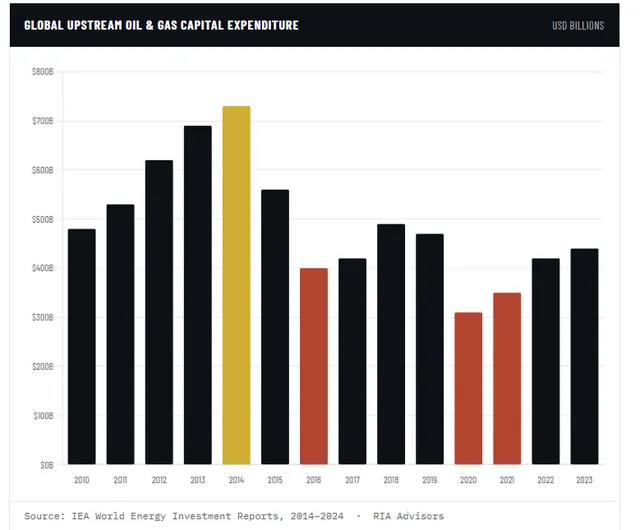
The supply-side constraints predate the war. After commodity prices peaked around 2011, mining and energy companies entered a prolonged period of capital discipline. Exploration budgets were cut, new project approvals slowed, and ESG-related constraints further limited investment in fossil fuel and mining capacity. This decade of underinvestment has left commodity markets structurally tight, with long project lead times meaning new supply will take years to materialise.
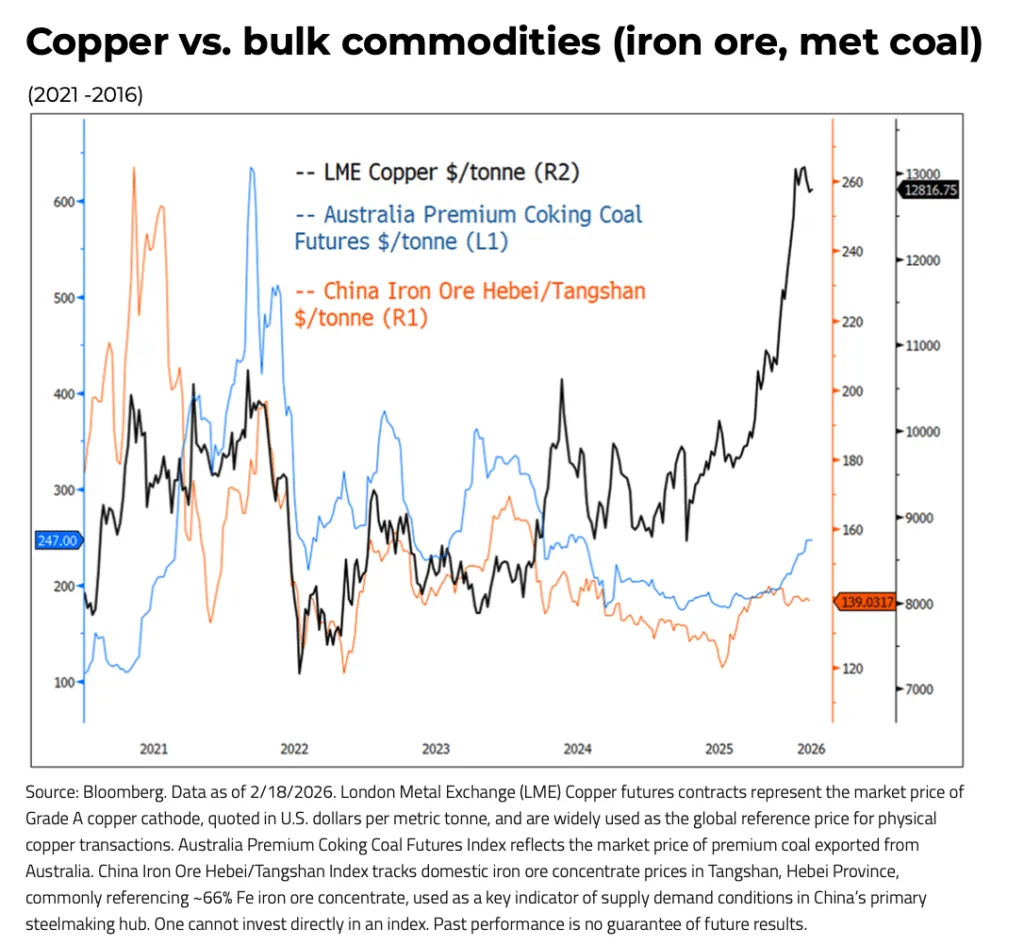
Copper illustrates the problem clearly. The International Copper Study Group projects a 150,000-tonne structural deficit in 2026, reversing earlier surplus forecasts. A 304,000-tonne refined copper deficit, driven by declining ore grades, mine disruptions in Chile and Indonesia, and permitting delays. These are not problems that resolve in a single quarter.
New Demand from AI, Energy Transition, and Defence
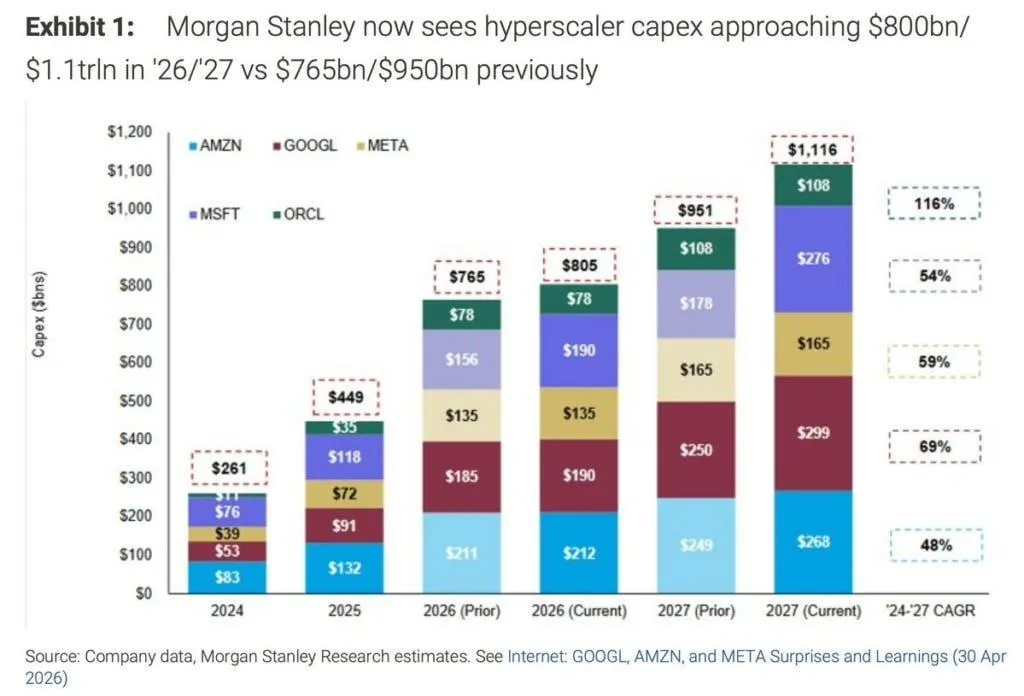
The demand side is equally significant. The explosive growth of AI data centres and hyperscaler capex requires vast quantities of copper, rare earths, and electricity.
The energy transition, including electric vehicles, grid expansion, and renewable energy infrastructure, is adding material-intensive demand on top of traditional industrial consumption. The World Bank notes that base metals including aluminium, copper, and tin are expected to reach all-time highs in 2026, reflecting strong demand from data centres, EVs, and renewables. Defence spending across NATO and allied nations has also increased, adding further demand for industrial metals.
How Are Commodity Prices Responding?
The price response has been broad and sharp. The table below summarises key commodity price movements in 2026.
Commodity | Jan 2026 | May 2026 | Change |
Brent Crude Oil | ~$60/barrel | ~$111/barrel | +85% |
Gold | $4,400/oz | $5,405/oz (peak) | +23% |
Copper | Surplus expected | 150k-304k tonne deficit | Structural shift |
Overall Commodities | Baseline | +16% (World Bank) | +16% forecast |
Precious Metals (avg) | Baseline | +42% (World Bank) | +42% forecast |
Gold deserves particular attention. Gold prices set a new quarterly average record of $4,873 per ounce in Q1 2026. Central banks purchased 244 tonnes of gold on a net basis in Q1, up 3% year-on-year, according to the World Gold Council. China alone accounted for a record 207 tonnes in bar and coin purchases during Q1, surpassing the previous quarterly record. Goldman Sachs forecasts gold at $5,400 per ounce by end-2026. J.P. Morgan expects around 755 tonnes of central bank gold purchases for the year, lower than the 1,000-plus tonne pace of 2022-2024, but still well above pre-2022 averages of 400 to 500 tonnes.
What Is Stagflation, and Why Does It Matter Now?
Stagflation describes an economic environment in which inflation rises while economic growth slows, a combination that leaves policymakers with poor options. Raising interest rates to fight inflation risks deepening a slowdown. Cutting rates to support growth risks accelerating price increases.
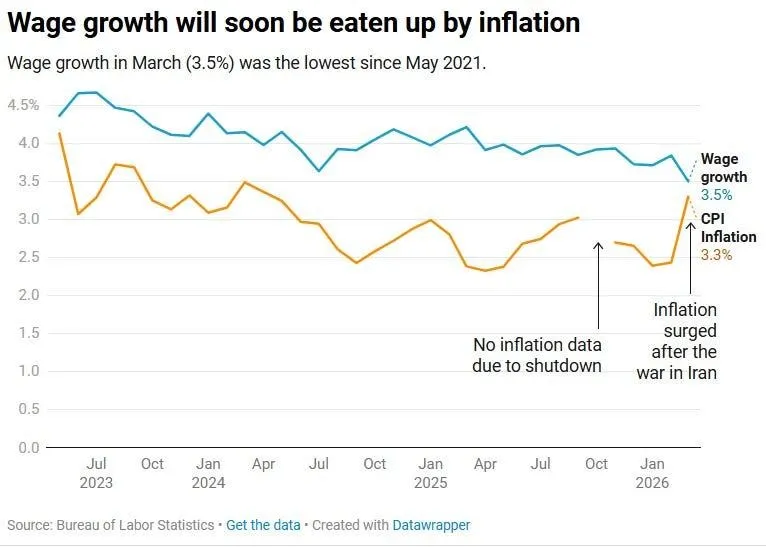
The U.S. consumer price index rose at an annual rate of 3.8% in April 2026, driven primarily by the energy shock. Core CPI, excluding food and energy, increased by 0.4% on the month and 2.8% annually. Services inflation surged 0.6% in April, rising 3.4% year-on-year. Inflation in US could peak at or above 4.5%, and U.S. GDP growth forecast for 2026 could fall from 2.4% to 1.7%. Bank of America forecasts 3.6% U.S. inflation alongside 2.3% growth. Citi estimates that if Brent reaches $120 for the year, global growth could fall to 1.5% to 2%.
The Federal Reserve faces a dilemma. The incoming Fed Chair Kevin Warsh inherits a supply shock that monetary policy is poorly equipped to address. The rate cut bias will likely be removed from the Fed's June policy statement, and rate hikes may follow if the conflict persists into the second half of the year.
How Does This Affect Emerging Economies?
India: A Case Study in Oil Vulnerability
India imports approximately 88% to 89% of its crude oil requirements, making it acutely sensitive to global price swings. The Indian basket of crude oil reached $115 per barrel in April 2026 and $106 in May. Every $10 per barrel increase in oil prices widens India's current account deficit by an estimated 0.4 to 0.5 percentage points of GDP. The rupee briefly weakened to around 92.40 per dollar in March 2026. Higher import bills, widening trade deficits, and currency depreciation create a self-reinforcing pressure cycle that is difficult to break without either central bank intervention or demand compression.
The Asian Development Bank, in its April 2026 update, highlighted the cascading effects: higher oil pushes up transport costs, which flow into food prices, which erode real wages, which dampen consumer demand. The World Bank projects inflation in developing economies to average 5.1% in 2026, a full percentage point higher than expected before the war. For countries like India, PM Narendra Modi has publicly warned of a potential return of poverty driven by overlapping global crises including COVID aftershocks, ongoing wars, and the energy crisis.
Europe's Recession Risk
Europe is the most vulnerable developed region. The continent relies heavily on Middle Eastern energy and already faces 3% inflation with barely 0.1% quarterly growth. Germany calculates a 34% recession probability in Q2 2026 if energy prices remain elevated. Asia imports 80% of Gulf oil exports and is contending with simultaneous energy shortages, currency volatility, and wage pressures.
Is the 1970s Comparison Valid?
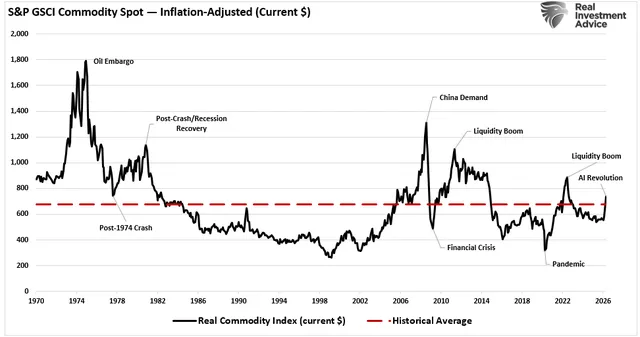
The commodity supercycle narrative draws heavily on the 1970s stagflation period, when oil embargoes, surging commodity prices, and wage-price spirals produced a decade of painful inflation. Gold moved from $35 to over $800 per ounce, and equities went nowhere in real terms. The comparison is instructive but limited.
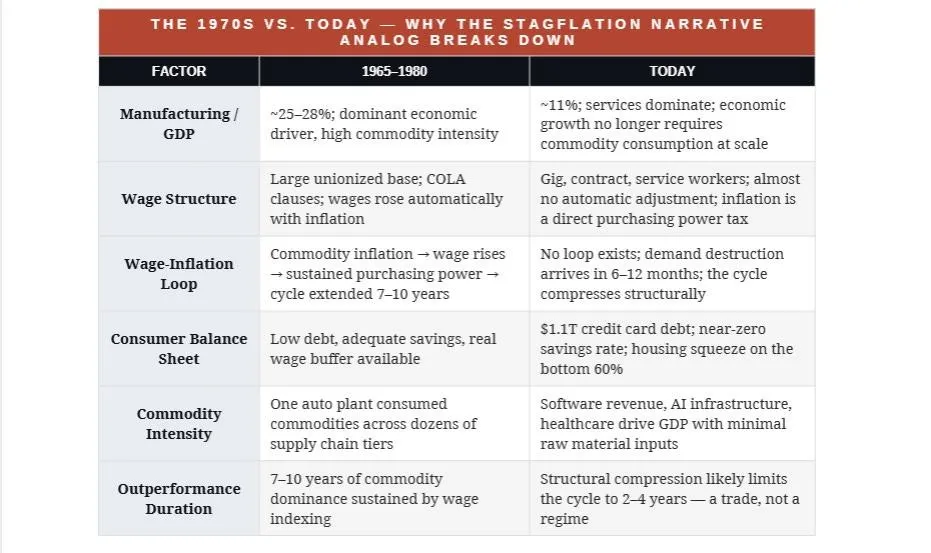
As Lance Roberts of Real Investment Advice argues, the U.S. economy in the 1970s was roughly 25% to 28% manufacturing, with a large unionised workforce that had cost-of-living adjustment (COLA) clauses in labour contracts. When commodity prices rose, wages rose automatically, sustaining purchasing power and extending the inflationary cycle for years.
Today, the U.S. economy is 70% to 75% services, manufacturing is approximately 11% of GDP, and the COLA-adjusted workforce has largely disappeared. When commodity prices rise today, the increase functions as a direct tax on purchasing power. Consumers absorb the cost immediately, and demand destruction arrives within six to twelve months rather than over several years.
This structural difference means the current commodity cycle will likely follow a different sequence: prices rise, consumers and businesses pull back, growth slows, the Fed eventually pivots, and bond prices recover. The same event that terminates the commodity rally launches the bond recovery. Roberts notes that this exact sequence played out in compressed form between 2022 and 2024, when commodities surged on the Russia-Ukraine shock before correcting as growth wobbled and the Fed adjusted course.
What Should Investors Consider?
The commodity supercycle thesis rests on legitimate structural inputs: supply inelasticity, dollar headwinds, central bank gold accumulation, and AI-driven demand for industrial metals. The question for investors is how to size and time exposure, given that commodity cycles are inherently boom-bust in nature.
The World Bank's April 2026 Commodity Markets Outlook provides a useful framework. Under its baseline scenario, energy prices rise 24% and overall commodities 16%. Under a downside scenario where infrastructure damage is severe and recovery is slow, Brent could average $115 for the year, with inflation in developing economies rising to 5.8%. Oil price volatility during geopolitical conflict is roughly twice as high as during calmer periods, and a geopolitically driven 1% decline in global oil production typically pushes prices up by 11.5%. These are significant numbers that warrant allocation adjustments.
At the same time, the doomer version of the supercycle thesis, which advocates selling all equities and going all-in on commodities, ignores the boom-bust nature of commodity markets and the structural differences between today's economy and the 1970s. A disciplined approach would involve selective commodity exposure (particularly in supply-constrained metals like copper and uranium), maintaining bond allocations as an eventual beneficiary of the growth slowdown phase, and recognising that gold's role has shifted from ornament to reserve asset.
Where Does This Go From Here?
The trajectory of the supercycle depends heavily on the duration of the Middle East conflict and the pace of supply-side investment. If the Strait of Hormuz remains closed through June, analysts project oil could exceed $150 per barrel. If a ceasefire holds and infrastructure rebuilds, prices will moderate, though structural underinvestment ensures they remain above pre-war levels for an extended period.
The IMF has cut its 2026 global growth forecast to 3.1%, down 0.2 percentage points from its previous projection. If energy volatility persists into 2027, the IMF warns of a severe scenario where global growth could fall to 2%. For central banks, the challenge is acute: the Federal Reserve, the European Central Bank, and the Reserve Bank of India are all navigating the same impossible trade-off between inflation control and growth support.
The commodity supercycle is real. The structural forces behind it, including underinvestment, geopolitical fragmentation, and material-intensive technological change, will persist for years. The question is whether investors and policymakers treat it as a permanent state or a phase within a sequence. History suggests it is a phase, but one that can cause significant economic damage before it resolves.
About the author

Our Investment Philosophy
Learn how we choose the right asset mix for your risk profile across all market conditions.
Subscribe to our Newsletter
Get weekly market insights and facts right in your inbox