

India's consumer market spans daily staples, packaged foods, beverages, personal care and household products. These businesses can generate repeat purchases and strong cash flow, but they are not automatically low-risk investments. Valuation, raw-material inflation, distribution shifts and changing consumer preferences can materially affect returns from FMCG stocks in India.
This guide maps the listed universe as of November 2026. It is a research list, not a ranking or recommendation. Market capitalisation, index weights and financial metrics change, so investors should verify the latest exchange filings before acting.
FMCG Stocks in India: Company List
The table groups prominent listed companies by their main consumer exposure. Several have businesses outside classic FMCG, so segment reporting matters.
| Company | Main listed exposure | Research focus |
|---|---|---|
| Hindustan Unilever | Home care, beauty, personal care and foods | Volume growth, premiumisation, advertising and margin |
| ITC | Cigarettes, packaged foods, personal care, agri and paper | Segment mix, taxation and FMCG profitability |
| Nestlé India | Foods, nutrition, beverages and confectionery | Pricing power, volume, capacity and commodity costs |
| Britannia Industries | Biscuits, bakery and dairy | Flour, sugar and dairy costs; distribution and mix |
| Tata Consumer Products | Tea, coffee, foods and convenience portfolio | Integration, innovation and international mix |
| Varun Beverages | Beverage bottling and distribution | Case volume, territory growth, seasonality and capex |
| Godrej Consumer Products | Home care, personal care and international markets | India volume, overseas turnaround and margins |
| Dabur India | Healthcare, personal care, foods and beverages | Rural demand, seasonality and portfolio premiumisation |
| Marico | Hair oils, edible oils, foods and international business | Copra and edible-oil costs, volume and new categories |
| Colgate-Palmolive India | Oral care and personal care | Category penetration, market share and ad spending |
| United Spirits | Alcoholic beverages | Premium mix, regulation and input costs |
| United Breweries | Beer | Volume, state regulation, pricing and capacity |
| Patanjali Foods | Edible oils and foods | Commodity exposure, branded mix and working capital |
| Emami | Personal care and healthcare | Seasonal portfolio, rural demand and brand investment |
| Jyothy Labs | Fabric care, dishwashing and personal care | Regional strength, distribution and margin execution |
Use the Wright Research stocks platform to research this wider FMCG stocks list. The table is broader than a single index and includes businesses with different margins, regulation and growth drivers.
See what markets are pricing in
Live indices, sector moves and market breadth — the backdrop to every story we publish.
What Qualifies as an FMCG Stock?
Fast-moving consumer goods are non-durable, mass-consumption products purchased frequently and available off the shelf. Typical categories include packaged foods, beverages, soaps, detergents, toothpaste, cosmetics and household products. They usually have relatively low unit prices and depend on broad distribution.
Consumer durables such as appliances, electronics and furniture last for years and have less frequent purchase cycles. Retailers and e-commerce platforms sell FMCG products but are classified by their distribution model rather than by manufacturing the goods. Restaurants and hotels also serve consumers but do not fit the classic definition.
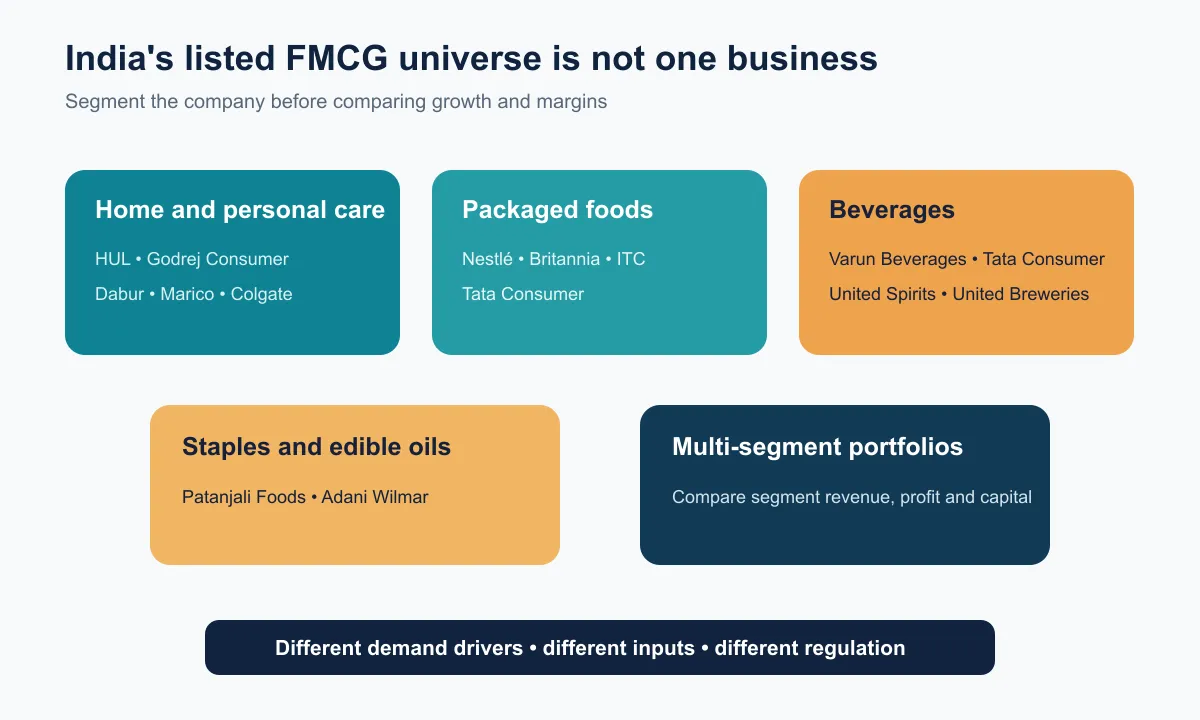
The boundary is not perfect. ITC combines consumer products with cigarettes and other operations; Patanjali Foods combines branded products with commodity-sensitive edible oils; beverage companies face product-specific regulation. A useful FMCG shares in India screen should therefore identify revenue and profit by segment rather than relying on a company label.
FMCG Companies by Product Segment
Different categories among FMCG companies in India respond to different demand and cost drivers.
| Segment | Representative companies | Demand driver | Major input exposure |
|---|---|---|---|
| Home and fabric care | HUL, Godrej Consumer, Jyothy Labs | Household penetration and premium formats | Palm derivatives, chemicals and packaging |
| Personal and oral care | HUL, Colgate, Dabur, Emami, Marico | Brand, innovation and per-capita use | Oils, chemicals, fragrances and packaging |
| Packaged foods | Nestlé India, Britannia, Tata Consumer, ITC | Convenience, distribution and premiumisation | Wheat, milk, sugar, cocoa and edible oils |
| Non-alcoholic beverages | Varun Beverages, Tata Consumer, Dabur | Weather, out-of-home use and distribution | Sugar, fruit inputs, PET and energy |
| Alcoholic beverages | United Spirits, United Breweries, Radico Khaitan | Premiumisation and state-level demand | Grain, glass, barley and regulation |
| Edible oils and staples | Patanjali Foods, Adani Wilmar | Branded conversion and household demand | Imported oils and commodity spreads |
This segmentation explains why FMCG companies in India do not move together. Falling palm-oil prices may help soap makers, while weak copra prices have a different effect on hair-oil economics. Alcoholic beverages face state taxes and route-to-market restrictions not shared by toothpaste or biscuits.
FMCG Stocks by Market Capitalisation
Market capitalisation changes every trading day, so fixed numerical rankings become stale quickly. A practical 2026 framework separates large established franchises from mid-sized category specialists and smaller emerging businesses.
Large-cap names commonly include HUL, ITC, Nestlé India, Varun Beverages, Britannia and Tata Consumer Products. Godrej Consumer, Dabur, Marico, Colgate-Palmolive India and major alcoholic-beverage companies often form the next group, depending on prevailing prices. Smaller companies may offer faster growth but can carry narrower brands, lower liquidity and greater input-cost volatility.
Investors comparing the top FMCG stocks in India should not equate size with expected return. Large companies may have distribution, brand and balance-sheet advantages, while demanding valuations can limit upside. Smaller FMCG sector stocks may scale faster, but execution errors can have a larger effect.
Use a dated market-cap screen from Wright Research's stock index lists rather than copying an old ranking. Record free float as well as total market value when considering liquidity.
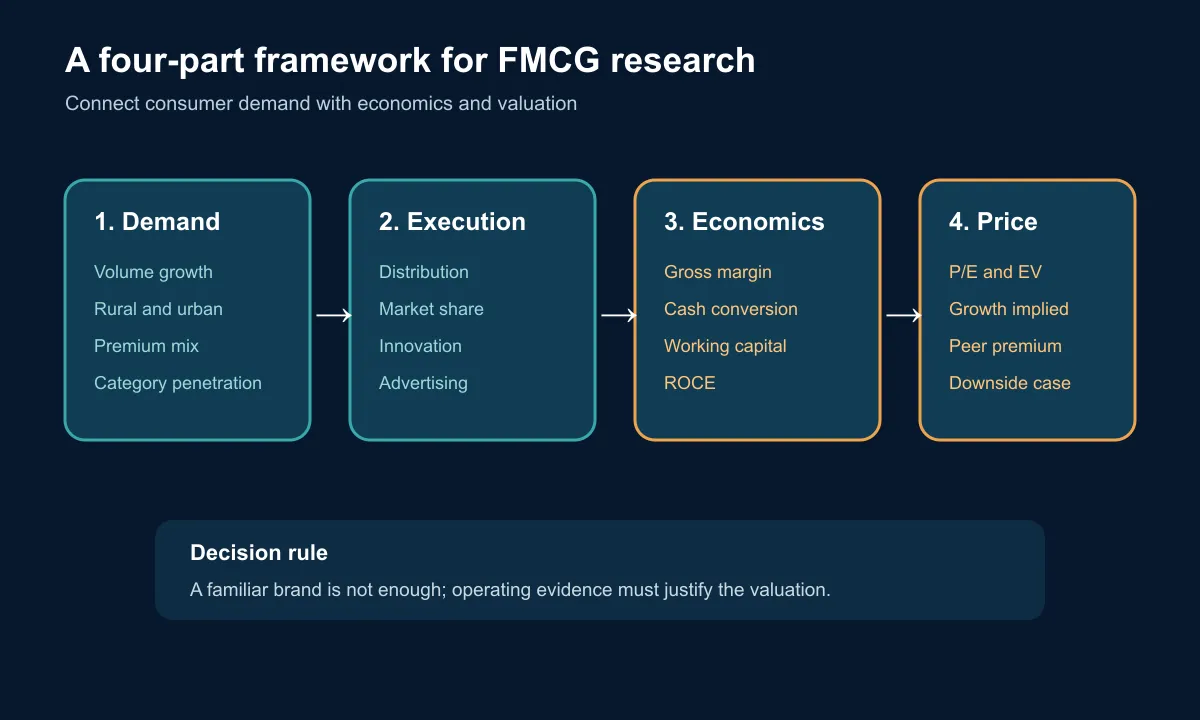
How to Compare FMCG Stocks: Volume Growth, Pricing, Margins and ROCE
Revenue growth can be divided into volume, price and product mix. Volume shows how many units or equivalent quantities were sold. Pricing reflects changes in realised price. Mix improves when premium products or channels contribute more. A company can report healthy revenue growth even when volume is flat if prices rise sharply.
HUL's FY2025-26 performance illustrates the distinction: underlying sales grew 5%, supported by 4% underlying volume growth, while EBITDA margin was 23.6%. The figures provide a dated company example, not a sector benchmark.
For FMCG stocks in India, compare gross margin, EBITDA margin, advertising as a percentage of sales, working-capital days, free cash flow and return on capital employed. High ROCE can reflect strong brands and negative working capital, but it can also be inflated by a small asset base. Include acquired goodwill and planned capacity when judging future returns.
Get research like this in your inbox
The week’s research that mattered, in five minutes. Joined by 2L+ investors.
Drivers of FMCG Demand in India: Rural Consumption and Product Mix
Rural income, crop outcomes, food inflation, employment and government transfers influence demand outside major cities. Urban demand responds to wages, inflation, housing costs and discretionary confidence. HUL's FY2025-26 annual report described gradual improvement and a rural revival that remained uneven and sensitive to food inflation.
Pack sizes help companies reach different budgets. Small packs protect affordability, while premium products can raise value per unit. The FMCG sector in India increasingly combines value-seeking with selective premiumisation, so average selling price alone does not reveal consumer health.
Distribution is another driver. General trade remains important, while modern retail, e-commerce and quick commerce can accelerate launches and change assortment. Companies must balance channel commissions, promotions, data access and delivery economics without disrupting existing distributors.
For FMCG companies in India, track rural versus urban commentary, outlet reach, direct distribution, premium portfolio share and new-product contribution. These indicators often explain growth before consolidated revenue alone does.
How Input Costs and Competition Affect Profitability
Commodity costs enter with a lag because companies hold inventory and use contracts. Wheat, milk, sugar, cocoa, coffee, tea, edible oils, copra, crude-linked packaging, glass and freight affect different categories. When costs rise, management can increase prices, reduce pack quantity, change promotions or accept lower margins.
Pricing power is not unlimited. Local and regional brands can gain share when national products become expensive. Digital-first brands can target premium niches, while retailers may promote private labels. Advertising cuts can protect near-term profit but weaken brand strength later.
When analysing FMCG sector stocks, build gross-margin scenarios for major inputs and estimate the time needed to pass through costs. Distinguish a margin recovery caused by cheaper commodities from durable efficiency or mix improvement.
Sector Risks: Valuation, Commodity Costs and Distribution Shifts
Consumer franchises often trade at premium valuations because earnings are perceived as stable. That premium can compress when interest rates rise, growth slows or competition increases. A strong company can still deliver weak shareholder returns when purchased at an excessive price.
Other risks include food and packaging inflation, regulatory changes, product recalls, weak monsoons, foreign-exchange movements, acquisitions and changes in consumer taste. Alcohol and tobacco face additional taxation and state rules. International subsidiaries introduce currency and execution risk.
For top FMCG stocks in India, check whether consensus growth assumes simultaneous volume recovery, premiumisation and margin expansion. Use Wright Research's market dashboards to place valuation and market conditions in context. Defensive demand does not eliminate price risk.
Nifty FMCG Index vs the Broader FMCG Stocks Universe
NSE Indices defines FMCG as non-durable, mass-consumption products available off the shelf. The Nifty FMCG Index contains a maximum of 15 companies, uses capped free-float market capitalisation and is rebalanced semi-annually on the last working day of March and September.
Its April 2026 factsheet showed 15 constituents. ITC, HUL, Nestlé India, Tata Consumer Products, Varun Beverages and Britannia were among the largest weights. Those weights were a dated snapshot and changed with prices and the September review.
The index is a benchmark, not the complete FMCG stocks list. Smaller companies and borderline consumer businesses may sit outside it. Conversely, an index constituent may have material exposure beyond classic household products. Compare the latest factsheet with the broader FMCG and consumer research hub before defining the investable universe.
Data Sources and Refresh Schedule
Use NSE and BSE filings for results, shareholding and corporate actions; company annual reports for segment and operating data; and NSE Indices for constituents, weights and methodology. Screeners are convenient discovery tools but should not replace source documents.
Refresh market capitalisation and valuation whenever making a decision. Review operating metrics quarterly and rebuild the full FMCG stocks in India comparison after annual reports. Recheck the Nifty FMCG list after the March and September rebalances.
A disciplined dataset records the date, consolidated or standalone scope, segment classification and calculation method. That makes comparisons across the FMCG sector in India repeatable and prevents stale weights or mixed accounting periods from distorting conclusions.
Is your portfolio built for what’s coming?
Get a free AI-powered review of your holdings — risk, overlap and quality in minutes.
FAQ
What is the difference between FMCG stocks and consumer durables stocks?
FMCG businesses sell frequently purchased, non-durable products such as food, toiletries and cleaners. Consumer-durable companies sell longer-lived products such as appliances, electronics and furniture, which have different replacement cycles and financing sensitivity.
Do FMCG stocks commonly pay dividends?
Many mature FMCG companies pay dividends because their businesses can generate cash with moderate capital intensity. Payouts vary with growth plans, acquisitions, debt and board policy, so historical dividends are not guaranteed.
Can FMCG stocks be considered defensive in every market cycle?
No. Demand for essentials may be relatively resilient, but share prices remain exposed to valuation changes, commodity inflation, competition, regulation and execution. Premium-priced stocks can fall even when earnings grow.
Are all companies shown under an FMCG screener pure-play consumer businesses?
No. Some companies combine FMCG with cigarettes, agriculture, commodities or international operations. Read segment revenue, profit and capital employed before deciding what exposure the stock provides.
The central lesson is that FMCG stocks in India should be compared by category economics, volume growth, pricing power, margins, capital efficiency and valuation. Brand familiarity is useful context, but it is not an investment thesis.
For education only, not investment advice. Index composition and financial data change. Consult a SEBI-registered investment adviser where appropriate.