
Historical data from global stock markets indicate a noticeable seasonal pattern, where stock market performance fluctuates with the calendar months. The November-April interval often yields better returns compared to May-October. Akin to the well-documented January and Santa Claus rallies in the United States and the Diwali effect in India, there is a discernible March effect witnessed in stock markets. This aligns with the end of the financial year and the beginning of the new financial year in many countries such as India which can potentially influence investment decisions and market movements.
Seasonal market behavior may be attributed to a blend of psychological, social, and economic factors. These include investment patterns post-tax season, trading volume changes during vacation periods, and heightened activity during festive seasons. For example, in the US, tax-loss harvesting in December may lead to a surge in January as investors reposition their portfolios. Similarly, we can see tax-loss harvesting having an impact on Indian markets as well in March. Let’s look at this in detail in today’s blog.
March Effect in US Stock Markets
March has historically proven to be a period of significant volatility for the stock market. In 2022 began with geopolitical tensions stemming from Russia's invasion of Ukraine, the month saw an immediate impact on global markets. March 2000 marked the end of the dot-com boom, with the Nasdaq experiencing a substantial crash. Similarly, the emergence of COVID-19 in March 2020 caused a significant sell-off, illustrating the month's capacity for drastic shifts.
Despite these challenging beginnings, historical patterns show a capacity for recovery within March. Analysis indicates an average 0.5% increase in the S&P 500 during March since 1928, with more instances of gains than losses. Furthermore, data suggests that after a weak start to the year, there’s a pattern of recuperation: stocks tend to bounce back in March and often continue to gain through the year.
See what markets are pricing in
Live indices, sector moves and market breadth — the backdrop to every story we publish.
March Return & Volatility Effect in Indian Stock Markets: Empirical Evidence
Stock markets, often perceived as enigmas with unpredictable fluctuations, do exhibit discernible patterns upon closer examination. In India, we have seen a similar seasonal pattern manifesting as the October effect , marked by a positive momentum from October to December, likely driven by festival-related spending and optimism. Similarly, March to May sees a rally that could be linked to the financial year-end activities, including corporate results and forecasts influencing investor sentiment.
A deep dive into 23 years of historical data points to March as a peculiar month for investors. With 56% of March months ending in the red, it stands out as the month most prone to negative returns—a trend that's hard to dismiss as mere coincidence.
In an analysis conducted by researchers for BSE 500 and NSE 500 stocks over 10 years from 2011 to 2021 found that March stands out as a month of heightened volatility and negative returns for both the S&P BSE 500 and NIFTY 500 indices. Investors need to be aware of these trends and adjust their trading strategies accordingly, being mindful of the increased risk and the potential for larger-than-average price movements.
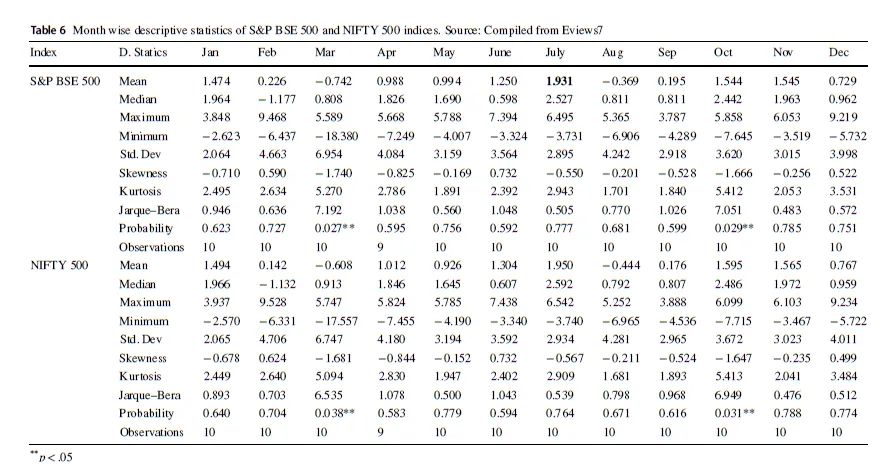
Mean Returns Analysis
For the S&P BSE 500, the mean return in March is -0.742, which is the lowest across all months.
The NIFTY 500 shows a similar pattern, with a mean return of -0.608, also the lowest of the year.
Standard Deviation
March has the highest standard deviation for both indices (S&P BSE 500 at 3.884 and NIFTY 500 at 2.065) compared to other months, indicating that returns in March are more spread out from the mean, hence more volatile.
Skewness
The skewness value for both indices in March is negative (S&P BSE 500 at -1.740 and NIFTY 500 at -1.681), implying that the return distribution is skewed to the left, indicating that there are more negative returns than positive ones.
Kurtosis
The kurtosis for March is high for both indices (S&P BSE 500 at 5.720 and NIFTY 500 at 6.535), suggesting a leptokurtic distribution, which means that returns in March are more prone to extreme values compared to a normal distribution.
Read this article to learn more about the Buying Stocks in October, November & December? Seasonal Patterns in Global & Indian Stock Markets
Get research like this in your inbox
The week’s research that mattered, in five minutes. Joined by 2L+ investors.
Why Does the March Effect Happen?
Let’s try to understand the March Effect in the Indian Stock Market and why it occurs. Here are a few reasons:
The Budget Effect
The Indian Union Finance Minister's annual budget announcement at the beginning of February plays a pivotal role in shaping market expectations and influencing stock prices.
Despite the budget announcement occurring in February, studies have found that its effects are predominantly reflected in March. This lag suggests that investors require time to fully digest the budget's details and implications before their reactions are reflected in the market.
Political and Economic Policy Impact
Investor sentiment in India, influenced by political events and economic expectations, also contributes to the March Effect.
If the announced budget or political conditions suggest an economic trajectory below investor expectations, the market tends to react negatively.
Companies Improve Cash Positions
Corporate financial strategies often include a reduction in equity exposure at the end of the fiscal year.
Companies liquidate equities to bolster their cash positions for the year-end balance sheet, with intentions to re-enter the market in the new fiscal period. This move towards liquidity is a significant driver in the market’s March decline.
Advance Tax Payments
March 15 marks the deadline for settling the full amount of advance tax for the fiscal year. Though tax liabilities are distributed across the year through quarterly instalments, the final adjustment often takes place in the last quarter, potentially leading to asset liquidation to cover tax bills.
Tax Loss Harvesting
Investors looking to optimise their tax positions may realise losses to offset capital gains, or conversely, harvest gains if they have incurred losses earlier in the year. This tactical booking can prompt selling in March, contributing to the negative performance trend.
Portfolio Rebalancing:
Institutional investors and fund managers often rebalance portfolios at the end of the fiscal year to align with revised investment mandates, performance benchmarks, or to manage risk.
This rebalancing can result in the sale of underperforming stocks and the purchase of securities that better fit the strategic objectives for the upcoming year, leading to fluctuations in market demand and price movements in March.
Investor Sentiment and Behavioral Biases:
The stock market is influenced not just by financials but also by investor sentiment and psychological factors. If the budget or prevailing political and economic conditions are viewed unfavorably, investor sentiment can turn pessimistic, prompting a sell-off.
Conversely, positive sentiments can lead to increased buying. In March, these emotional responses to fiscal policy and economic forecasts are particularly pronounced as they follow closely on the heels of the budget announcement.
Impact of SEBI Advisory For Small & Mid Cap Mutual Funds on March Effect
While the March effect is a noteworthy phenomenon, actions by regulatory bodies like SEBI and the RBI add another layer of complexity to market behaviors. For instance, SEBI’s advisory on the overheating of small and midcap stocks led to AMFI recommending a shift towards large-cap stocks. SEBI's intervention could potentially alter the traditional March effect by introducing a stabilizing force against the historical downturns in this month. The regulation may smooth out the market's volatility, as funds become more cautious in their investment approaches.
For investors, the current market scenario highlights the importance of vigilance and diversification. With fund houses taking a cautious stance, particularly in the small and mid-cap segments, investors should be mindful of the heightened scrutiny and the possible effects on market behavior. In the short term, there could also be more volatility as investors may reduce their exposure to small cap & mid cap mutual funds in light of SEBI’s advisory.
Read this article to Understand SEBI's Advisory on Small Cap & Large Cap Mutual Fund Inflows
Is your portfolio built for what’s coming?
Get a free AI-powered review of your holdings — risk, overlap and quality in minutes.
Implications for Investors
Investors should consider the implications of SEBI's actions on their portfolios. The advisories aim to foster a market environment where long-term, sustainable growth is prioritized over short-term gains. This means that investors may need to recalibrate their expectations and strategies for small-cap and mid-cap funds, paying close attention to fund disclosures and risk profiles. The March Effect signifies the importance of considering macroeconomic and political factors in investment strategies. Investors looking to capitalize on or hedge against this seasonal volatility must closely monitor the budget announcement and related economic indicators. Understanding these dynamics can aid in making more informed investment decisions and potentially exploit or safeguard against the March Effect.
For investors, recognizing these patterns could be integral to strategizing entry and exit points in the market. However, it is imperative to remember that these are historical trends and not foolproof predictors. Strategic decisions should be supported by robust research and current market analysis, considering that past performance is not indicative of future results.