

On 3 July 2025, SEBI temporarily barred US based trading giant Jane Street & its Indian entities from trading in Indian securities and derivative markets until further notice. SEBI has impounded 48.4 billion rupees (approximately $566.7 million) as the “unlawful gains” Jane Street is alleged to have made through these strategies. Indian banks must hold these funds in escrow, disallowing any withdrawals without SEBI approval.
SEBI’s 105-page interim directive accuses Jane Street of breaching the Prohibition of Fraudulent and Unfair Trade Practices act by engaging in manipulative trading strategies around weekly index option expiries. Trading was suspended until the frozen funds were placed in escrow and both Jane Street responded and a final order was issued.
Let’s look at alleged Jane Street trading manipulation and its outcome in today’s newsletter.
What is Jane Street?
Founded in 2000, Jane Street is an international trading and market-making firm headquartered in New York. The firm accounted for 10.4% of all North American equity trading, up from 7.6% in 2022, closing in on Citadel Securities’ market-leading 23%. Globally, Jane Street estimates it now represents over 2% of all trading across more than 20 countries.
The firm’s dominance in ETF market-making is particularly striking. In 2023, its average monthly ETF trading volume reached $527 billion, translating to 14% of US ETF activity and a staggering 20% of European ETF volumes - amounting to $6.3 trillion annually. As an authorized participant (AP), it handled 24% of primary market activity in US-listed ETFs and an even larger share in international equity ETFs (28%) and US fixed income ETFs (41%). This deep ETF integration has allowed Jane Street to gain serious ground in corporate bond trading, long the preserve of major banks. By building massive ETF-related bond inventories, the firm has become a key liquidity provider in the broader fixed income market, executing $179 billion in global portfolio trades last year, often involving baskets ranging from $10 million to $1 billion in size.
Jane Street’s Highly Profitable
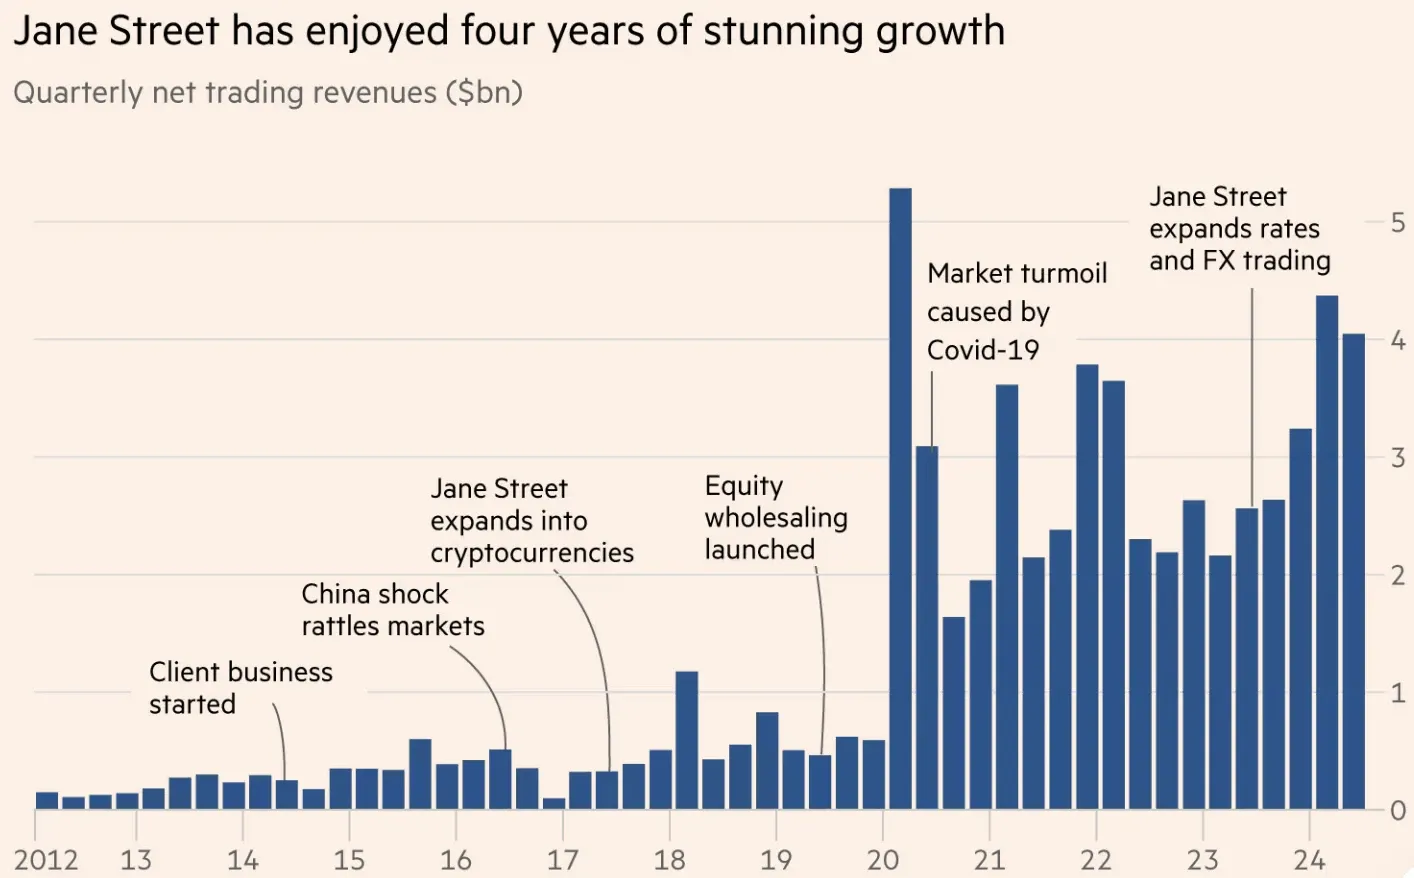
In 2023, the firm posted net trading revenues of $10.5 billion, with a profit margin exceeding 70%. That’s the fourth consecutive year it’s crossed the $10 billion mark, and it raked in a record $21.9 billion in gross revenues, equivalent to one-seventh of the total global trading revenues across all major investment banks.
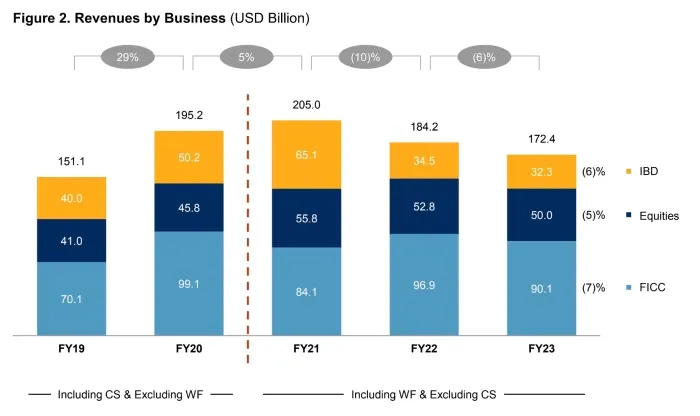
By comparison, Goldman Sachs - once the gold standard of trading - earned $15.8 billion from market-making in 2023, but with a vastly larger balance sheet and headcount. Jane Street, with just 2,631 employees, generated nearly $4 million in net revenue per employee. Adjusted EBITDA per employee was $2.83 million, and per trader it soared to nearly $22 million.
Balance Sheet Muscle and Strategic Paranoia
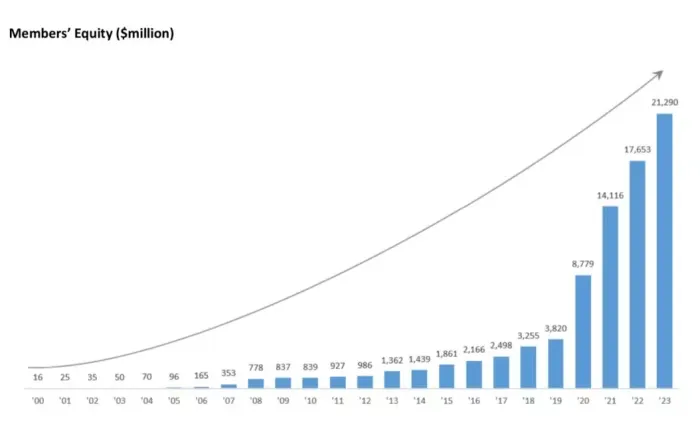
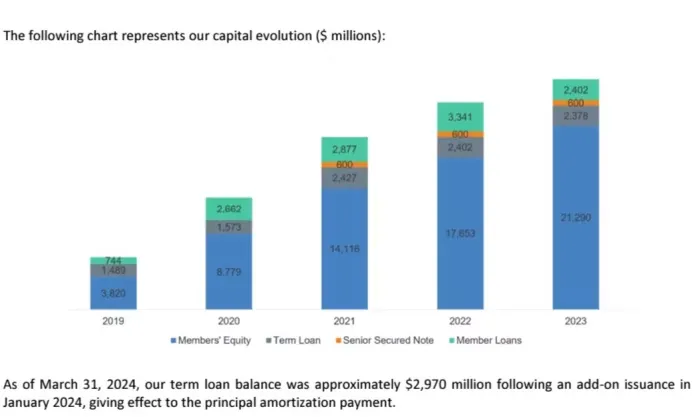
The firm’s balance sheet surged 34% in 2024 to $140.2 billion, setting it apart from pure high-frequency trading outfits like Virtu. With $21.3 billion in employee equity (now over $24 billion after a blockbuster Q1 in 2025), Jane Street’s ownership model fuels long-term thinking and risk consciousness.
Risk management is a core obsession. Jane Street maintains a central risk book managed by a dedicated team and spends $50–75 million annually on out-of-the-money put options to hedge catastrophic tail risk. It also keeps a liquidity buffer averaging $4.1 billion, held outside its usual prime brokerage network to ensure resilience during periods of extreme stress.
The firm even lists its own risk management protocols as a risk factor, acknowledging that stringent internal controls may sometimes cause it to miss out on high-volatility profits.
Jane Street Enters Indian Derivative Market
Jane Street entered India in December 2020, establishing local entities domestically and via affiliates in Singapore and Hong Kong. Between January 2023 and March 2025, SEBI alleges, the firm generated net profits of ₹36,502 crore (US$4.3 billion) trading in index options sparked by intricate intraday strategies on the Bank Nifty index. Known for its deep risk management culture and functional organizational structure, Jane Street is at the forefront of global trading.
Check the macro backdrop
GDP, inflation, rates and more — India’s key economic indicators in one dashboard.
Alleged Strategy of Jane Street
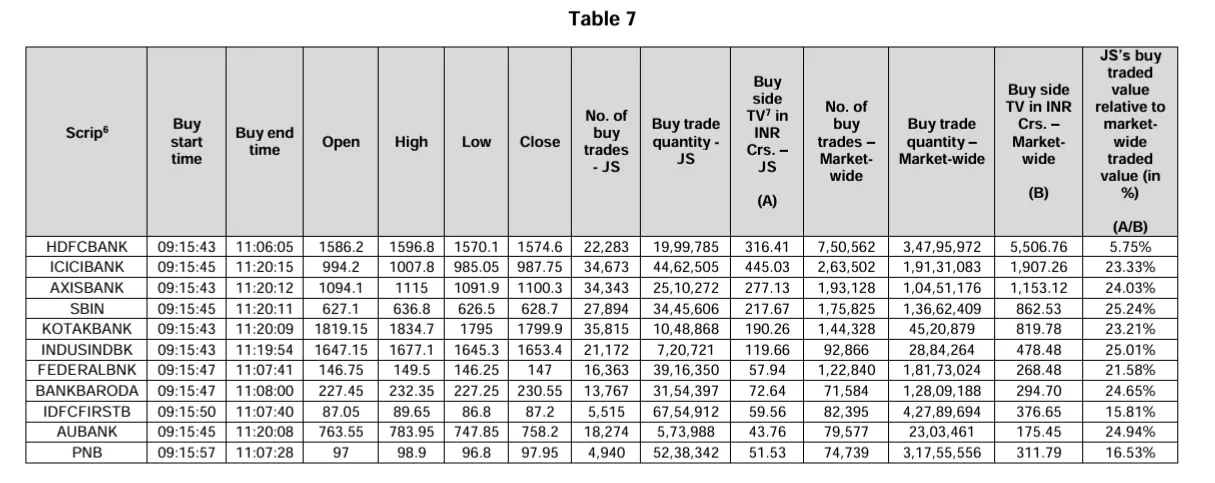
SEBI’s 105-page interim order paints a damning picture of Jane Street’s operations in India. The regulator claims the firm used a complex intraday strategy to manipulate the BANKNIFTY index - a benchmark for India’s banking sector stocks - in order to profit from corresponding options trades. According to the findings, Jane Street would aggressively buy large quantities of BANKNIFTY index stocks and futures early in the trading day, artificially pushing up the index.
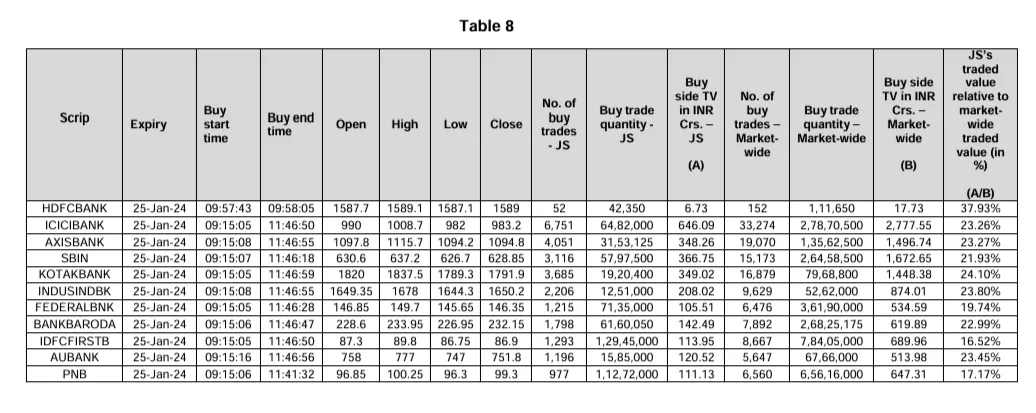
Simultaneously, it would hold massive short positions - primarily put options - on the same index.
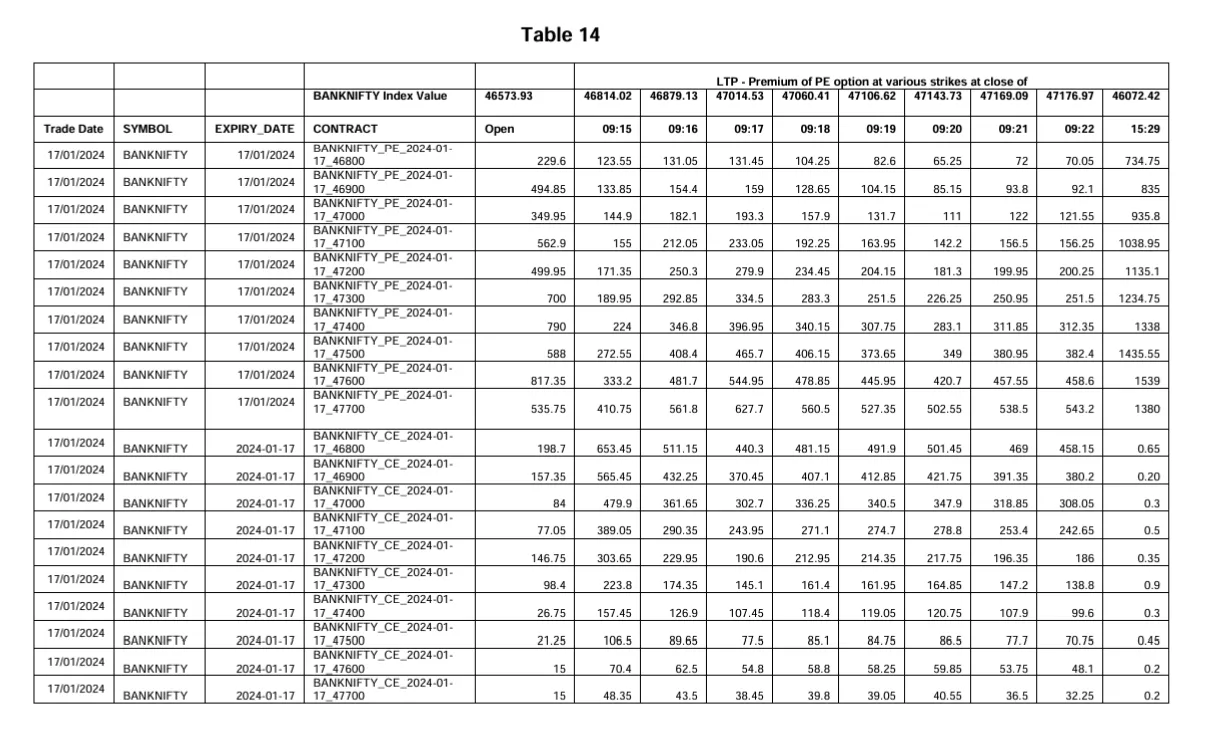
The manipulation reached its peak on January 17, 2024, a day SEBI described as the most profitable for the firm in India. On that single day, Jane Street allegedly earned ₹734.93 crore (about $86 million) through this strategy. During a rapid eight-minute window, Jane Street acquired ₹572 crore (about $67 million) worth of BANKNIFTY stocks, lifting the index by more than 1%. Later in the day, the firm reportedly dumped those same stocks, triggering a drop in their prices and boosting the value of its options bets.
SEBI estimates Jane Street’s net trades that day amounted to around $511 million - over 3 times the size of the market’s second largest player, accounting for nearly 25% of all market activity.
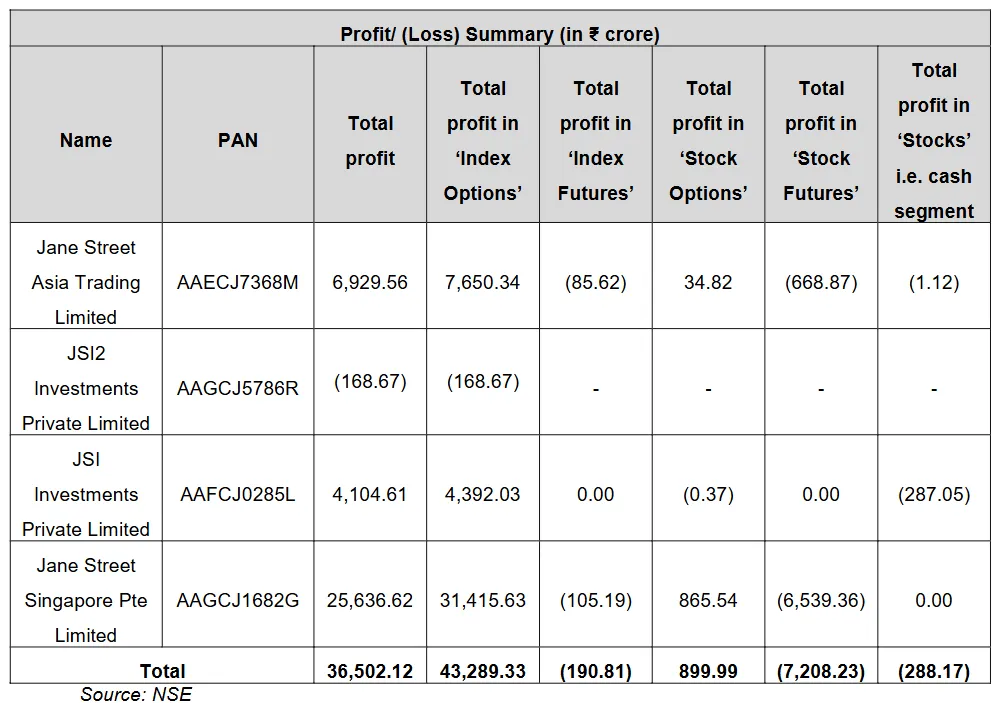
This “Intraday Index Manipulation” and “Extended Marking the Close” routine reportedly unfolded over 18 expiry days between January 2023 and May 2025 . SEBI argues that this sequence violated PFUTP regulations and, in effect, manipulated index price formation to the detriment of retail investors. The numbers behind the allegations are staggering:
₹36,502 crore in net profits from January 2023 to March 2025.
₹43,289 crore net gains from index options alone, offset by losses in other market segments.
On a standout expiry day January 17, 2024 Jane Street allegedly transacted through ₹4,370 crore of cash and futures trades while holding index option positions worth over 7 times that amount.
In a typical expiry week, Indian retail option traders experienced over 90% loss rates , attributed by SEBI to Jane Street’s strategy. This alleged manipulation, spread across many expiry cycles, raised serious red flags within India's regulatory and trading communities.
Get research like this in your inbox
The week’s research that mattered, in five minutes. Joined by 2L+ investors.
Market and Institutional Impact of the SEBI’s Order
The removal of Jane Street triggered sharp sell-offs among key consolidation firms linked to high-frequency trading and derivatives. Shares in Angel One, BSE, CDSL, and Nuvama Wealth fell between 3.5% and 9% on the day of the ban. The decline reflected investor concern that reduced algorithmic activity could squeeze revenue. However, the broader market indices Sensex and Nifty largely shrugged off the news, ending the session relatively flat.
Brokerages dependent on F&O, especially discount platforms, felt direct revenue pressure. According to analysis by RBI and industry sources, derivatives volume fell 38% after earlier SEBI rule changes, trimming broker revenues significantly. Q1 2025 saw major firms report revenue declines of 16–35% and EBITDA drops up to 50%. Nifty and Sensex remained mostly stable, but transaction-fee-based earnings for brokers were structurally impacted.
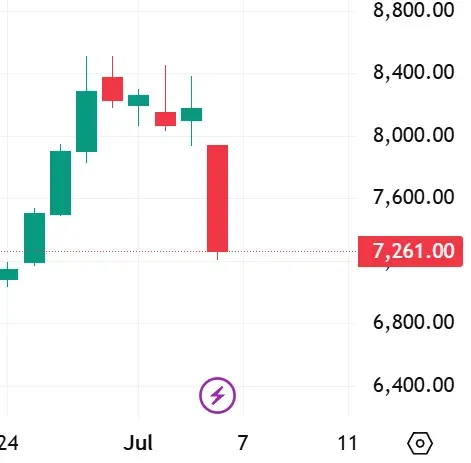
(Script : Nuvama , - 11.19% (Tradingview , 04/07/2025 )
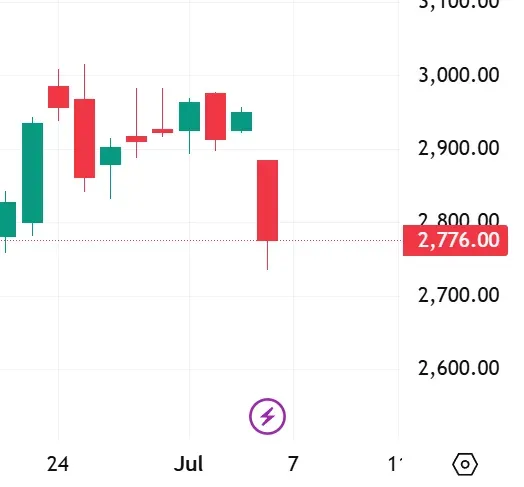
(Script : AngelOne , - 5.92% (Tradingview , 04/07/2025 )
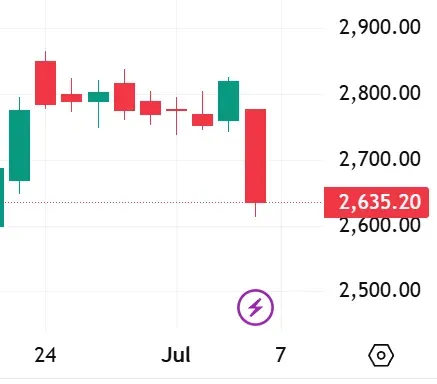
(Script : BSE , - 6.56% (Tradingview , 04/07/2025 , 2 PM)
A pronounced drop followed in the derivatives segment: turnover in index options dropped roughly 17% on NSE and 13% on BSE shortly after the ban announcement.
Indian Derivative Markets is 60% of Global Derivatives
The surge in derivative trading activity has drawn the attention of regulators concerned about systemic risk. Retail participation accounted for 35% of the derivatives market, raising red flags for SEBI, India’s market regulator. SEBI F&O report showed 90% of retail investors lose money in derivatives trading. In response, the regulator is probing broker incentives, revising fee structures, and launching risk-awareness campaigns.
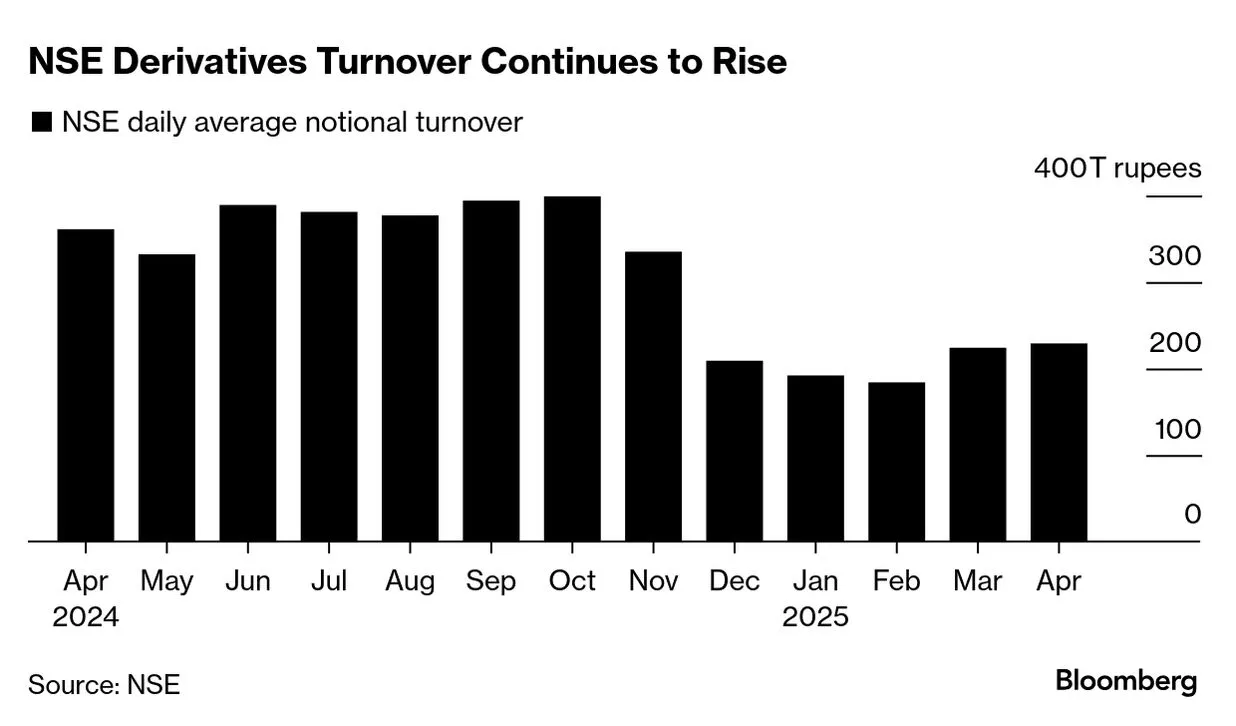
More broadly, India's exchange-traded derivatives market shrank by 51% in options volume year-over-year in Q1 2025, and the nation’s own derivatives trading fell from 16 billion to 4 billion contracts by March. While not solely due to Jane Street, the event accelerated an existing liquidation trend caused by broader regulatory reforms. The Jane Street action is a clear signal: algorithmic and institutional firms will now face rigorous scrutiny. Exchanges are likely to roll out real-time trade-pattern detection, expiry-day volume controls, and possibly mandatory algorithmic audits.
Global players like Citadel Securities, Optiver, IMC Trading, and Millennium - are also ramping up operations in India’s surging derivatives market. India now accounts for nearly 60% of global equity derivatives trades, according to the Futures Industry Association.
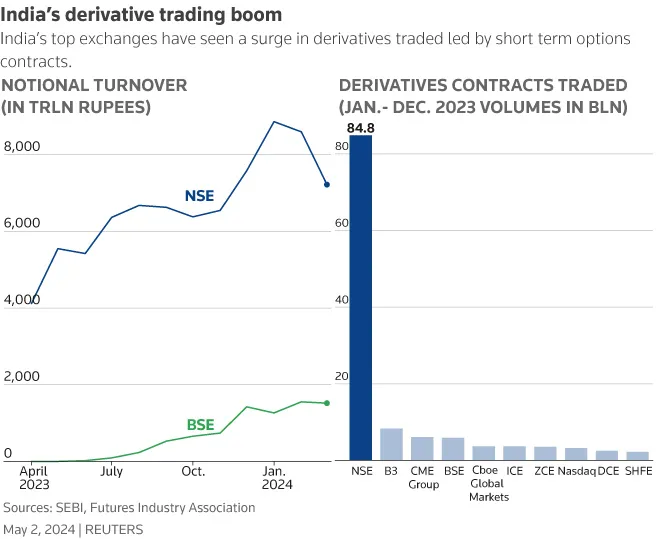
Despite the high-profile nature of the Jane Street case, market experts say broader market sentiment remains unaffected. SEBI also timed its announcement strategically - post the weekly derivatives expiry - to minimize systemic ripple effects. New regulatory measures, which came into effect on July 1, have already tightened oversight of large derivative positions.
See what markets are pricing in
Live indices, sector moves and market breadth — the backdrop to every story we publish.
Conclusion
Going forward, SEBI’s actions may spark sweeping changes: real-time surveillance infrastructure, algorithmic audit mandates, automatic position limits on expiry days, and enhanced transparency for retail traders. These reforms aim to deter exploitative trading, foster long-term integrity and liquidity, and encourage responsible participation from quantitative trading firms. Market participants from retail investors to global algo firms are now called to adapt by upgrading compliance systems and embracing behavioral limits.
SEBI’s decisive action against Jane Street establishes a powerful precedent. It reinforces that market fairness outweighs trading complexity, and even global quantitative giants are subject to local rules. As India’s derivatives markets mature under deep volumes and global participation, maintaining trust will require constant vigilance, technological adaptation, and thoughtful regulation.
This episode illustrates that fairness and growth can coexist when regulators are willing to act decisively. Global firms must recalibrate to India’s regulatory environment, and domestic institutions must be prepared to lead in compliance. India's markets are expected to emerge stronger, more robust, transparent, and globally respected as a result.


