

Semiconductors have become the industry through which states now measure each other. The reason is structural. A small number of firms, in a small number of places, make the components that every advanced economy depends on, and the value inside that chain is concentrating rather than spreading. Governments have responded with subsidies, export controls, licensing regimes and coalitions. This article looks at what those measures have achieved by mid-2026, what they cost, and what a realistic definition of success looks like.
What changed in the chip market in 2026?
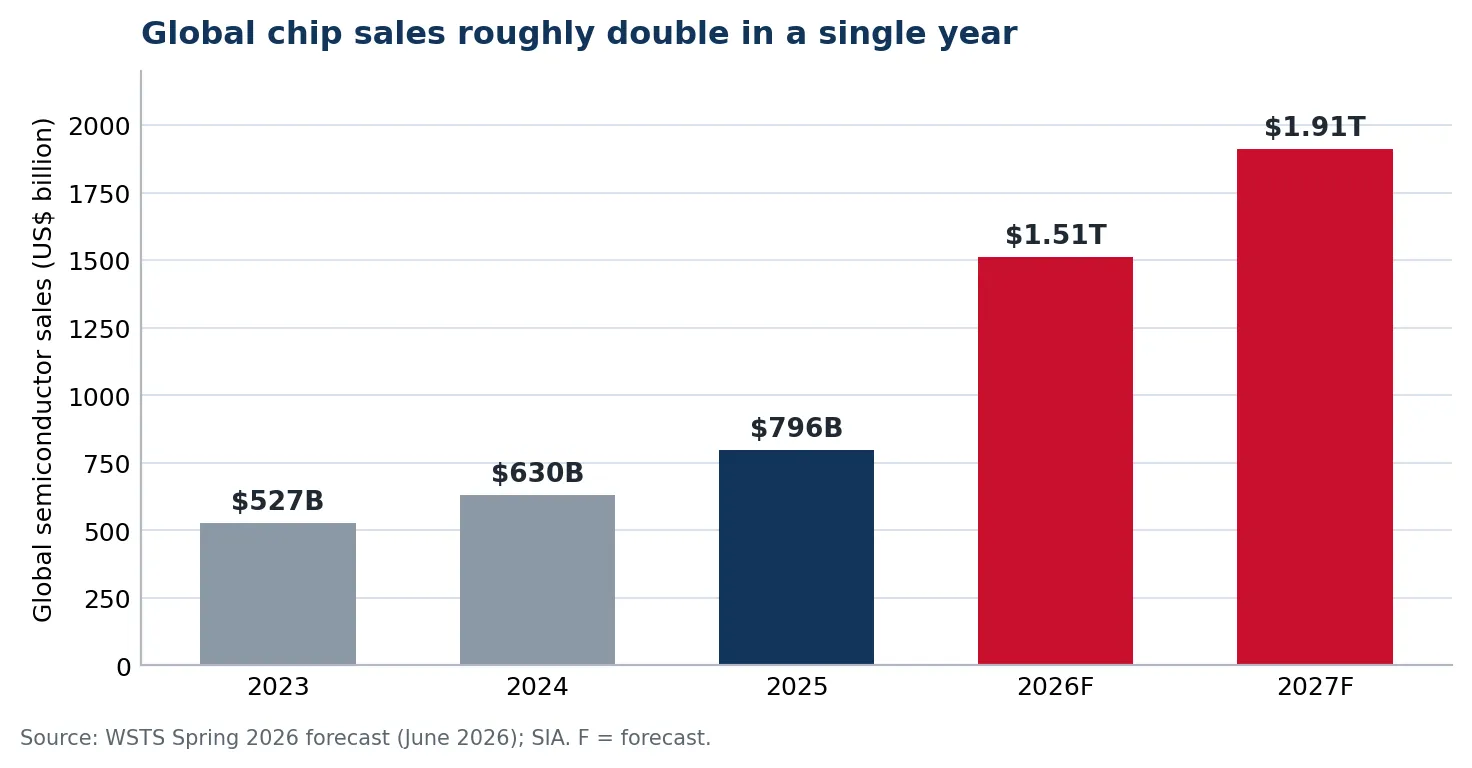
The scale of the market moved faster than anyone forecast. In December 2025, the World Semiconductor Trade Statistics organization projected global chip sales of about US$975 billion for 2026. In June 2026 it revised that figure to US$1.51 trillion, a rise of roughly 90% over the 2025 total of US$795.6 billion. It was the largest upward revision in the organization's history. Memory drove most of it, with the segment forecast to grow around 250% to more than US$800 billion, while logic is expected to rise 37% to US$411 billion. The 2027 projection sits near US$1.9 trillion.
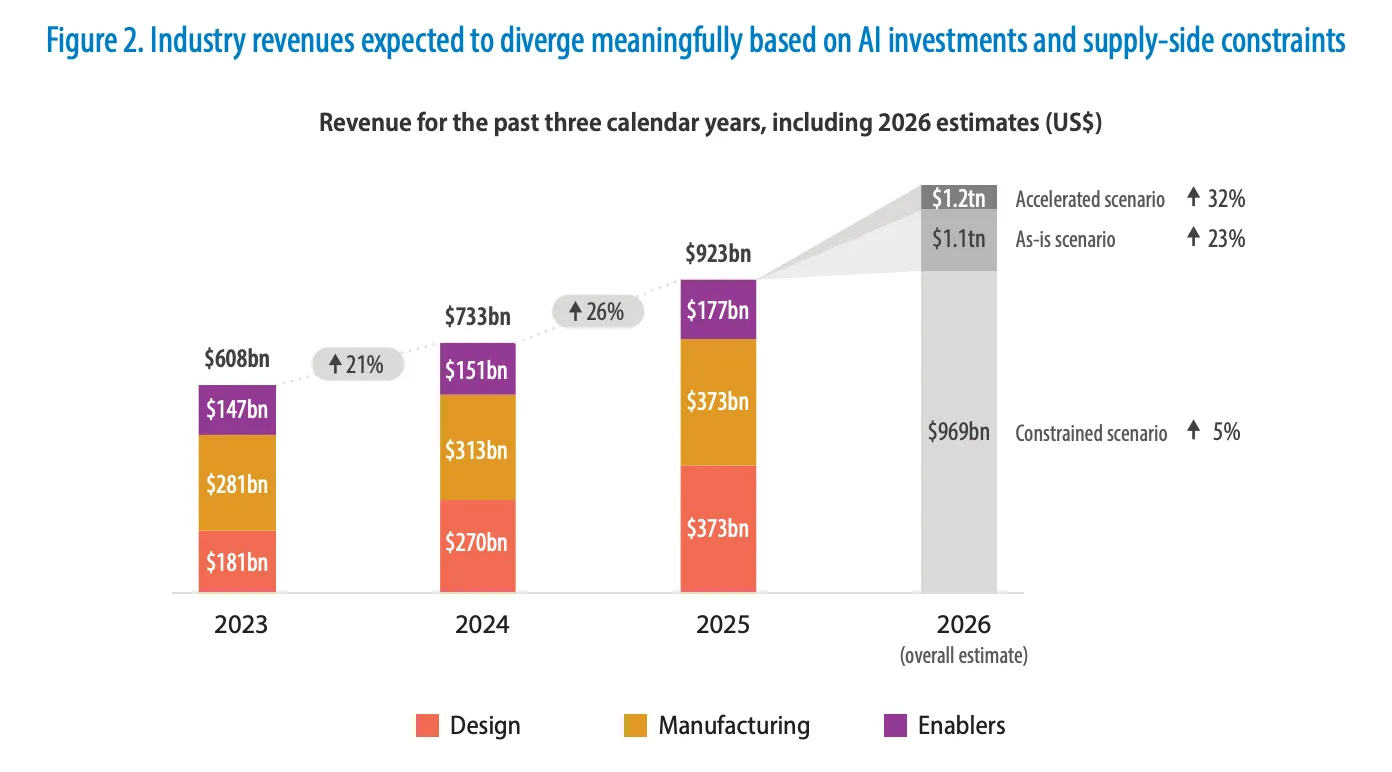
Volume tells a different story from value. Generative AI chips will account for roughly half of industry revenue in 2026 while representing under 0.2% of units shipped. Silicon wafer shipments grew about 5.4% in 2025 against revenue growth of 22%. The industry is expanding in value terms through a very narrow band of products, made at a handful of sites, using tools from a handful of suppliers. That concentration is what turns a commercial boom into a geopolitical problem.
Check the macro backdrop
GDP, inflation, rates and more — India’s key economic indicators in one dashboard.
Where do the real chokepoints sit?
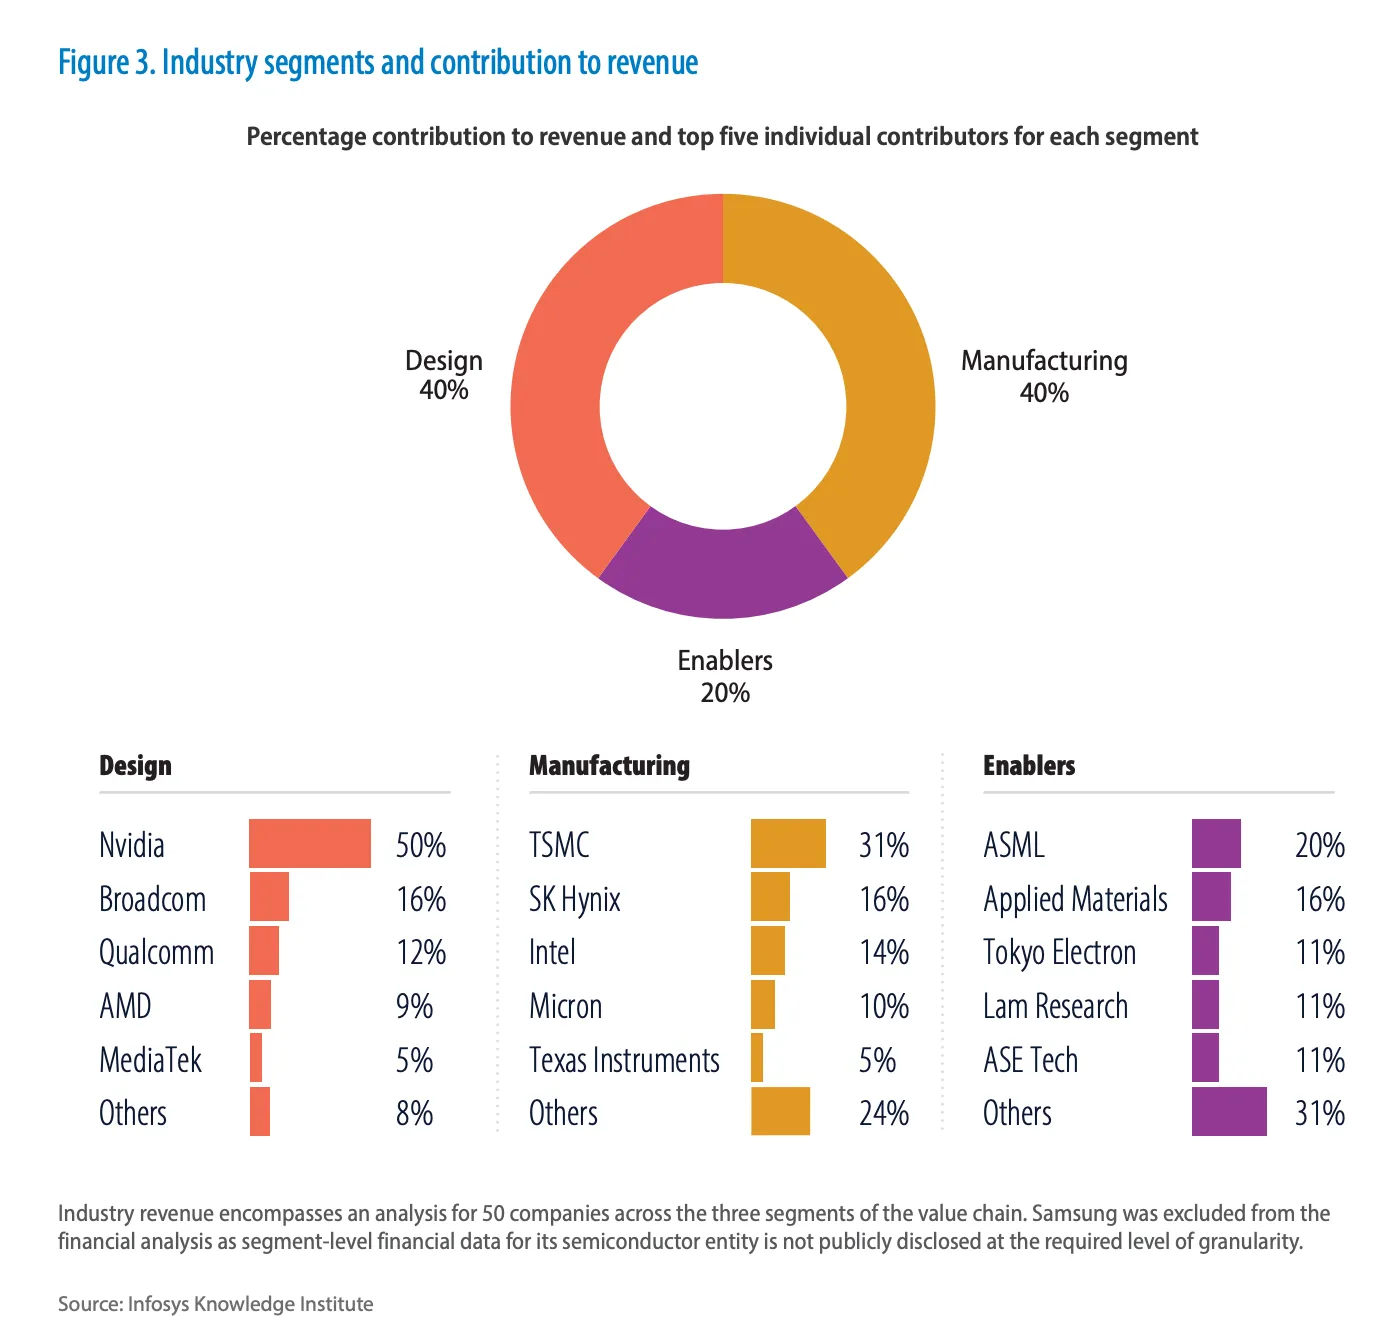
Each stage of the chain has a dominant holder, and each holder sits inside a different jurisdiction with different interests. Taiwan produces about 90% of the world's most advanced logic chips. ASML in the Netherlands is the sole supplier of extreme ultraviolet lithography systems. Samsung and SK hynix together hold roughly 80% of high bandwidth memory output. United States headquartered companies generated 53.4% of global semiconductor sales in 2025 and dominate design software. China holds the upstream materials position.
Table 1: The chokepoint map
Stage | Primary holder | Concentration | Principal exposure |
|---|---|---|---|
Leading-edge logic fabrication | Taiwan (TSMC) | About 90% of most advanced logic ICs | Single-territory concentration under military threat |
EUV lithography | Netherlands (ASML) | Sole global supplier | Allied export controls and Chinese countermeasures |
High bandwidth memory | South Korea (Samsung, SK hynix) | Roughly 80% of HBM output | Imported energy through the Strait of Hormuz |
Chip design and EDA tools | United States | 53.4% of global sales by company headquarters | Extraterritorial reach of US licensing rules |
Rare earths, tungsten, gallium | China | About 79% of tungsten mine production | Licensing used as an instrument of policy |
Assembly, test and packaging | ASEAN, China, Taiwan | Majority of global back-end capacity | Scarce packaging talent in the US and Europe |
Materials became the fastest-acting instrument
Fabs take years to build. Materials controls take effect within weeks, which is why they have become the preferred lever. After China added tungsten to its export control list in February 2025, prices reached US$2,250 per metric tonne unit by March 2026, a rise of 557% in just over a year, while Chinese exports of restricted tungsten products fell about 40% in 2025. Tungsten has no practical substitute at scale in advanced-node manufacturing.
The October 2025 rare earth measures went further, introducing extraterritorial licensing and case-by-case review for materials destined for sub-14-nanometre production, advanced memory and semiconductor equipment. A truce agreed at Busan in late 2025 suspended some measures while leaving the licensing architecture intact, and escalation resumed through mid-2026. Energy is a parallel vulnerability: South Korea imports roughly 70% of its crude oil from the Middle East, almost all of it through the Strait of Hormuz, which places the world's memory supply downstream of a single maritime corridor.
What is each major power actually doing?
China is building inward
The China Integrated Circuit Industry Investment Fund has committed about US$100 billion across three phases, with the third phase directed at higher-end capability and indigenous answers to chokepoints. Beijing has paired capital with procurement rules, requiring chipmakers seeking approval for new capacity to source at least half their equipment domestically. State-affiliated entities placed a record number of orders for domestic lithography machines and components in 2025. The result is a parallel ecosystem. China's mature-node logic capacity now exceeds the installed capacity of Taiwan and South Korea combined, and advanced-node prices inside China run 25% to 30% below identical chips made elsewhere.
The United States controls the frontier and prices access to it
Washington operates on three tracks: export controls on advanced chips and tools, industrial subsidy, and coalition building. The CHIPS and Science Act appropriated US$52.7 billion, and the SIA has tracked more than US$770 billion in announced private investment across 160 projects in 30 states since 2020. Enforcement has tightened alongside it, with prosecutors charging three men in March 2026 over an alleged scheme to move roughly US$2.5 billion in restricted GPU servers to Chinese buyers.
Access has also become a revenue line. A rule effective January 2026 allows H200-class accelerators to reach approved Chinese customers under case-by-case review, subject to a 25% revenue share to the US government, volume caps relative to domestic shipments and mandatory testing inside the United States. Chinese firms had placed orders for more than two million such units for 2026 delivery.
Europe is rewriting its Chips Act
The first European Chips Act mobilised more than €52 billion in public and private investment and built pilot lines and competence centres, while leaving the EU structurally dependent on third countries for advanced manufacturing and design. The Commission adopted a Chips Act 2.0 proposal on 3 June 2026 as part of its Technological Sovereignty Package. The shift is toward demand. The proposal introduces Demand Accelerators and public procurement instruments, broadens state aid across the full value chain from raw materials to advanced packaging, and targets permitting decisions within 12 months. The file remains in the legislative process, with negotiations targeted for completion in 2027.
The second tier is choosing segments instead of ecosystems
South Korea is defending a lead it already holds, backing memory, logic and data centres with an investment plan approaching US$1 trillion through 2040, funded largely by HBM cash flows. Japan has concentrated on Rapidus and on clusters in Kyushu and Hokkaido. India added US$13 billion under Semicon 2.0 in July 2026 on top of the US$9 billion India Semiconductor Mission, starting at 28-nanometre production with design and assembly already in place. ASEAN members are absorbing back-end investment as companies pursue China-plus-one sourcing. None of these programmes aims at self-sufficiency; each aims at an indispensable position in one part of the chain.
Table 2: National programmes and their stated aims
Jurisdiction | Main instrument | Public support | Stated aim |
|---|---|---|---|
China | IC Industry Investment Fund, three phases | About US$100bn | Indigenous supply chain, 50% local equipment in new capacity |
United States | CHIPS and Science Act plus export controls | US$52.7bn appropriated | Frontier control and insulation from a Taiwan shock |
European Union | Chips Act and Chips Act 2.0 (proposed) | Over €52bn mobilised | Reduce design and advanced manufacturing dependence |
South Korea | National AI and memory investment plan | Near US$1trn to 2040 | Defend the HBM and memory lead |
Japan | Rapidus and regional clusters | Multi-billion national programme | Re-enter leading-edge logic |
India | India Semiconductor Mission and Semicon 2.0 | About US$22bn combined | Mature-node fabrication, assembly and test scale |
Why does relocating production cost so much?
Roughly US$1 trillion of investment is expected to flow into chip manufacturing through 2030, against industry revenues projected above US$1.6 trillion by that year. The cost gap between regions comes from a small number of factors. McKinsey Global Institute modelled a 28-nanometre fab producing 400,000 wafers a year and found that equipment and materials, which make up about 60% of the cost, are priced similarly everywhere. Labour accounts for under 10% of total cost but explains about half the gap between Taiwan and the United States and more than a third of the gap with Germany. Construction, excluding equipment, costs at least twice as much in Europe and the United States. Fabs in Taiwan and mainland China typically begin production 12 to 16 months after construction starts, against 24 months in Europe and the US.
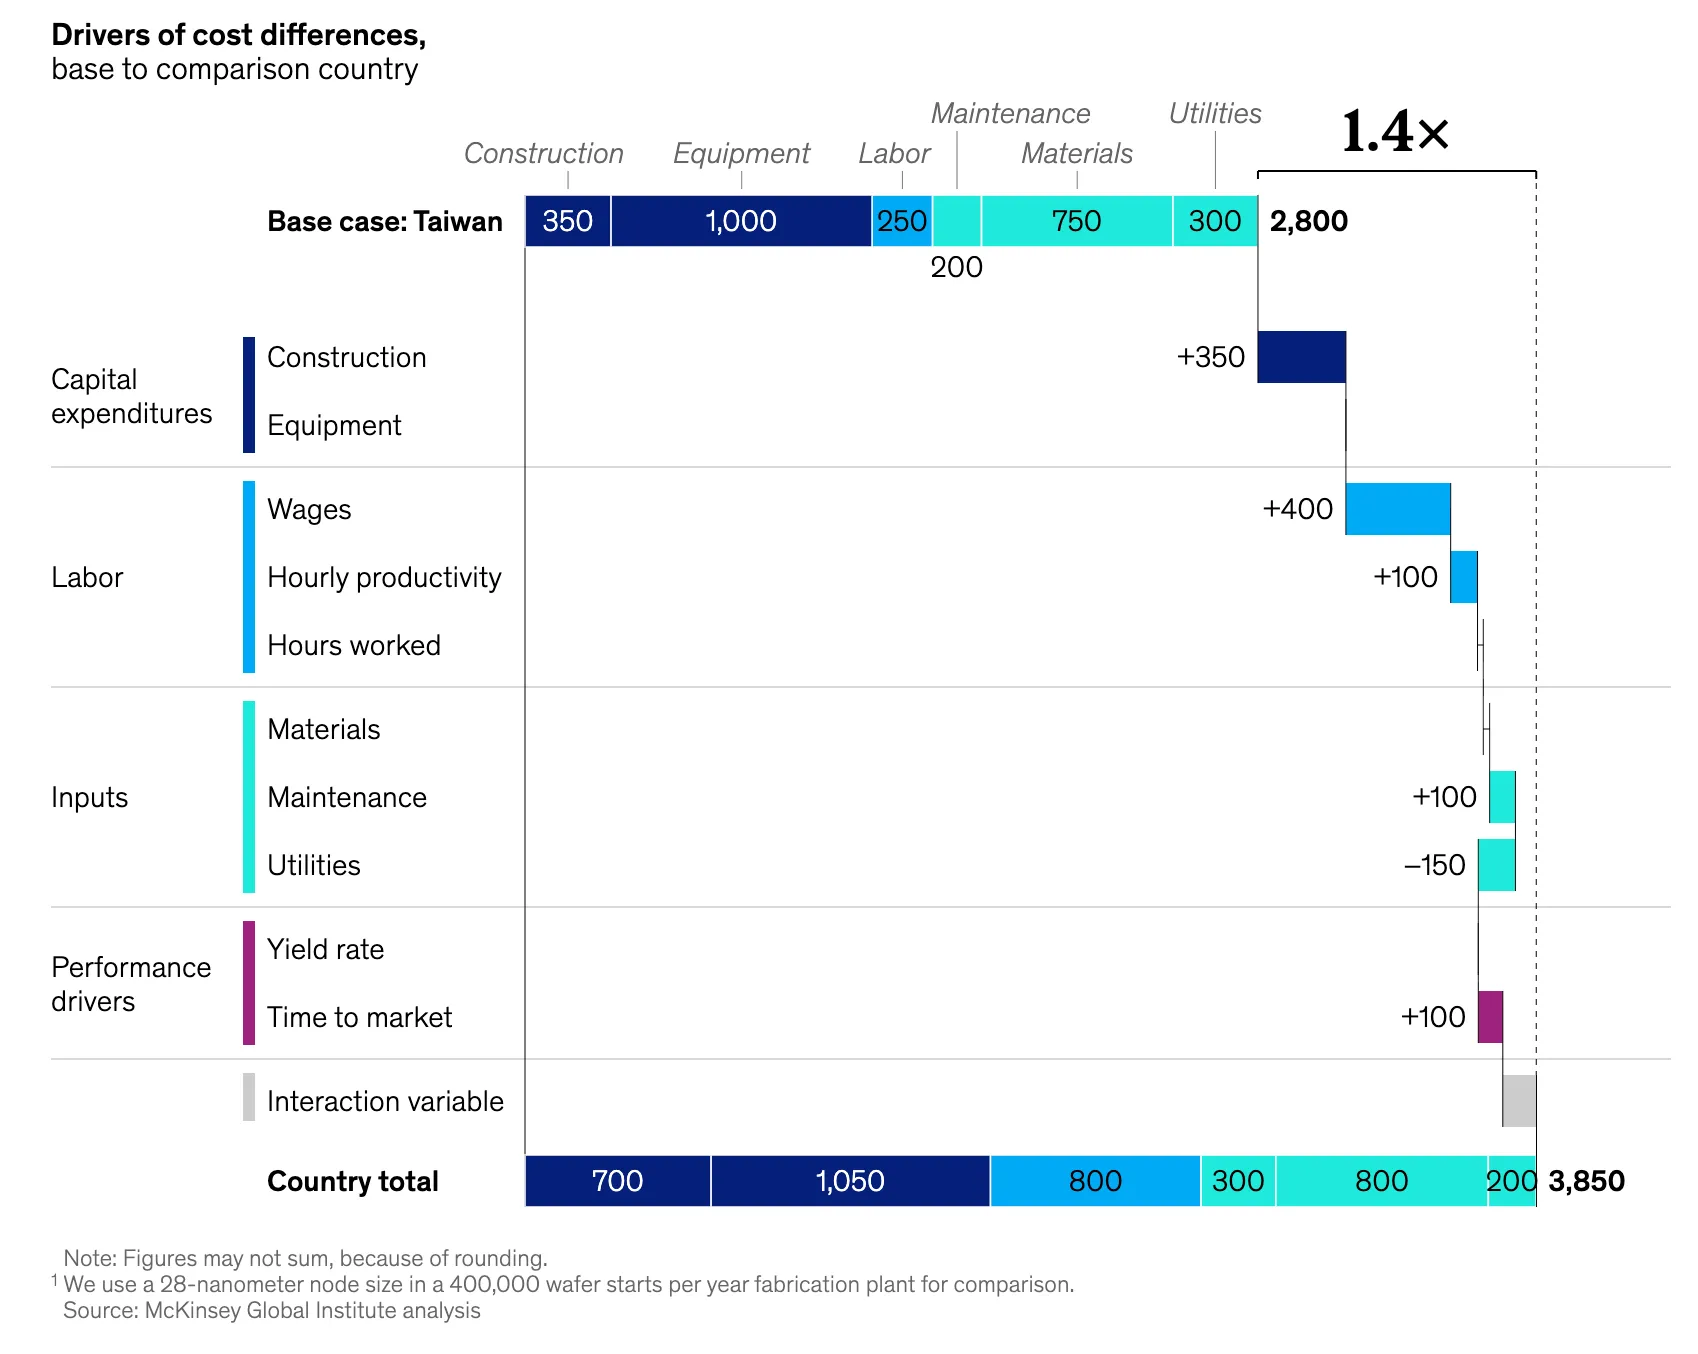
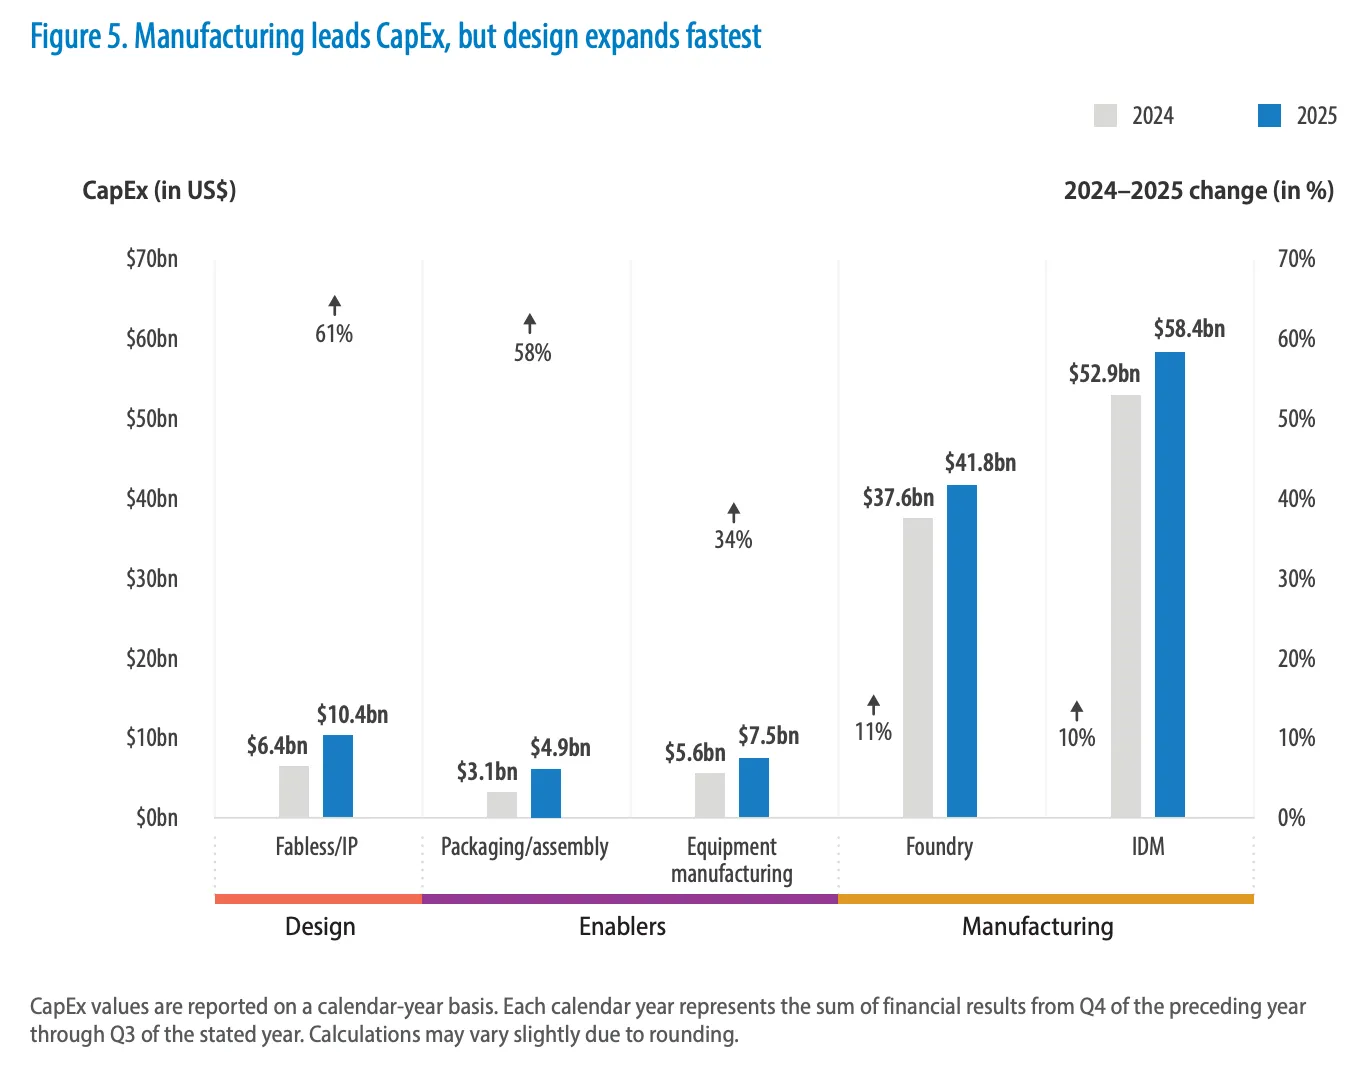
Timing compounds the cost. Producers in Taiwan and South Korea add capacity while a node sits at the technological frontier, capturing premium pricing, then run the same lines for years as yields improve and assets depreciate. A new advanced-node fab in Europe or the United States enters after that window has closed. Subsidy can close much of the gap: applying support comparable to the German package for the Dresden fab lowers modelled levelized cost from about US$4,000 to US$3,000 per wafer. Even so, mainland China, South Korea and Taiwan hold 60% or more of global capacity at every node size and are expected to attract over 55% of capital expenditure through 2029. The Americas are projected to become the largest single destination for chip capex in 2029, on resilience and policy grounds as much as economics.
Get research like this in your inbox
The week’s research that mattered, in five minutes. Joined by 2L+ investors.
What does the industry itself say it fears?
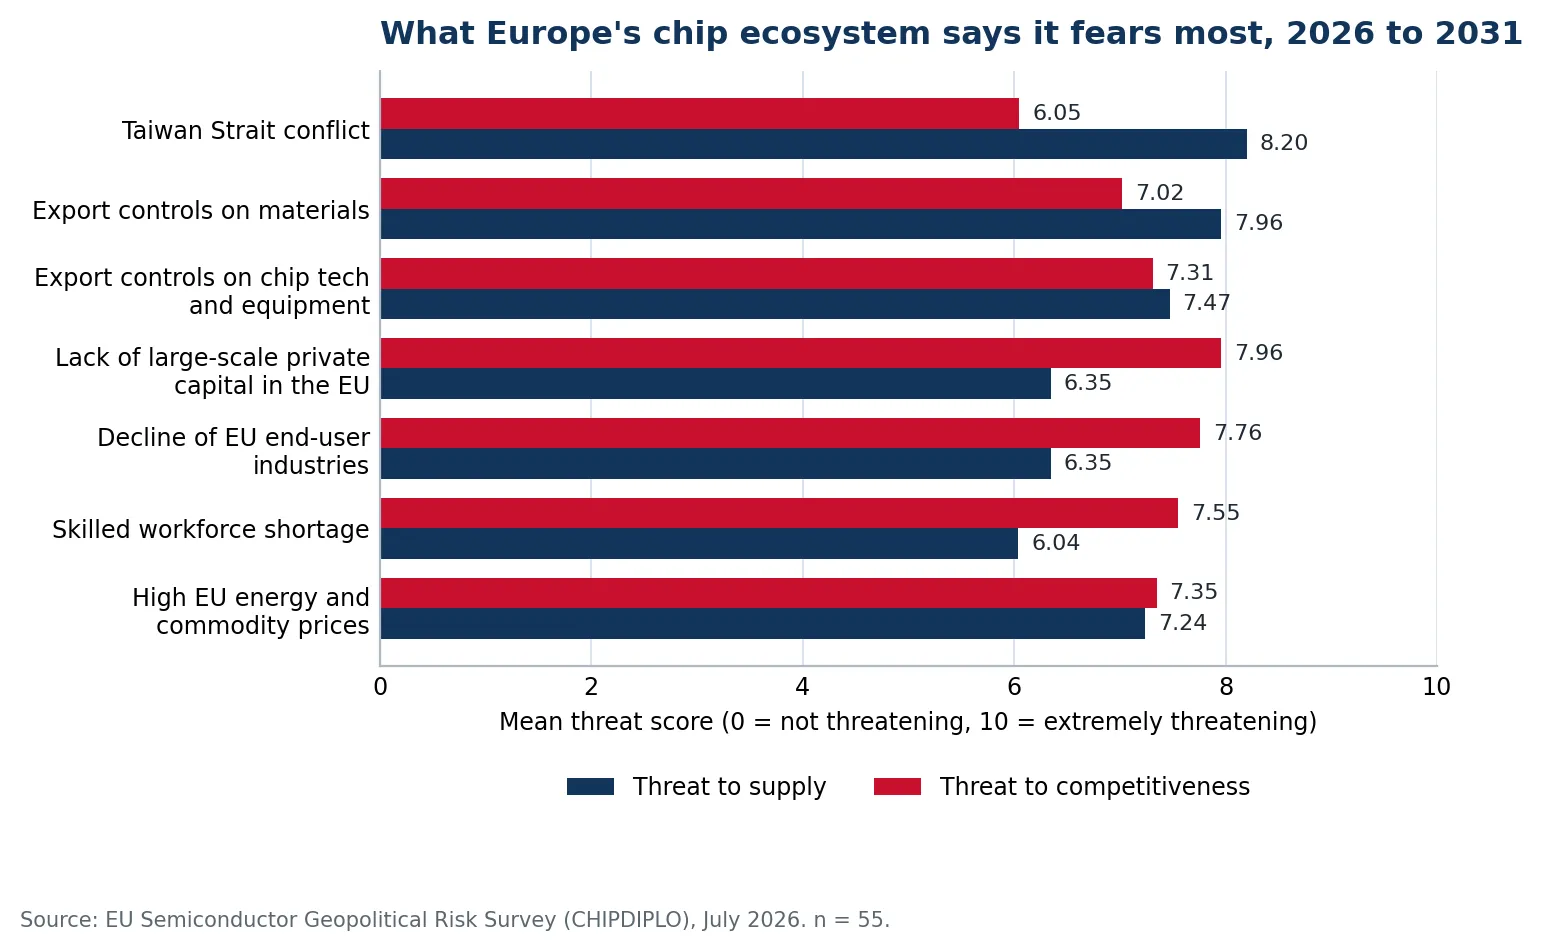
The EU Semiconductor Geopolitical Risk Survey, published in July 2026 by the CHIPDIPLO consortium, asked 55 industry representatives, policymakers and think-tank experts to score 20 threats to European semiconductor supply and competitiveness through late 2031. Ten of the 20 risks scored above 7 out of 10 on at least one measure. A Taiwan Strait conflict ranked as the single most dangerous individual risk at 8.20. Export controls on materials used against the EU followed at 7.96, and EU policymakers scored that risk at 9.00, the highest figure in the survey.
The competitiveness results point inward. The four highest-scoring threats to the European ecosystem are a lack of large-scale private capital, the decline of European end-user industries, a skilled workforce shortage and high energy and commodity prices. The implication for policy is direct: state aid, tariffs and reshoring produce capacity, and capacity requires customers, engineers and affordable power to become an industry.
Are alliances replacing self-sufficiency?
No country holds an entirely domestic chain, and the economics of building one are poor. The response has shifted toward pooling. Pax Silica, the US-led supply chain initiative launched in December 2025 with seven signatories, had expanded to 24 by its June 2026 summit in Washington, adding the European Union, Germany, the Netherlands, Greece, Kazakhstan and several Latin American economies. Taiwan participates without signing. The initiative covers critical minerals, energy, compute, advanced manufacturing and logistics, with an early project piloting a shipment credentialing platform through Panama's ports.
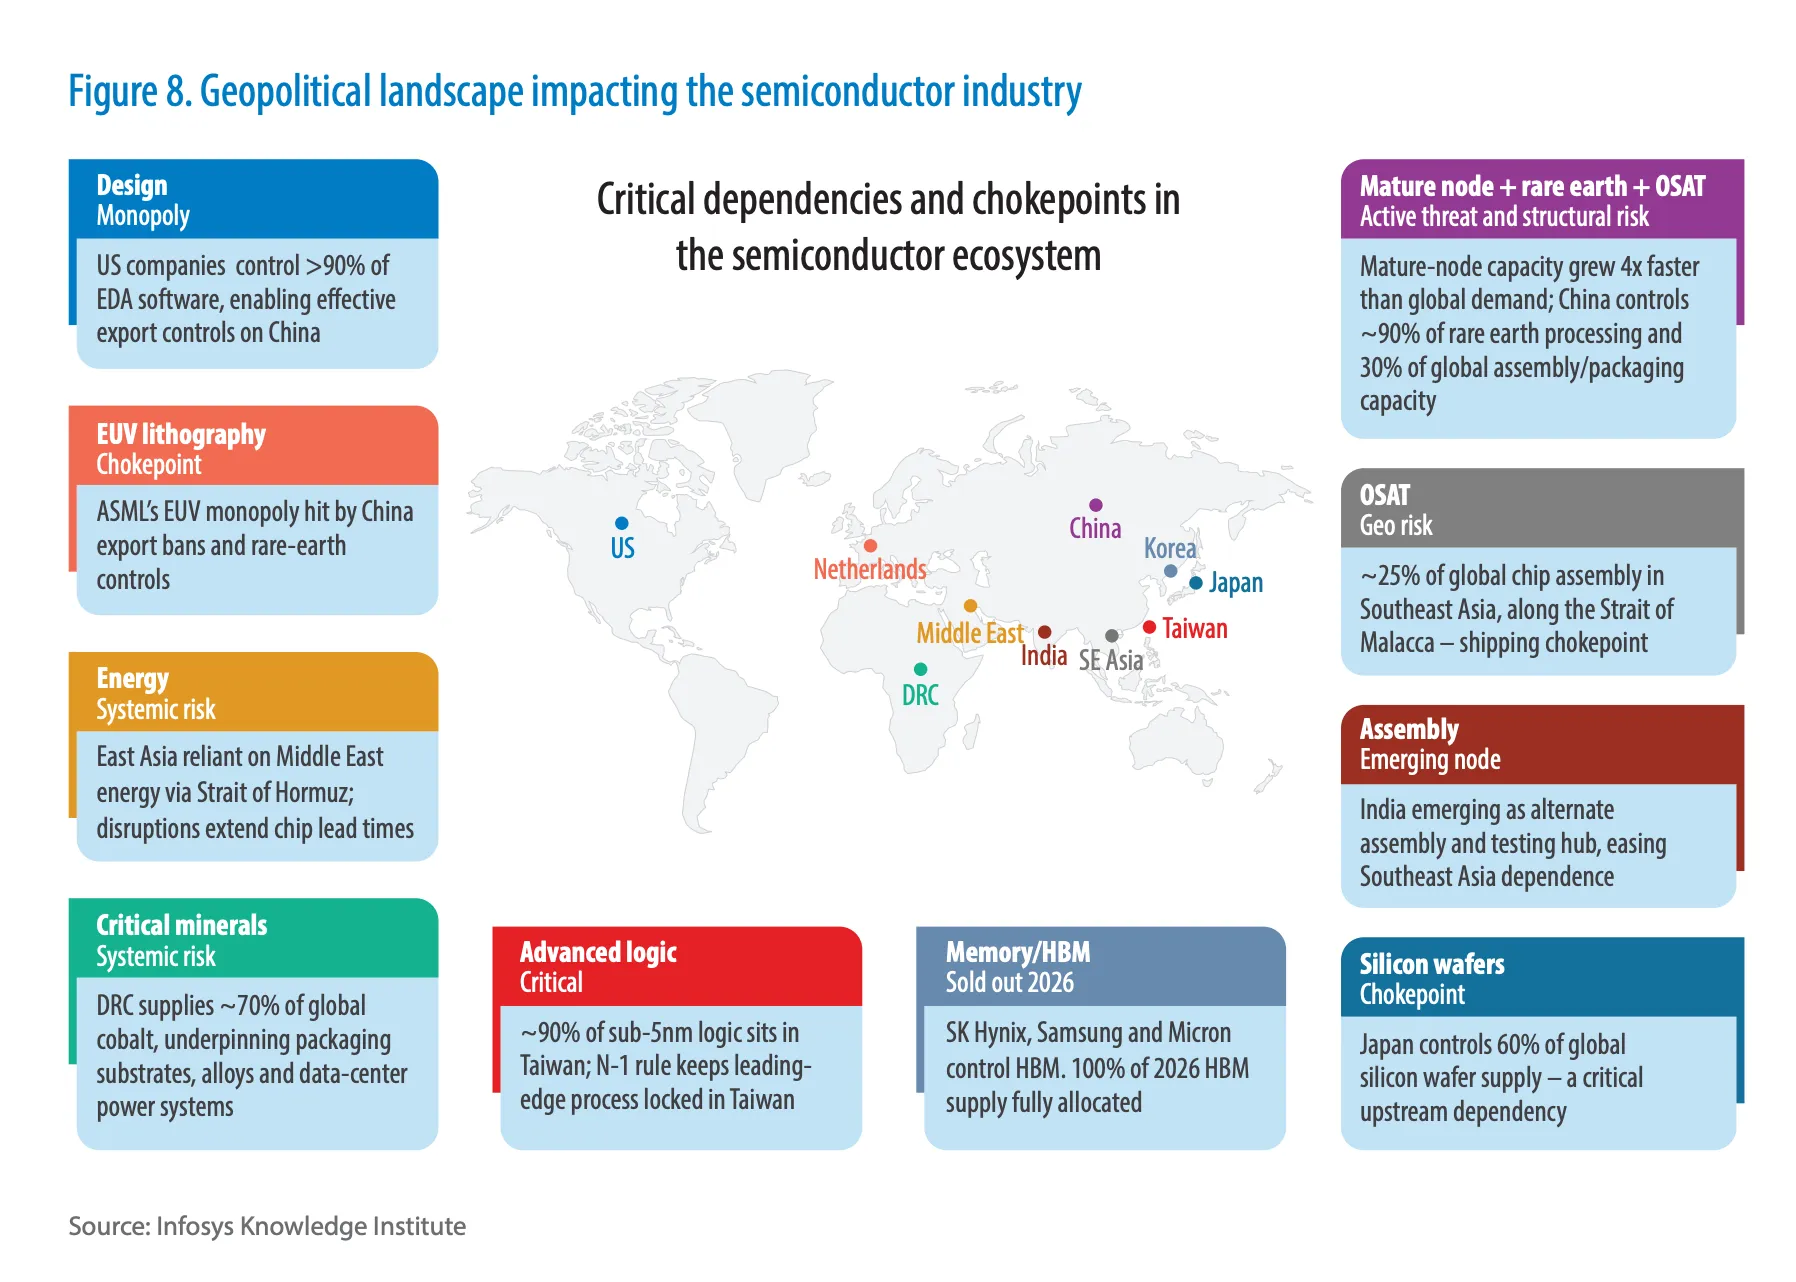
The logic behind such groupings is that dependence on Taiwan and China can be replaced collectively at a cost no single country would accept alone. It also carries a consequence: countries with limited intellectual property in the chain will increasingly have to align with one system, because extraterritorial rules on both sides are making compliance with both systems difficult.
What should success be measured against?
Market-share targets make poor yardsticks. The European goal of 20% of global chip production says nothing about which nodes that capacity serves or which functions those chips perform. A memory chip cannot substitute for a processor, and one fab cannot easily switch to a different chip type. Chips also require boards, packaging and assembly to become products, and advanced packaging talent remains scarce in the United States and Europe, which limits autonomy claims regardless of front-end capacity.
More useful questions are operational. Which chip functions can a bloc still obtain if Taiwan goes offline for six months? How many months of buffer exist for tungsten, rare earths and specialty gases? What share of back-end capacity sits inside aligned jurisdictions? How long does a permit-to-production cycle take? These are measurable, and they map to the disruptions that actually occur.
See what markets are pricing in
Live indices, sector moves and market breadth — the backdrop to every story we publish.
What happens when the cycle turns?
Demand for semiconductors is derived demand, dependent at present on data centre construction. Memory is the most cyclical part of the industry, and makers have kept capital spending restrained, with DRAM capex rising 14% to US$61 billion and NAND 5% to US$21 billion. A slowdown in AI monetisation, a power constraint on new data centres or a step change in model efficiency would each transmit quickly into chip orders.
A downturn would also test two financing systems against each other. China's state-led banking system has sustained loss-making firms through build-out phases. Market-financed ecosystems in the United States and Europe would face pressure to show returns on public money at precisely the moment returns look worst. The strategic question for the next five years is narrower than self-sufficiency and more answerable: which chips can a country still obtain on its worst day, and who decides.


