
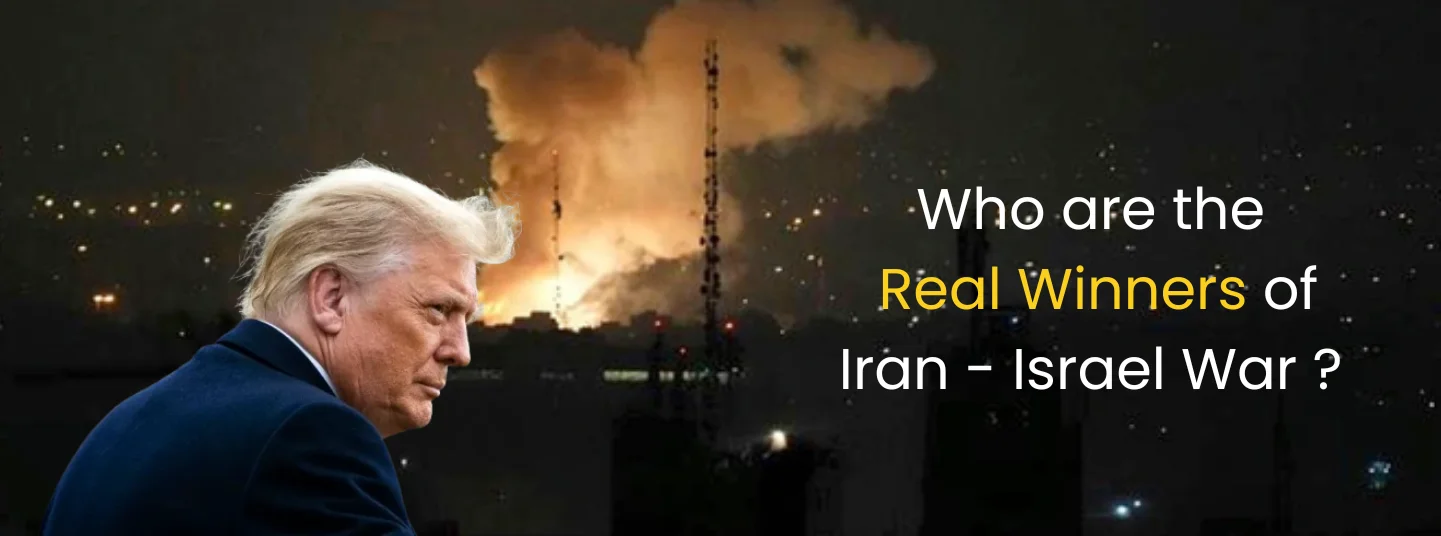
Since February 28, 2026, when Israel launched Operation Roaring Lion alongside the US's Operation Epic Fury, the Middle East has been engulfed in its most intense conflict in decades. Coordinated airstrikes targeted Iran's military command centers, nuclear facilities at Natanz and Fordow, missile silos, and leadership compounds in Tehran, resulting in the confirmed death of Supreme Leader Ali Khamenei and multiple IRGC commanders. Iran retaliated through Operation True Promise IV, launching ballistic missiles and drone swarms at Israeli cities and US bases in the Gulf. Hezbollah has activated from Lebanon, and the Strait of Hormuz through which 20% of global oil flows faces credible blockade threats. Analysts see no quick resolution: think tanks project 4–8 weeks of sustained escalation before possible UN-brokered ceasefire talks, though proxy activations and Iran's asymmetric capabilities could extend hostilities into summer. For global markets, this creates clear winners amid broad volatility.
Defence Contractors: The War Economy's Reliable Profiteers
No sector benefits more directly from modern warfare than defence primes, and the Iran conflict has sent their stock prices soaring. Lockheed Martin, prime contractor for the F-35 Lightning II stealth fighters that executed most precision strikes, saw shares climb 6.2% to all-time highs above $682 within days of the operation's launch. Each F-35 sortie burns through $10–20 million in advanced munitions like JASSM-ER cruise missiles and JDAM kits, creating immediate replenishment backlogs that flow straight to revenue. Northrop Grumman, responsible for the B-21 Raider bombers and next-generation missile defense systems deployed against Iranian counterstrikes, rallied 7.1% as NATO allies signaled accelerated procurement to match the new threat environment.
Company | Headquarters | Key Products in Play | Stock Move (Feb 28–Mar 5) |
Lockheed Martin | USA | F-35 fighters, HIMARS, JASSM missiles | +6.2% |
Northrop Grumman | USA | B-21 bombers, missile defense | +7.1% |
RTX Corporation | USA | Patriot systems, Tomahawks | +5.8% |
L3Harris | USA | Radar, comms for strikes | +4.9% |
General Dynamics | USA | Artillery, Abrams tanks | +5.2% |
Palantir | USA | AI targeting analytics | +8.3% |
BAE Systems | UK | Eurofighter upgrades | +3.7% |
Leonardo | Italy | Helicopters, drones | +4.1% |
RTX Corporation (formerly Raytheon), whose Patriot surface-to-air missiles and Tomahawk cruise missiles formed the backbone of layered air defenses, posted 5.8% gains. Their AN/TPY-2 radars have been working overtime tracking Iran's ballistic salvos, while SM-6 interceptors proved decisive in neutralizing inbound threats over Tel Aviv. L3 Harris Technologies and General Dynamics followed closely, up 4.9% and 5.2% respectively, as demand surges for tactical communications, artillery systems, and Abrams tank upgrades. Even beyond the US, Europe's BAE Systems benefits from Eurofighter Typhoon contracts, while Italy's Leonardo sees helicopter and drone orders accelerate through NATO pipelines. Palantir Technologies stands out with an 8.3% surge, as its Gotham and Foundry AI platforms process real-time targeting data across multiple theaters, proving indispensable for coalition operations.
This isn't speculation; these companies thrive on the military-industrial feedback loop. Every missile fired, every sortie flown, every radar pinged generates multi-year service contracts, software upgrades, and munitions restocking. Post-Iraq and Ukraine, defence budgets rarely shrink after major conflicts; they expand. NATO's European members, already committed to 2% GDP spending, now face internal pressure to hit 3% as Iran's degraded proxies threaten the continent indirectly.
Check the macro backdrop
GDP, inflation, rates and more — India’s key economic indicators in one dashboard.
Energy Upstream: Riding the Oil Volatility Wave
The conflict's economic centerpiece remains energy markets, where Brent crude has spiked over 15% to $92+ per barrel amid fears of Iranian supply disruptions and Hormuz chokepoints. Iran's 3.5–4 million barrels per day of exports roughly 5% of global supply face immediate jeopardy, redirecting demand to spare capacity holders. US shale producers emerge as primary beneficiaries. ExxonMobil and Chevron, with dominant positions in the Permian Basin, stand to gain $3–5 billion in annual profits for every sustained $10 rise in Brent. Their flexibility ramping output in weeks rather than years positions them perfectly to displace sanctioned Iranian crude in Asian markets like China and India.
Saudi Aramco quietly captures market share, targeting its Asian customers with reliable supply while positioning itself as the stabilising force against Iranian adventurism. UAE's ADNOC follows suit, leveraging its low-cost fields to undercut competitors. In India, where 85% of oil is imported, upstream players decouple from refining pain. ONGC benefits from higher natural gas realizations and its Krishna Godavari basin ramp-up, where every $10 crude increase translates to ₹15–20 per share in earnings accretion. Oil India Limited leverages similar dynamics, while Reliance Industries (energy vertical) sees refining cracks widen as heavy Iranian grades vanish from the global pool.
Stock | Why benefiting | Target upside |
ONGC | KG basin ramp-up; every $10 crude = ₹15–20 EPS boost | 20–25% |
Oil India | High gas leverage | 18–22% |
Reliance (energy arm) | Refining margins expand | 12–15% |
This isn't just a short-term pop. Prolonged Hormuz tensions force tankers rerouting through the Cape of Good Hope, spiking freight rates 30% and compressing global supply further. Non-OPEC shales and Gulf swing producers fill the gap profitably, while downstream refiners scramble.
Indian Market Pockets: Defence and Defensives Take the Lead
India's Nifty has corrected 2–3% amid risk-off flows, but targeted sectors rally on domestic tailwinds amplified by the crisis. The defence complex leads unequivocally. Hindustan Aeronautics Limited (HAL), with a ₹1.2 lakh crore order book spanning Tejas fighters, Su-30 upgrades, and helicopter lines, benefits from accelerated Atmanirbhar Bharat procurement. Government capex for FY26 jumped 20%, and geopolitical headlines justify emergency funding bypassing typical parliamentary delays. Bharat Electronics Limited (BEL) powers radar and electronic warfare systems, while Bharat Dynamics Limited (BDL) and Mazagon Dock see missile and submarine orders solidify.
Metals follow as war premiums lift industrial commodities Hindalco and NALCO gain from aluminium and bauxite dynamics tied to military aviation. IT majors like TCS and Infosys hold steady as defence forces, bolstered by rupee depreciation aiding export revenues. Gold financiers (Muthoot Finance, Manappuram) capture safe-haven physical demand, with XAU/USD up 5% and domestic jewellery intake surging.
India's strategic pivot accelerates: this conflict validates decades of defence indigenisation, turning long-term policy into immediate order flows.
Get research like this in your inbox
The week’s research that mattered, in five minutes. Joined by 2L+ investors.
Geopolitical Winners: Nations Repositioning for Power
Beyond companies, nations realign. Saudi Arabia and the UAE seize Iran's Asian crude franchise, bolstering petrodollar reserves and regional dominance. Russia diverts attention from Ukraine, selling discounted Urals crude to sanction-weary buyers while its defence exports to Iran proxies hum. China plays the long game, securing backchannel Iranian oil at discounts and positioning as diplomatic broker between Tehran and the West. The United States (energy sector) floods Europe and Asia with LNG, cementing post-Nord Stream energy leadership.
Israel achieves short-term strategic gains; its nemesis's nuclear program and command structure lie in ruins but faces economic drag from mobilisation and tourism collapse. Neutral Qatar and Oman, historically mediators, gain diplomatic heft.
Propaganda Machines and Indirect Windfalls
Wars amplify information battles that shape perceptions and markets. Iran's state media frames the strikes as "Zionist genocide orchestrated by CIA-Mossad riots," whitewashing internal crackdowns as foreign plots to consolidate hardliners. The US-Israel axis counters with "Iran's covert nuclear rebirth obliterated," muting ceasefire momentum and justifying follow-on operations. Social platforms buzz with "arms dealer enrichment" memes Lockheed's stock chart juxtaposed against peace talks questioning endless conflict incentives. Saudi leaks of "unlimited spare capacity" position Riyadh as the adult in the room, capping panic-driven price surges.
Indirectly, renewables get a tailwind as Europe fast-tracks offshore wind to escape Gulf volatility. Uranium miners like Cameco rally on nuclear renaissance narratives over unpredictable oil. Fertiliser giants ride grain price spikes from risk-off farmer hedging. Cybersecurity firms also anticipate Iranian retaliation hacks, posting early gains. Tanker owners watch freight rates soar from Hormuz avoidance.
Also Read : Decoding the Iran–Israel Conflict for Portfolios : Timeline, Markets, Oil Prices, Macro Transmission
See what markets are pricing in
Live indices, sector moves and market breadth — the backdrop to every story we publish.
The Bigger Economic Realignment
This conflict accelerates pre-existing trends. Defence industrial bases expand from US heartlands to India's assembly lines. Energy flows reroute from sanctioned producers to reliable majors. Safe havens reclaim flows from risk assets. While broad indices suffer drawdowns, narrow pockets compound through replenishment cycles, market share grabs, and policy accelerations.
The Iran–Israel–US war underscores a timeless truth: conflict creates concentrated winners amid diffuse pain. Defence primes restock arsenals. Shales pump harder. Nations reshuffle alliances and supply chains. For observers, the lesson lies in identifying these fault lines early before headlines shift and opportunities fade.
As the dust settles on the Iran–Israel conflict's early battlefields, one reality stands clear: wars forge concentrated winners while punishing broader markets with volatility and uncertainty. Defence giants like Lockheed Martin and HAL restock arsenals at record valuations, upstream energy majors seize supply gaps amid soaring Brent crude, and nations like Saudi Arabia and US shale producers cement long-term market share dominance. Indirect tailwinds lift gold financiers, cybersecurity firms, and even renewables as global supply chains realign.In the end, spotting these fault lines early defence replenishment cycles, energy rotations, safe-haven flows separates those who navigate chaos from those swept away by it.


