In 2023, the Indian equity market demonstrated notable growth, surpassing most of its global counterparts. This surge was primarily led by companies with low float stocks and those capitalizing on government expenditures, which significantly outpaced the major indices. Stock markets have also exhibited a pattern of marginal new highs followed by periods of consolidation, a trend observed notably in the last couple of months till January 2024. There was an unusual rally of 14% during November and December, a rare occurrence post the global financial crisis, fueled by anticipations around the Federal Market Committee's policy pivot and political developments following the BJP's significant electoral wins.
With market segments moving rapidly, high liquidity levels have pushed prices to new highs, instilling a fear of missing out (FOMO) among investors. This environment has made comprehensive research increasingly challenging and costly, prompting investors to make hurried decisions often based on insufficient or absent research. This trend, emblematic of a bull market, risks populating investor portfolios with lower-quality stocks, a misstep that could prove costly when the market eventually shifts.
Quick Overview Of Indian Stock Markets In FY24
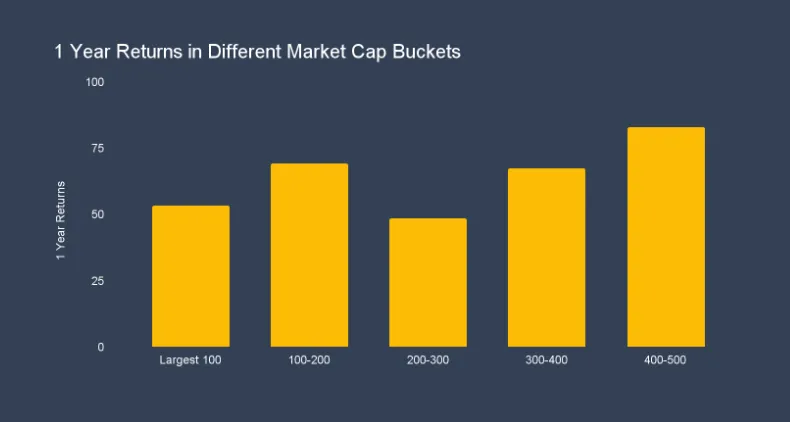
The stock market rallies of 2023-24, which occurred on a relatively high base, has now led to a shift in market dynamics, with debt markets adjusting to a "higher for longer" interest rate environment. In the last 1 year, the largest 100 companies showed the least returns, with smaller companies showing higher returns especially within the 400-500 market cap bucket showcasing the highest returns over the period. Out of 367 companies whose share prices have more than doubled, 80% fell into the small-cap category. This surge is not merely a reflection of market speculation but is substantiated by a continuous influx of domestic capital, a trend that gained momentum post-Covid without experiencing a substantial drawdown.
A critical factor driving this growth is the relationship between a company's free float market capitalization and its stock returns. Data shows a clear pattern: the lower the free float, the higher the stock returns, with a significant number of companies doubling their share price in the last nine months. This phenomenon is largely fueled by new investments, with retail investors and mutual funds predominantly owning small-cap stocks, leading to what can be described as a Nifty-like rally in the small-cap segment.
Despite the flat performance of the Nifty in January, the BSE 500 tells a different story, with the 20th best performing stock up by 35% and the top performer by 74% in just one month. The BSE-PSU index's rally of almost 60% since November further underlined the market's bullish sentiment, till it wasn’t there. This broad-based rally suggested a market that has potentially reached an overvalued state, poised for correction. As we move forward to February & March 2024, we see that the corrections have started with smallcaps & midcaps facing the brunt of it along with PSU stocks. We also see the March effect playing out for several reasons such as tax loss harvesting .
The question on most investors' minds is what could trigger a market correction? Several factors serve as positive triggers, including political stability, benign interest rates, and historically low foreign institutional investor holdings. However, history has shown that markets often need only minor reasons to correct from unsustainable levels. Past events, such as the implementation of long-term capital gains tax and mutual fund realignments, have triggered significant market adjustments.
Indian Stock Market Valuations At All Time High…?
When we look at the valuation across large, mid, and small-cap segments from December 2014 to February 2024, it has varied but we see a trend:
Large-cap valuations appear to have been more stable over the years
While mid and small-cap companies have experienced more volatility in their valuations
As of February 2024, mid-caps seem to have the highest valuation, followed by small and large caps. Now this highlights an atypical valuation trend - usually large-caps have the highest valuation, followed by mid-caps, small-caps, and micro-caps. This could be an indicator of excesses in the market, suggesting a divergence from traditional valuation metrics which typically correlate company size with valuation.
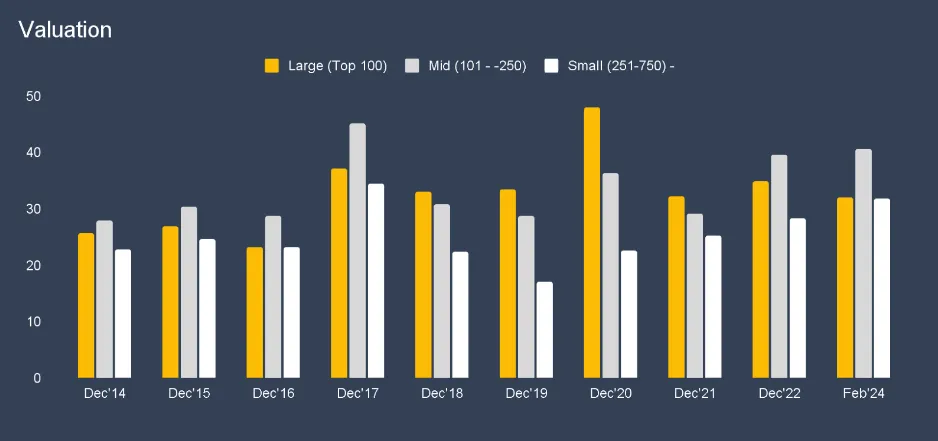
Looking at historical data, current valuation multiples mirror those observed during the 2017 market peak and are significantly higher than the 10-year average for non-large cap stocks. Despite this, the gap between large-cap and small-cap stocks has narrowed, coinciding with an improvement in return on equity (ROE) and other financial metrics for the small-cap segment, a likely aftermath of post-COVID recovery efforts in balance sheet, working capital, and cash flow improvements. So while, valuations are definitely high there seems to be enough growth in fundamentals for companies & the country to be able to justify it.
Read this article to learn more about Decoding the March Effect: Why Stocks Can Be Volatile in March & the Buying Stocks in October, November & December? Seasonal Patterns in Global & Indian Stock Markets
Let’s understand low float stocks & high float stocks first
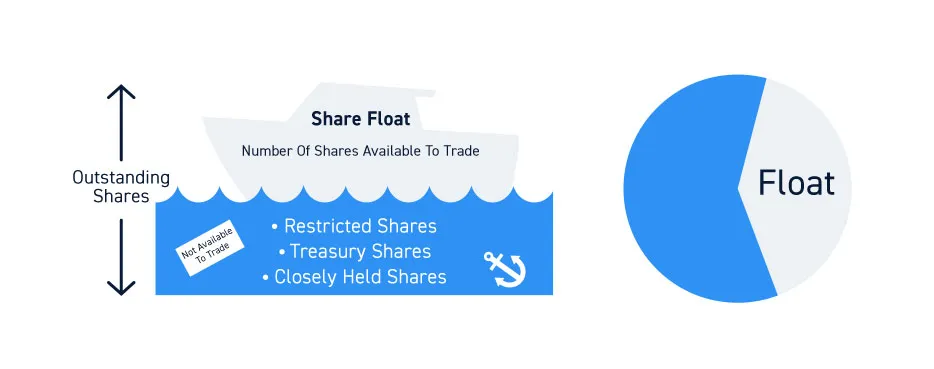
What are floating stocks?
Before we jump any further, let’s first understand what low float stocks & high float stocks are and what does float mean. Floating stocks represent the portion of a company's outstanding shares that can be traded by the public. Not all outstanding shares qualify as floating stocks; insider shares, which are restricted or held closely by company insiders, are excluded. This makes floating stocks a critical indicator for assessing a company's market position, offering insights into the stock's liquidity and volatility.
The Significance of Low and High Stock Floats
What are Low Float Stocks?
Low float stocks refer to shares of a company that have a relatively small number of shares available for public trading. Low float stocks arise when there's a limited number of shares available for trading, often because insiders own a significant portion. And because the supply of low float stocks is limited, low float stocks can experience higher volatility due to the difficulty in finding buyers or sellers. This volatility can deter investors and indicate potential liquidity issues, making these stocks less attractive for short-term trading.
Risks of low float stocks
- The high volatility associated with low float stocks can lead to significant losses if the stock price moves unfavorably.
- Low liquidity can result in wide bid-ask spreads, making it challenging to execute trades at desired prices.
- Due to their susceptibility to price manipulation, low float stocks can be more vulnerable to pump-and-dump schemes.
Rewards of low float stocks
- Investors may achieve substantial returns if they can capitalize on the significant price movements.
- Low float stocks can provide unique opportunities for investors willing to accept higher risks for potentially higher rewards.
What are High Float Stocks?
High float stocks refer to shares of a company that have a large number of shares available for public trading. High float stocks suggests a larger volume of shares available for trading, leading to lower volatility thanks to the presence of more participants in the market.Because there are many shares available for trading, high float stocks tend to be less volatile and more stable compared to low float stocks. High float stocks tend to offer better liquidity, making them more appealing to investors.
Risks of high float stocks:
- High float stocks may not experience the dramatic price movements that can lead to substantial short-term gains, which may be less appealing to speculative traders.
- These stocks can be more susceptible to market trends and broader economic factors due to their wide ownership and trading activity.
Rewards of high float stocks:
- The lower volatility and higher liquidity make high float stocks more attractive for long-term investors seeking steady growth and income.
- High float stocks are typically more resilient to price manipulation and can offer more predictable performance based on fundamental analysis.
The Impact of Floating Stocks on Investors
For individual investors, especially those involved in mutual funds and ETFs or those focused on long-term investments, floating stocks might not have a direct impact. The primary concern for these investors should be the company's future prospects and performance. However, for direct stock investors & traders, the float becomes significantly more relevant due to its influence on stock volatility and liquidity. Investing in stocks with low floats can lead to challenges in selling at desired prices, whereas high float stocks may offer more stability and easier exit opportunities.
Inverse Relationship of Stock Returns to Their Float Levels
A significant portion of equity inflows had been directed towards these lower free float segments which have outperformed in the equity market in 2023-24. There was a notable drop in delivery value in October 2023 compared to September, with large-cap stocks remaining stable in their delivery volumes. This trend mirrored the mid-cap rally of 2017, which was followed by a notable decline in 2018. Interestingly, there's been a noticeable inverse correlation between stock returns and their float levels, with valuation levels in the broader market (excluding large-cap stocks) reaching peaks not seen since previous market highs. This consensus is widely acknowledged across the financial community, including warnings from the Association of Mutual Funds in India (AMFI) , economists, and fund managers, raising the question of whether it's time for investors to exit or adjust their strategies.
Read this article to Understand SEBI's Advisory on Small Cap & Large Cap Mutual Fund Inflows
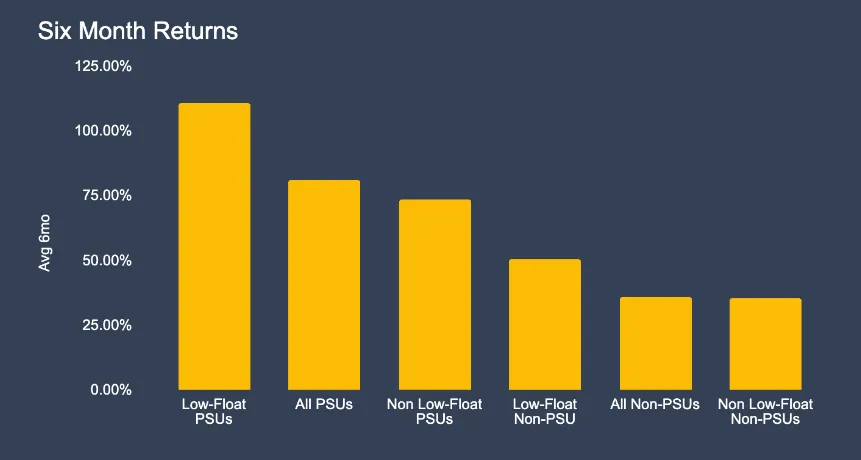
Let’s look at the 6 month returns across different groups of stocks: low-float PSUs, all PSUs, non-low-float PSUs, low-float non-PSUs, all non-PSUs, and non-low-float non-PSUs. The standout performers are the low-float PSUs, which have the highest average returns, significantly outperforming the other groups. Low float PSUs have seen extraordinary growth of 110.7%, which is significantly higher than their non-low float counterparts at 35.7%. This trend continues from a longer two-year perspective, with low float PSUs surging 254.2%, more than double the performance of non-low float non-PSUs.
The earnings growth for PSUs does not entirely align with their returns, indicating that the market returns for PSUs are outpacing fundamental growth, pointing towards an expansion in valuation multiples rather than solely earnings-driven growth. This aligns with the broader market observation that low-float stocks have seen substantial gains, possibly due to increased speculative trading in these stocks or a perceived undervaluation relative to their fundamentals.
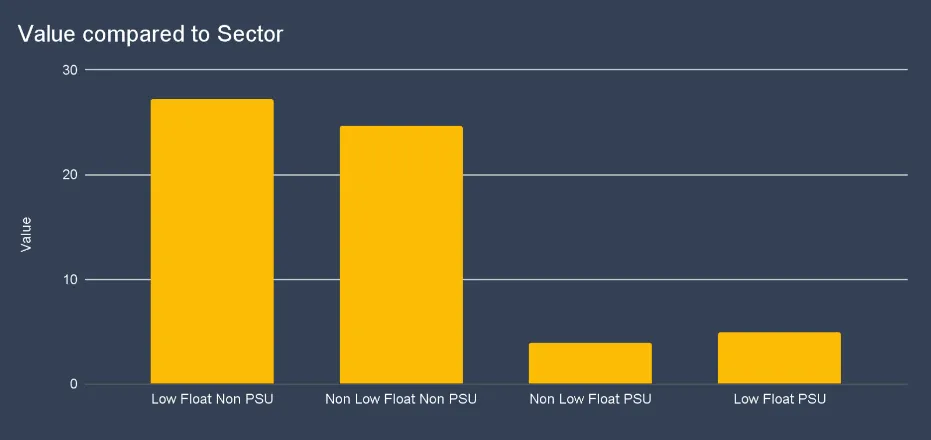
The sharp rise in valuation multiples, particularly for low-float PSUs, is notable. With price-to-earnings (PEx) ratios increasing by 2.8 times and price-to-book (PBx) ratios by 4.4 times, there's clear market enthusiasm for these stocks, which now surpass valuation multiples seen in the FY02-08 bull market. Let’s compare the value of low float non-PSUs, non-low float non-PSUs, non-low float PSUs, and low float PSUs to their respective sectors. Here, low float non-PSUs show the highest value relative to their sector while low float PSUs have the lowest value relative to their sector. This could be a result of the same speculative trading or over-enthusiasm by investors expecting higher growth or returns.
Our Longer Term Outlook on Indian Stock Markets
So, has the valuation for Indian stock markets peaked? Last month's equity fund inflows of Rs 22,000 crore have contributed to pushing market indices to new peaks. This growth is not just due to the influx of funds; it reflects broader economic health. Valuations, while above average, have not reached the peak levels of the 2000s, 2007 or 2018.
The fundamentals of Indian companies are matching their market valuations, with a significant compounded annual profit growth of 15-20%. The ratio of profit growth to GDP is robust at 4.9%, indicating a healthy correlation between corporate performance and the overall economy. Additionally, the banking sector shows marked improvement, having substantially provisioned for non-performing assets (NPAs). The current market condition could be described as a 'Goldilocks' scenario: domestic & foreign bullish investment flows , investor sentiment barring the recent corrections are largely positive, strong fundamentals, valuations are somewhat high but justified by the profit margins. This alignment of positive indicators is a rare and favorable situation for the market.
What should Investors do in current high valuation markets?
Investors should adhere to their asset allocation strategies that align with their risk appetites, instead of following short term market momentum or mimicking others' investment decisions. It's important to invest with a long-term perspective especially when you are investing in direct equity markets. And on a longer term horizon your outlook on Indian markets becomes important, and whether markets have already priced it in their valuations.
Concerning potential bubbles in small and mid-cap investments, while it may be premature to label the situation as a bubble, caution is warranted. The disparity between fair value and market prices is not excessively wide currently, but investors should be particularly careful with stocks that have limited free float, as they are more vulnerable to price swings due to low liquidity. And we have seen this happen with PSU rally and now the PSU corrections.
Regulatory bodies like SEBI and AMFI have already issued guidelines to protect investors in small and mid-caps mutual funds , signaling the need for prudence in these segments. The advice is to set realistic return expectations and avoid short-term horizons. Instead of lump-sum investments, systematic investment plans (SIPs) are recommended to mitigate risks and potentially yield better long-term results. This approach aims to temper investor enthusiasm and encourage commitment to a full investment cycle for more favorable outcomes.
7 Month Update: Stocks of 2024, Performance & Huge Launch
Join the Wright PMS Team with Sonam Srivastava ,Founder of Wright Research & Siddhart Agarwal to look at the 7 Month PMS Performance Update. The team will cover the following topics:
💰 Wright PMS portfolios 7 Month live performance in the stock markets
💰 Stock Market's highs & lows - what is going on in Indian & global stock markets?
💰 What to expect in 2024? How will your investment portfolio change in 2024?
💰 Best practices for managing & maintaining a strong portfolio in the current market
💰 BIG PMS Update: New Launch!
As always, Sonam & Wright PMS team will answer all your questions live and clarify any doubts you may have about Wright PMS, Smallcase, Performance of our portfolios, Market Update & more. We will give you a full overview of all our PMS portfolios, how are they have performed since launch, what to expect going forward, and much more! ⚡
If you are interested in PMS, this 1 hour session will equip you with the knowledge and insights to navigate the investing landscape and leverage the potential of your investments.
📈 7 Month PMS Update
⚡ Sonam Srivastava, Siddhart Agarwal
🗓️ Start Date: 17th March
🕚 Timing: 11:00AM
Add the questions you want us to answer in this 7 month PMS update, here 👇
Join our Telegram Channel to get daily morning market updates. Subscribe to our Youtube Channel to learn about all things investing, understand sector performance, get key insights into new topics like concentrated portfolio, quantitative investing and more!
Our Investment Philosophy
Learn how we choose the right asset mix for your risk profile across all market conditions.
Subscribe to our Newsletter
Get weekly market insights and facts right in your inbox