by Siddharth Singh Bhaisora
Published On May 18, 2025
The southwest monsoon is the lifeblood of Indian agriculture, particularly for the Kharif season, during which crops like rice, pulses, cotton, and maize are sown. A timely and strong onset allows for early sowing, improved crop planning, and higher yields, significantly reducing reliance on groundwater for irrigation. It also helps mitigate the risks posed by late-season erratic rainfall, which often damages maturing crops.
IMD has forecast an early onset of the southwest monsoon over Kerala on May 27, a full 5 days ahead of the normal onset date of June 1. With a model error margin of 4 days, this early arrival may appear as just a climatological update to the casual observer. However, for millions of Indians-especially farmers and rural households-this forecast is a signal of renewed economic hope. The monsoon’s early onset and the forecast for above-normal rainfall during the June to September period are being closely watched by economists, policymakers, and industry leaders. This development is particularly crucial at a time when rural consumption is under stress, and the broader economy is looking for engines of growth beyond urban consumption and industrial output.
India, often referred to as a land of agriculture, has a deep-rooted agricultural tradition and remains one of the world's top producers of food grains. The agricultural sector continues to be the backbone of the Indian economy. More than 40% of India’s workforce is employed in agriculture, and nearly 46% of domestic demand arises from rural areas. This means that a strong monsoon doesn’t just improve food output-it revives rural demand for goods, services, housing, and transportation, setting off a positive multiplier effect across the economy.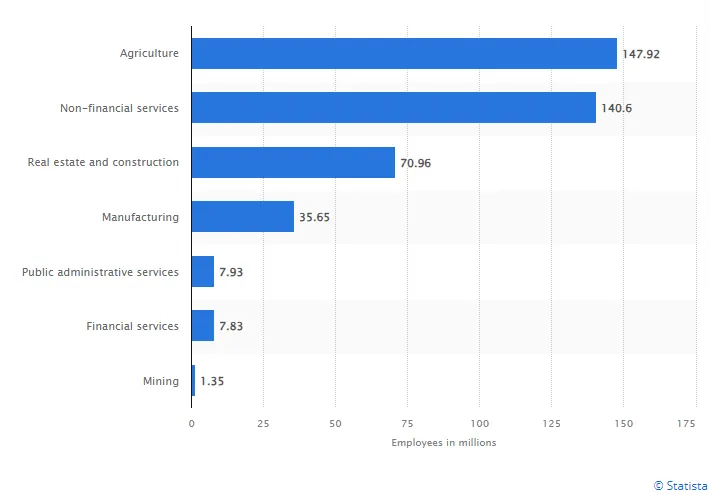
As per FY 2023 data, agriculture tops the list of employment providers across all major sectors with nearly 60% of India’s workforce employed by this sector. This reflects the sector’s enduring relevance in a rapidly modernizing economy. A large section of India's population, particularly in rural areas, depends directly on farming for their livelihood.
In 2024, India recorded 108% of the Long Period Average (LPA) rainfall-934.8 mm compared to the average of 868.6 mm-marking the highest rainfall in four years. This helped farmers sow more crops and supported broader rural economic activity. In 2025, IMD projects above-normal seasonal rainfall, estimating it to be 105% of the LPA (87 cm), with a 59% probability of rainfall being either above normal (33%) or excess (26%).
Stronger rainfall and better monsoon is generally considered positive for agriculture and, by extension, rural consumption and the broader economy. However, market performance data over the past two decades tells a more nuanced story.
Year | Actual Rainfall | SENSEX Returns |
2002 | Deficient Monsoon (i.e. <90% of LPA) | 3.5% |
2004 | Below Normal (i.e. 90-95% of LPA) | 13.1% |
2009 | Deficient Monsoon | 81% |
2011 | -25% | |
2014 | Deficient Monsoon | 25.7 |
2015 | Deficient Monsoon | -5% |
2016 | Below Normal | 2% |
2018 | Below Normal | 6% |
2009: Despite receiving only 78% of the LPA - a significantly deficient monsoon - the S&P BSE Sensex soared by 81%, recovering sharply from the global financial crisis.
2014: Rainfall was just 88% of LPA, yet the Sensex climbed 30%, buoyed by a historic political shift as the Modi government came to power with a strong mandate, boosting investor sentiment.
2016: The monsoon was nearly normal at 97% of LPA, but the market barely moved, posting just a 1.95% return. The major economic disruption came in the form of demonetization, which severely impacted liquidity and consumer demand.
2011: This year received 102% of LPA - technically excess rainfall - yet the Sensex fell by 25%, reflecting global and domestic economic concerns that overshadowed favorable weather.
These instances show that while monsoon data can influence certain sectors (like agriculture, FMCG, or rural finance), it is rarely the sole determinant of market direction.
An analysis of Nifty returns during the monsoon period (June to September) from 2013 to 2023 highlights a recurring pattern: there is no consistent relationship between actual rainfall and stock market performance. Despite conventional wisdom linking strong monsoons with positive market outcomes, the data tells a more complex story:
Below-normal rainfall years such as 2014 (10.2%), 2021 (13.1%), and 2023 (5.62%) saw strong Nifty returns, challenging the assumption that poor monsoons dampen market sentiment.
Conversely, above-normal rainfall years like 2013 (-4.2%) and 2019 (-3.8%) delivered negative returns, suggesting that favorable weather does not guarantee bullish performance.
Only 2020, with above-normal rainfall and a 17.4% return, aligned with the expected pattern.
Year | Actual Rainfall | NIFTY Returns (June-Sep) |
2013 | Above Normal | -4.2% |
2014 | Deficient Monsoon | 10.2% |
2015 | Deficient Monsoon | -5.8% |
2016 | Below Normal | 5.5% |
2017 | Below Normal | 1.7% |
2018 | Below Normal | 1.8% |
2019 | Above Normal | -3.8% |
2020 | Above Normal | 17.4% |
2021 | Below Normal | 13.1% |
2022 | Below Normal | 3.1% |
2023 | Below Normal | 5.62% |
Over the 11-year period:
8 years had below-normal rainfall/ deficient monsoon, yet 6 of those years recorded positive Nifty returns.
3 years had above-normal rainfall, but 2 of them saw market declines.
This indicates that while monsoons remain crucial for agriculture and rural consumption, market returns are driven more by macroeconomic factors, investor sentiment, and policy actions than by rainfall alone.
Quantitatively, the correlation between monsoon rainfall and stock returns has been weak or even mildly negative in recent decades. An analysis found that, the correlation between monsoon rainfall (June–Sept total) and the calendar-year Sensex returns is around –0.27 i.e. historically the market and rainfall have tended to move in opposite directions (i.e. deficient monsoon years often saw decent market performance, whereas years with very good monsoons sometimes coincided with poor market returns). However, the magnitude of –0.27 is quite low (on a scale of –1 to +1), suggesting no strong linear relationship. In other words, Indian equity returns show a very limited dependence on monsoon variance over the years.
Declining Agricultural GDP Share: Agriculture’s contribution to India’s GDP has fallen from ~25% in the 1990s to about 18% in recent years. While the monsoon still critically affects farmers and certain industries, the overall economy is more diversified now. Sectors like services and manufacturing dominate the stock market indices, and they are less directly dependent on rainfall. This dilution of agriculture’s weight means a poor monsoon today has a smaller impact on aggregate corporate earnings than it might have decades ago.
Policy and Irrigation Buffers: India has improved its food grain buffer stocks, irrigation coverage, and contingency plans for droughts over time. Government policy responses (subsidies, rural employment programs, monetary easing in drought years, etc.) often mitigate the economic damage of a weak monsoon. For example, even when rainfall is deficient, timely government interventions and better irrigation can prevent a total collapse in rural demand. This can help stabilize investor confidence, preventing a monsoon-driven market crash. As one study noted, better irrigation infrastructure and technology adoption have “contributed to reducing the impact of monsoon” shocks on both agriculture and the stock market.
Market Anticipation and Global Factors: The stock market is forward-looking and absorbs a multitude of news. Often, by the time the actual monsoon outcome is clear (by August/September), the market may have already priced in expectations or moved on to focus on other prevailing issues (global recessions, oil prices, elections, etc.). For instance, in 2009 and 2014 the bullish market momentum from global/local factors easily outweighed the negative of deficient rains. Conversely, in a year like 2011, despite adequate rains, the market was overwhelmed by global risk-off sentiment. This aligns with academic research finding no significant linkage between rainfall and stock index volatility – any impact of weather tends to be swamped by other variables in many years.
Short-term Sectoral Rotation: Within the market, certain monsoon-sensitive sectors do react to rainfall variability even if the broad indices don’t show a big net effect. For example, agriculture-allied sectors (tractors, seeds, fertilizers), fast-moving consumer goods (FMCGs) with large rural sales, and automobiles (two-wheelers, entry-level cars) often get a boost from a good monsoon or face headwinds in a bad monsoon. Empirical evidence shows a close link between rainfall and performance of some companies – e.g. in the drought year 2009-10 (rainfall 22% below LPA), Hindustan Unilever’s sales fell 13%, whereas in 2007-08 (rainfall 6% above LPA) HUL’s sales jumped 17.6%. Likewise, demand for tractors and rural credit growth tend to improve after a healthy monsoon. These micro-level impacts do occur, but they may cancel out at the index level (since listed indices also include sectors like IT, pharma, oil & gas, etc., which are monsoon-agnostic or even benefit from lower commodity prices in a poor monsoon). The net market effect is thus muted or idiosyncratic to each year.
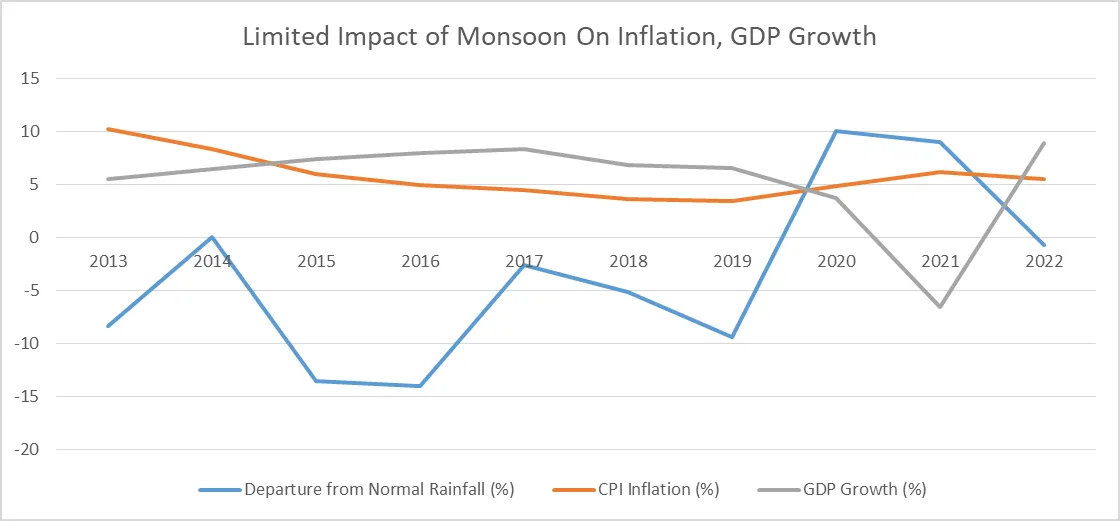
In India, where nearly 50% of the workforce is dependent on agriculture, and a large share of food production remains rain-fed, the monsoon may have played a critical role in determining food prices historically. However, recent analysis suggests that the role of monsoons in directly influencing key economic indicators such as Inflation - especially in the short term - may be less significant than traditionally believed.
Year | Departure from Normal Rainfall (%) | Foodgrain Production (MT) |
2013 | -8.4 | 257 |
2014 | 0 | 252 |
2015 | -13.6 | 252 |
2016 | -14 | 275 |
2017 | -2.6 | 285 |
2018 | -5.2 | 285 |
2019 | -9.4 | 297 |
2020 | 10 | 308 |
2021 | 9 | 310 |
2022 | -0.7 | 315 |
Despite erratic rainfall in the financial years 2017 to 2019, India’s foodgrain production continued to rise. This trend points to the growing resilience of the agricultural sector, largely due to expanded irrigation infrastructure. The Reserve Bank of India (RBI), in its May bulletin, highlighted that improved irrigation has helped India become more food-secure and less reliant on monsoon patterns.
Interestingly, RBI's data analysis suggests that agricultural output is more sensitive to the net area sown than to rainfall levels. A major shift in monsoon intensity can affect agricultural growth, but a relatively small change in sown area can have a nearly equivalent impact. While deficient monsoon rainfall may not immediately influence inflation, the effects could emerge with a delay. The timing and distribution of rainfall are crucial-crops require rain at specific stages for optimal yield, not just in aggregate.
The weakening link between monsoon and broader economic trends may also stem from the declining dominance of agriculture in the rural economy. Agriculture now contributes about 18% to India’s GDP and only a quarter of the rural economic output, signaling a structural shift that buffers the economy from monsoon volatility. In essence, while monsoons remain important, India’s economy is gradually becoming more resilient to their unpredictability.
India remains an agrarian economy, with agriculture contributing around 18% to the nation’s Gross Value Added (GVA). The sector employs a significant portion of the population and relies heavily on rainfall, especially for Kharif crops like rice, pulses, cotton, and soybeans.
61% of Indian farmers sow Kharif crops before the monsoon begins.
55% of India’s net sown area is rain-dependent.
75% of India’s annual rainfall occurs during these four months, replenishing the country’s limited 4% share of global freshwater resources.
Irrigation has expanded, but over-dependence on groundwater has raised sustainability concerns. A poor monsoon can result in reduced yields, higher food inflation, and stressed rural incomes-impacting both livelihoods and consumption patterns.
The FMCG sector is closely tied to rural demand and agricultural output. Crop failures or poor harvests affect both the availability and cost of key raw materials. Weak rural income also leads to lower discretionary spending.
In FY24, under El Niño conditions, the Nifty FMCG Index grew just 17.5%, underperforming the broader Nifty 50, which rose 30%.Major FMCG companies like ITC, Nestle, and HUL saw declines in stock prices between June and September 2023.
While some firms, like ITC, were buffered by diversified operations, others faced pressure from reduced agricultural supply and falling rural consumption.
Rural income drives demand for two-wheelers and tractors, making these segments highly sensitive to monsoon outcomes.
Mahindra & Mahindra, India’s top tractor maker, saw tractor sales fall 3% from April to December 2023 due to weak agricultural performance.
Hero MotoCorp and TVS Motor expect improved rural demand if monsoons are normal in 2024.
A good monsoon raises disposable income in rural households, boosting auto sales and stimulating the broader rural economy.
The financial sector, particularly rural banking, sees cyclical changes tied to rainfall.
Good monsoons lead to higher farm incomes and increased savings account deposits.
Banks use these deposits to issue loans, sustaining the rural credit cycle and consumption.
Conversely, weak monsoons can increase loan defaults and reduce credit flow, affecting financial inclusion and rural investment.
The power sector, especially hydroelectric generation, relies directly on monsoon-fed water bodies.
Monsoons replenish reservoirs that power hydroelectric plants, which are a significant component of India’s renewable energy mix.
Wind energy, another renewable source, peaks during monsoon months.
Strong and well-distributed rainfall ensures steady electricity supply, reduces reliance on fossil fuels, and supports India's renewable energy goals.
While monsoon predictions dominate news cycles and are vital for certain sectors, market movements are largely driven by broader macroeconomic, political, and global cues. Reforms, fiscal policies, global market trends, geopolitical tensions, and monetary policy decisions typically play a more decisive role than whether it rains 90% or 105% of average.
Normal monsoon forecasts may offer some reassurance to the markets, particularly for companies with significant rural exposure. However, investors should be cautious in equating rainfall data with direct market outcomes. Historical patterns suggest that monsoons alone are poor predictors of annual stock market returns. Instead, it's the interaction of policy, global trends, and economic developments that truly move the needle.
Discover investment portfolios that are designed for maximum returns at low risk.
Learn how we choose the right asset mix for your risk profile across all market conditions.
Get weekly market insights and facts right in your inbox

It depicts the actual and verifiable returns generated by the portfolios of SEBI registered entities. Live performance does not include any backtested data or claim and does not guarantee future returns.
By proceeding, you understand that investments are subjected to market risks and agree that returns shown on the platform were not used as an advertisement or promotion to influence your investment decisions.
"I was drawn to Wright Research due to its multi-factor approach. Their Balanced MFT is an excellent product."

By Prashant Sharma
CTO, Zydus
By signing up, you agree to our Terms and Privacy Policy
"I was drawn to Wright Research due to its multi-factor approach. Their Balanced MFT is an excellent product."
By Prashant Sharma
CTO, Zydus
Skip Password
By signing up, you agree to our Terms and Privacy Policy
"I was drawn to Wright Research due to its multi-factor approach. Their Balanced MFT is an excellent product."
By Prashant Sharma
CTO, Zydus
"I was drawn to Wright Research due to its multi-factor approach. Their Balanced MFT is an excellent product."
By Prashant Sharma
CTO, Zydus
Log in with Password →
By logging in, you agree to our Terms and Privacy Policy
"I was drawn to Wright Research due to its multi-factor approach. Their Balanced MFT is an excellent product."
By Prashant Sharma
CTO, Zydus
Log in with OTP →
By logging in, you agree to our Terms and Privacy Policy
"I was drawn to Wright Research due to its multi-factor approach. Their Balanced MFT is an excellent product."
By Prashant Sharma
CTO, Zydus
Answer these questions to get a personalized portfolio or skip to see trending portfolios.
Answer these questions to get a personalized portfolio or skip to see trending portfolios.
(You can choose multiple options)
Answer these questions to get a personalized portfolio or skip to see trending portfolios.
Answer these questions to get a personalized portfolio or skip to see trending portfolios.
Answer these questions to get a personalized portfolio or skip to see trending portfolios.
(You can choose multiple options)
Investor Profile Score
We've tailored Portfolio Management services for your profile.
View Recommended Portfolios Restart


