
With the ever-increasing interest in building wealth and achieving financial aspirations, mutual funds have emerged as a favored investment avenue for individuals seeking sound and diversified portfolios. Amidst this quest for fruitful investments, understanding the risk inherent in each mutual fund becomes paramount. This is where "standard deviation" emerges as a powerful statistical tool for investors by gauging risk and volatility within mutual funds.
In this comprehensive article, we will delve into standard deviation in mutual funds, what is standard deviation in mutual fund, standard deviation of a portfolio and unraveling standard deviation's pivotal role in portfolio management.
What is Standard Deviation in Mutual Funds?
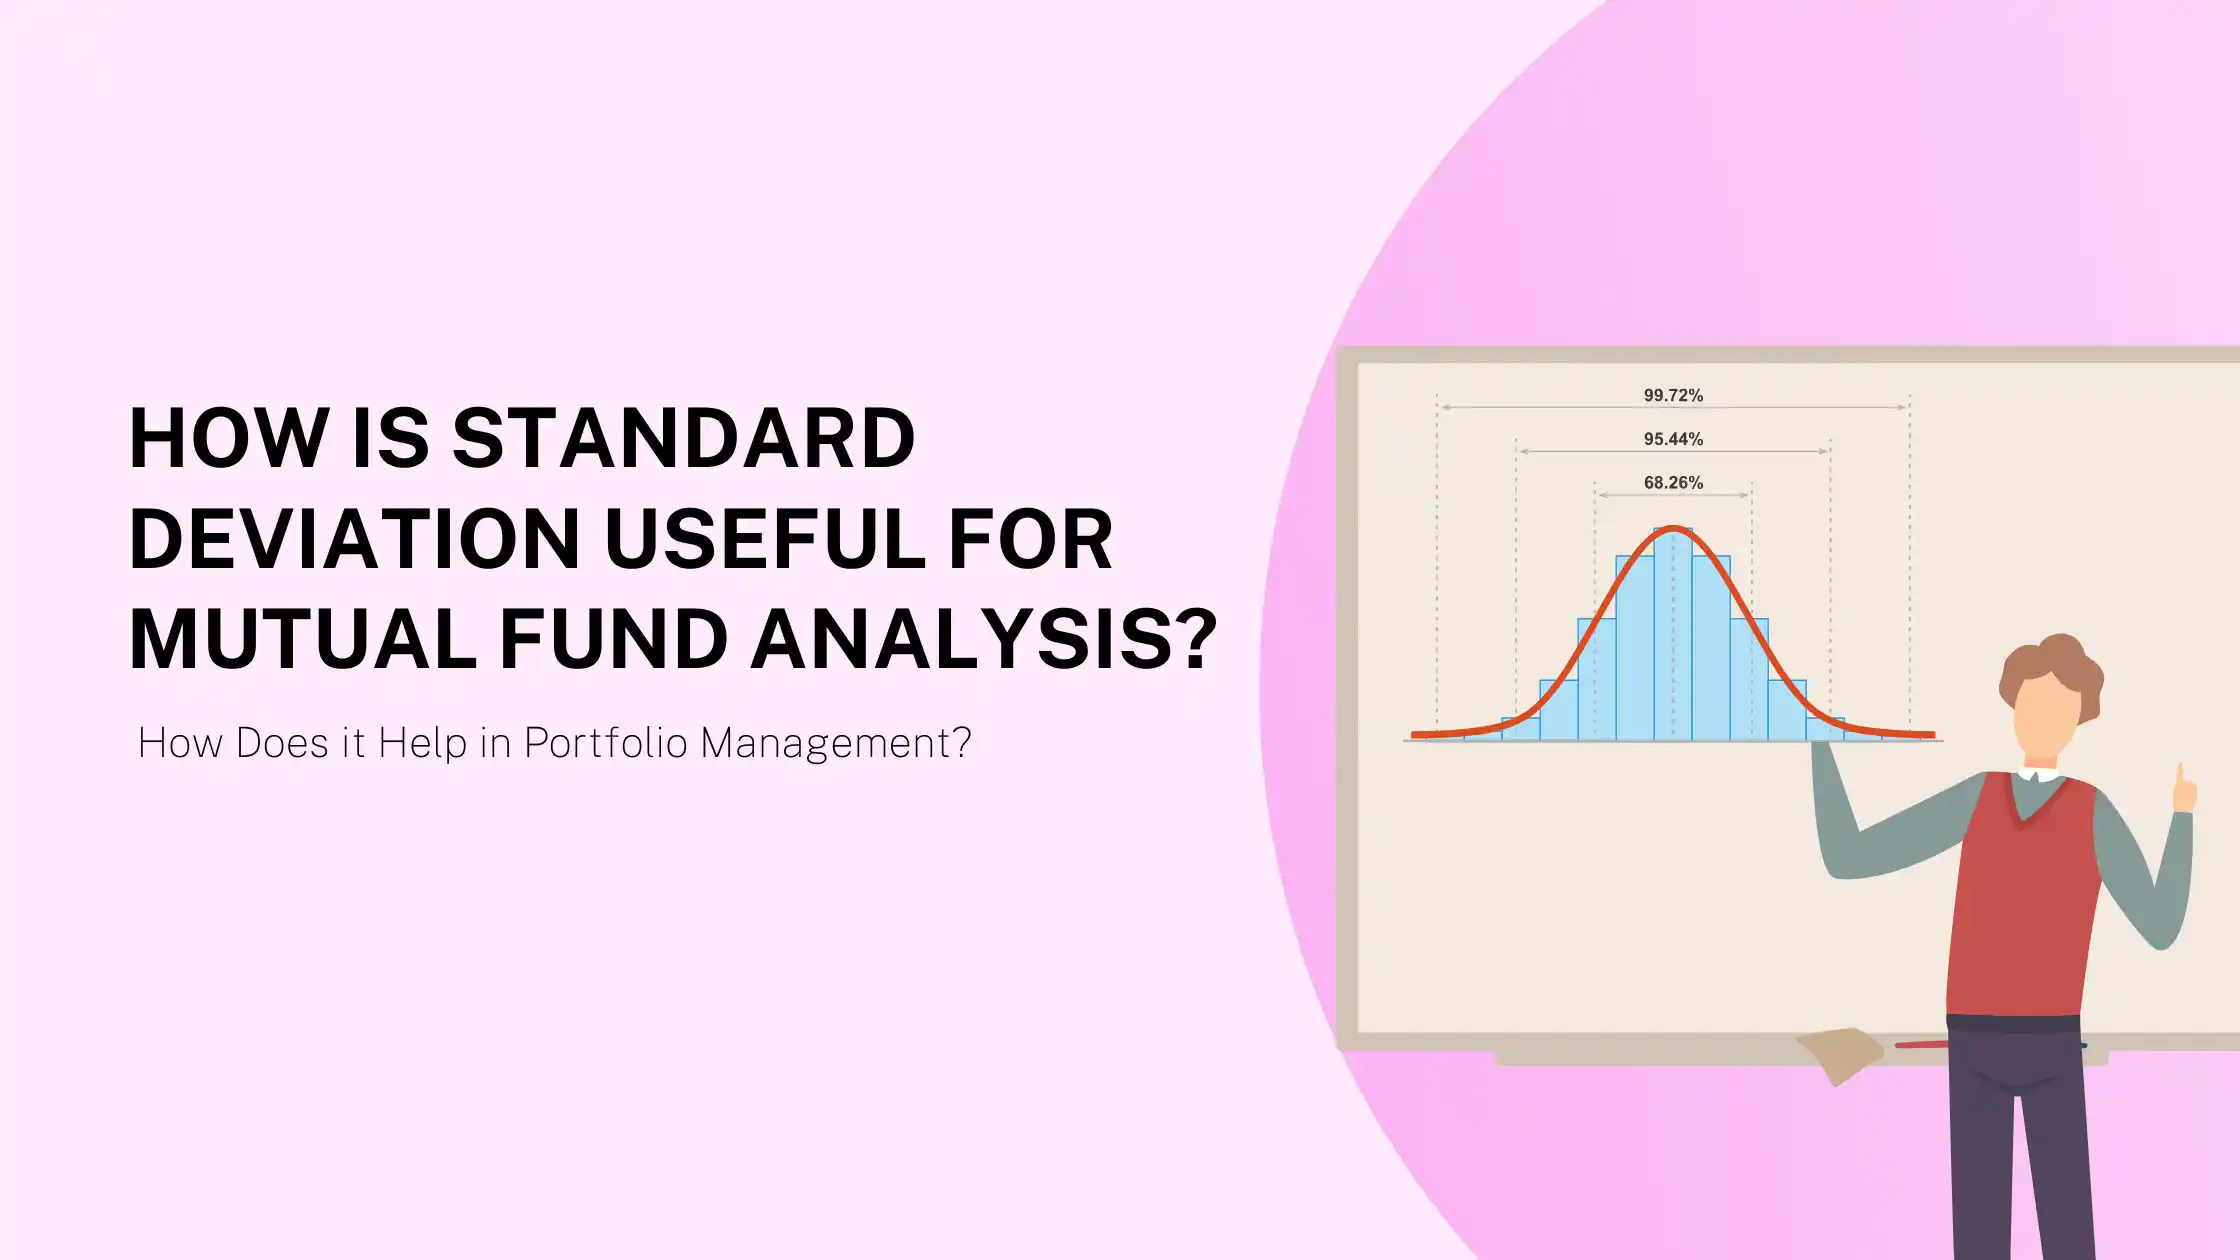
Standard deviation is a statistical term that quantifies the degree of variation or dispersion of a set of data points from the mean (average) value. In the context of mutual funds, standard deviation measures the historical volatility of a fund's returns over a specific period. When considering what is standard deviation in mutual funds, it's important to understand that a higher standard deviation reflects greater volatility, implying higher risk and potential reward. Thus, analyzing the standard deviation of mutual funds is essential for investors aiming to match their risk tolerance with their investment choices.
To understand what is standard deviation in mutual funds in simple terms, standard deviation provides investors with a measure of how much a mutual fund's performance can deviate from its average return. A fund with a low standard deviation indicates more stable returns, while a fund with a high standard deviation suggests more erratic and unpredictable performance.
Run the numbers on your next investment
Project returns on a lumpsum or SIP with our free calculators.
The Role of Standard Deviation in Portfolio Management
Portfolio management involves constructing and managing a diversified collection of investments to achieve the best possible risk-adjusted returns. Standard deviation plays a crucial role in this process as it helps investors assess the risk associated with adding a particular mutual fund to their portfolio.
When building a portfolio, investors often aim to diversify their holdings to spread risk across different assets or asset classes. By including mutual funds with varying standard deviations, investors can balance the overall risk of the portfolio. Funds with low standard deviations act as stabilizers, providing consistent, albeit modest, returns, while funds with higher standard deviations have the potential to generate higher returns but also carry more significant risks.
Furthermore, standard deviation allows investors to compare the risk profiles of different mutual funds. For instance, if two funds have similar average returns, the one with the lower standard deviation is generally considered less risky and thus more attractive for risk-averse investors.
Calculating Standard Deviation of a Portfolio
The standard deviation of a portfolio is a fundamental concept in finance that provides valuable insights into the risk and volatility of investments. Calculating the standard deviation of a portfolio's historical returns involves the following steps:
Determine the Expected Return: Calculate the expected return of each asset in the portfolio based on historical data or projected earnings.
Calculate Individual Asset Variance: Find the variance for each asset by calculating the average of the squared differences between each return and the expected return.
Compute Covariance: Determine the covariance between each pair of assets in the portfolio. Covariance measures how two assets move in relation to each other.
Apply the Formula: Use the formula for standard deviation of a portfolio, which incorporates the variances and covariances of the assets:
While the concept of standard deviation is essential, it's worth noting that investors usually rely on financial websites, fund fact sheets, and brokerage platforms to access this information, as they automatically calculate and provide these statistical measures.
What is Considered a Good Standard Deviation in Mutual Funds?
There is no one-size-fits-all answer to what constitutes a "good" standard deviation in mutual funds, as it largely depends on an investor's risk tolerance and investment goals. Some investors are willing to accept higher levels of risk to pursue potentially higher returns, while others prioritize capital preservation and prefer lower-risk investments.
As a general guideline, conservative investors may find mutual funds with lower standard deviations more appealing, typically below 10%. Moderate investors may consider funds with standard deviations ranging between 10% to 20%, while aggressive investors who can tolerate higher risk might consider funds with standard deviations above 20%.
Ultimately, investors should carefully assess their risk tolerance and investment objectives before choosing mutual funds with suitable standard deviations for their portfolios.
Get research like this in your inbox
The week’s research that mattered, in five minutes. Joined by 2L+ investors.
Importance of Standard Deviation in Mutual Fund Investing
Standard deviation provides valuable insights for mutual fund investors, including:
Risk Assessment: Standard deviation helps investors gauge the level of risk associated with a particular mutual fund. It allows them to understand the potential range of returns the fund may experience, helping them make informed decisions.
Diversification: Incorporating mutual funds with different standard deviations in a portfolio enables diversification, reducing overall risk without necessarily sacrificing returns.
Performance Comparison: When comparing multiple mutual funds with similar average returns, the one with the lower standard deviation is generally considered less risky and may be favored by risk-averse investors.
Volatility Understanding: Standard deviation helps investors comprehend the fund's volatility, which can be useful in managing expectations during turbulent market conditions.
Limitations of Standard Deviation
While standard deviation is a valuable tool for assessing risk, it does have certain limitations:
Historical Perspective: Standard deviation is based on historical data, and past performance may not always be indicative of future results. Market conditions and fund strategies can change, leading to different outcomes.
Singular Measure: Standard deviation only provides information about the dispersion of returns and does not account for other types of risks, such as credit risk, liquidity risk, or geopolitical risk.
Assumption of Normal Distribution: Standard deviation assumes a normal distribution of returns, which may not always be the case in financial markets, especially during extreme events or crises.
Limited to Numeric Data: Standard deviation is only applicable to funds with numeric return data and may not be suitable for assessing the risk of other asset types, like real estate or commodities.
Conclusion
Standard deviation is a valuable statistical measure in the world of mutual fund investing. It serves as an essential tool for assessing risk, comparing different funds, and constructing well-diversified portfolios. By understanding the role of standard deviation and its limitations, investors can make more informed decisions and align their mutual fund investments with their risk tolerance and financial goals. Remember that while standard deviation provides valuable insights, it should be used in conjunction with other performance metrics and research when making investment choices. As with any investment, seeking the guidance of a qualified financial advisor is recommended to develop a well-rounded investment strategy tailored to individual needs and circumstances. Happy investing!
Check out this interesting article on Smallcase vs Mutual Fund: Understand Difference and Similarities
See what markets are pricing in
Live indices, sector moves and market breadth — the backdrop to every story we publish.
FAQs
How standard deviation reflects the volatility and riskiness of a mutual fund?
Standard deviation reflects the volatility and riskiness of a mutual fund by measuring the dispersion of returns from its average return. Higher standard deviation indicates higher variability, implying greater risk.
Formula for calculating standard deviation of a portfolio?
The formula for calculating the standard deviation of a portfolio involves several steps:
a) Calculate the portfolio's average return.
b) Calculate the difference between each return and the average return.
c) Square the differences and sum them up.
d) Divide the sum by the number of data points (returns).
e) Take the square root of the result to get the standard deviation.
Why standard deviation is the single best mutual fund and ETF risk measurement?
Standard deviation is often touted as the best risk measurement tool for mutual funds and ETFs due to its comprehensive approach. It reflects the volatility of a fund's returns, capturing the spread of an investment's possible outcomes. Standard deviation takes into account both the upside potential and downside risk, offering a balanced perspective. While there are other risk measures like Beta, Sharpe Ratio, etc., standard deviation stands out for its simplicity, versatility, and broad applicability. It offers a straightforward numerical representation of volatility, making it an excellent first-step measure for investors assessing fund risk.
What does a high standard deviation in a portfolio mean?
A high standard deviation in a portfolio means that the returns have experienced significant fluctuations from the average return. It implies higher volatility and greater potential for both positive and negative returns.
Is it better to have high standard deviation?
Having a high standard deviation depends on the investor's risk tolerance and investment goals. Higher standard deviation indicates higher risk and potential for higher returns. It may be suitable for investors seeking aggressive growth but may not be suitable for those with a low-risk appetite.
How standard deviation as a risk measurement tool will help in making informed investment decisions?
Standard deviation, as a risk measurement tool, provides investors with vital insights into a mutual fund's historical volatility. By understanding how much a fund's returns deviate from its average return, investors can assess the level of uncertainty or risk associated with that investment. This information is vital when constructing a portfolio, as it enables investors to balance higher-risk and lower-risk investments according to their individual risk tolerance and financial goals. Furthermore, standard deviation can be used to compare the riskiness of different funds, aiding in the selection process. Ultimately, using standard deviation as part of their analysis can help investors make more informed, risk-adjusted decisions in their investment journey.


